

 PDF
PDF ePub
ePub Citation
 Print
Print


INTRODUCTION
Hypertension, or high blood pressure, affected 26.4% of the world's adult population (972 million) in 2000, and this rate is expected to increase to 29.2% (1.56 billion) by 2025 (1). Hypertension is a major contributor to the global disease burden and was responsible for 7.0% of all disability-adjusted life years in 2010 (2). It is associated with at least 7.6 million deaths per year worldwide (13.5% of all deaths), making it the leading risk factor for cardiovascular disease (CVD) (3). High blood pressure has been identified as a leading risk factor for health problems in both developing and developed countries (3).
During the past 3 decades, the number of people with uncontrolled hypertension has increased to approximately 1 billion worldwide. Those with silent hypertension are often susceptible to premature myocardial infarction and haemorrhagic stroke (45). Among hypertensive individuals, 25.2%–75.0% are aware of their hypertension, and among those aware of their hypertension status, treatment rates range from 37.9%–89.6%. In developed countries, 18.7%–54.5% of treated hypertensive patients attain their blood pressure goals (1).
The importance of blood pressure as a modifiable risk factor for CVD is well-recognized, and many effective and inexpensive blood pressure-lowering treatments are available. Therefore, hypertension control and prevention of subsequent morbidity and mortality clearly should be achievable (3). Education to encourage screening and adequate treatment is an essential part of the strategy to reduce the burden of disease associated with hypertension. Education strategies first require assessing the factors that are associated with awareness, treatment, and control of hypertension in the target population (16). Lower rates of preventive interventions among low socioeconomic populations have been reported in countries that have a universal coverage healthcare system (7). However, little is known about the possible socioeconomic inequalities in secondary prevention among hypertension patients. Information about the prevalence, awareness, and control of hypertension in different types of communities is necessary not only to provide a baseline for monitoring the development and implementation of new strategies, but also to allocate appropriate healthcare resources (6).
In this study, hypertension risk factors were evaluated according to the prevalence, awareness, and control of hypertension. We specifically investigated socioeconomic disadvantages and weaknesses within the context of the Korean universal health insurance system. The findings will be useful for public health decision-makers and healthcare professionals.
MATERIALS AND METHODS
Data sources and participants
This study was based on data obtained from the 2010–2013 Korea National Health and Nutrition Examination Survey (KNHANES V), a nationwide survey examining the general health and nutrition status of the Korean population. It included 4 distinct measures: a health interview survey, health behaviour survey, health examination, and health nutrition survey. A stratified, multistage probability sampling design was used.
The response rates were 81.9% in 2010, 80.4% in 2011, 80.0% in 2012, and 79.3% in 2013. A total of 20,044 subjects older than 30 years of age were included after excluding subjects with missing data.
Measurements and variables
According to standard protocol, trained nurses measured systolic blood pressure (SBP) and diastolic blood pressure (DBP) using a mercury sphygmomanometer (Baumanometer; WA Baum Co, Inc., New York, NY, USA) on the right arm of the subject while sitting after resting for 5 minutes. Blood pressure was measured thrice, and the second and third measurements were averaged. Subjects were asked to refrain from smoking for 30 minutes before the measurements (8).
Hypertension was defined as; 1) a self-reported previous diagnosis of hypertension made by a physician, 2) current use of antihypertensive medication, or 3) SBP ≥ 140 mmHg or DBP ≥ 90 mmHg. Participants with hypertension who reported that they had not been diagnosed with this condition or did not take antihypertensive medication were classified as having undiagnosed hypertension. Subjects were considered to have uncontrolled hypertension if they had an average SBP ≥ 140 mmHg or an average DBP ≥ 90 mmHg.
Current smoking was defined as having smoked 100 cigarettes in one's lifetime and currently smoking cigarettes. Current drinking was defined as alcohol intake more than once per month during the past 12 months (9). Central obesity was defined as a waist circumference of at least 90 cm in men and at least 80 cm in women. Overweight was defined as a body mass index (BMI) of 25.0–29.9, and obesity was defined as a BMI of 30.0 or higher. A family history of hypertension was coded when first-degree relatives (parents or siblings) were reported to have the condition.
We used education and household income level as indicators of socioeconomic status. Educational attainment was categorized as follows: elementary school graduate or below, junior high school, high school graduate, and college graduate or above. Household income was considered to include wages, pensions, unemployment benefits, social security benefits, and bank interest. Household income was defined as the average monthly gross income divided by an equivalence factor (number of household members × 0.5) to adjust for differences in household size and composition. Income was categorized into quartiles.
Statistical analysis
We determined the prevalence and rates at which individuals were unaware of or had inadequate control over their condition by hypertension status. We compared these data between hypertension groups using χ2 square tests. We used survey sample weights to produce non-biased estimates for descriptive and analytical data analyses (9).
We calculated prevalence ratios (PRs) instead of odds ratios, because this study was cross-sectional, and outcomes were frequent (10111213). Poisson regression models with robust variance were fitted to explore factors associated with the prevalence, unawareness, and inappropriate control of hypertension. Associations with socioeconomic status are presented as PRs and 95% confidence intervals (CIs). Analyses were conducted separately for men and women and were performed using SAS ver. 9.2 (SAS Institute, Cary, NC, USA).
RESULTS
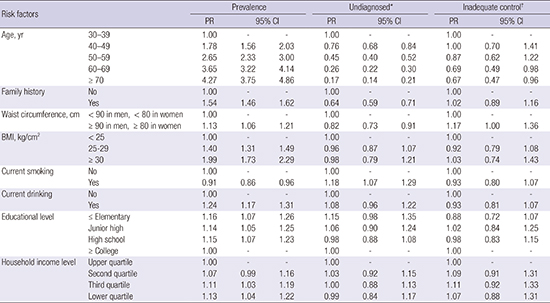
The prevalence of hypertension was estimated at 31.2% (95% CI, 30.2%–32.1%) among all Korean adults older than 30 years (9,178,130 individuals): 33.6% (95% CI, 32.4%–34.8%) among men and 28.9% (95% CI, 27.7%–30.1%) among women (Table 1). Of those with hypertension, 33.5% (95% CI, 31.9%–35.1%) had been unaware that they suffered from the condition (undiagnosed rate). The undiagnosed rate was higher among men than women. Among those with diagnosed hypertension, the prevalence of inadequately controlled hypertension (uncontrolled rate), defined as an average SBP ≥ 140 mmHg or an average DBP ≥ 90 mmHg, was 33.8% (95% CI, 32.1%–35.5%).
Table 1
Prevalence and undiagnosed and inadequate control rates of hypertension in Korea, 2010–2013
Hypertension prevalence increased with increasing age and decreased with increasing education and income level. Hypertension was more prevalent among those with overweight, obesity or family history of hypertension. Among those aged 30–40 years, the percentage of adults ever diagnosed with hypertension was lowest. Unawareness increased with higher education levels and incomes. The undiagnosed rate was more prevalent among subjects without a family history and among current smokers and drinkers. The diagnosed rate was significantly higher among those with central obesity.
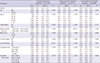
Results of the robust Poisson model showed the significant predictors of hypertension were older age, family history, and abdominal obesity among both men and women (Tables 2 and 3). There were socioeconomic inequalities in the prevalence of hypertension, with the highest prevalence in the lowest socioeconomic level among both men and women. The PR for men with an elementary school education level or less was 1.16, and the corresponding value for women was 1.86, indicating greater magnitude compared with men.
Table 2
Factors associated with prevalence and undiagnosed and inadequate control rates of hypertension in Korean men, 2010–2013
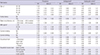
Table 3
Factors associated with prevalence and undiagnosed and inadequate control rates of hypertension in Korean women, 2010–2013
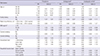
Age and family history were protective factors with regard to unawareness. Abdominal obesity was reversely associated with undiagnosed hypertension among both men and women. Current smoking was a risk factor for undiagnosed hypertension among men. We observed an inverse association between education level and undiagnosed hypertension among women, but not men. Socioeconomic level was not associated with inadequate control of hypertension among men or women.
DISCUSSION
The prevalence of hypertension was 31.2% in all adults older than 30 years. Projections based on sample weighting suggest that this may represent up to 9,178,130 individuals nationwide. Undiagnosed and uncontrolled rates were 33.5% and 33.8%, respectively. Despite men having higher rates of hypertension, men had lower awareness rates, consistent with a large body of research on sex and health-seeking behaviour (3). Control rates were similar between men and women. We found inverse associations between educational and household income levels and prevalence of hypertension among both men and women. Education level was inversely associated with undiagnosed hypertension among women, but not men. Income was not associated with diagnosis or control rates (8). Socioeconomic level was not associated with inadequate control of hypertension among men or women. The results of this study provide a reliable and meaningful snapshot of the current situation regarding levels of awareness and management of hypertension among Korean adults.
In 2009–2010, the prevalence of hypertension was 30.5% among men and 28.5% among women in the US: unawareness rates were 30.3% among men and 19.3% among women, and inappropriate control rates were 59.7% among men and 43.7% among women (14). A study conducted in England reported that in 2011, 30% of all adults aged 16 years or older had hypertension, and among these, the control rate was 37% (15). Another study reported that the prevalence of hypertension is 29% in the US, 19.5% in Canada (16), and 30% in England; that hypertension unawareness rates are 19% in the US, 17% in Canada, and 35% in England; and that uncontrolled rates are 47% in the US, 34% in Canada, and 73% in England (17). Despite differences between the present study and previous studies in terms of survey methods and analytic strategies, our results suggest that Korea has relatively lower rates of uncontrolled hypertension than do other developed countries. Korea had higher levels of unawareness than US and Canada, suggesting the nationwide demand for early diagnosis of high blood pressure in Korea. This difference might be associated with socioeconomic status, health behaviors, and accessibility to health care services. As with other chronic diseases, weaknesses in health care systems probably contribute to the inadequate awareness of hypertension (18). Factors relating to health systems are the presence of a usual source of care or health insurance. Interaction, information, emotional support, and social network resources may affect the risk of undiagnosed hypertension (19).
A previous study using the Korean National and Nutrition Survey 2001 reported a 22.9% prevalence rate for hypertension; rates of undiagnosed and uncontrolled hypertension were 69.8% and 89.3%, respectively (20). Therefore, the prevalence of hypertension appears to have increased, while rates of unawareness and uncontrolled hypertension have generally decreased over time. This change suggests that the overall management of hypertension has improved (21). Although considerable advances have been made in secondary prevention efforts, these low rates of diagnosis and control reflect many lost opportunities for reducing the growing burden of hypertension. Hypertension is strongly connected to modifiable risk factors that can be altered by making certain lifestyle changes. Public health systems should offer expanded primary prevention services based on a comprehensive approach incorporating several interrelated risks to health, including alcohol and tobacco use, central obesity, high BMI, physical inactivity, and inadequate consumption of fruits and vegetables (172223).
According to our robust Poisson model, age, obesity, family history, income, and education level were predictors of prevalence among both men and women (24). The prevalence of hypertension rose with increasing age, so lifestyle changes in young individuals should be further supported (232425).
Age and family history were protective factors against unawareness, and these findings are consistent with previous reports (1426). The protective effect of age may be attributed to increased screening due to age and/or the presence of other risk factors. Another plausible explanation is that elderly people are more worried about their health, particularly cardiovascular complications, compared with younger people, who generally enjoy good apparent health and are less concerned about cardiovascular problems (6). Therefore, national public healthcare policies need to stress early screening and education to reduce the increasing burden of hypertension among younger populations with undiagnosed hypertension (162127).
A family history of health problems increased awareness of hypertension. Having a family member with a health problem increases awareness about possible health complications among the entire family (16). Additionally, obese individuals are more likely to be aware of their hypertension than slimmer individuals, probably because they are in regular contact with primary health care providers to seek medical and dietary advice. These consultations are likely to increase their awareness of the underlying silent metabolic pathologies associated with excess body weight (6).
Advancing age is generally associated with a decline in hypertension control, especially in terms of the percentage of treated adults who are controlled. The declining control of hypertension with age among older adults likely reflects progressive increases in vascular stiffness (26). However, we found that the uncontrolled rate decreased with age among men with diagnosed hypertension. This likely reflects changes in provider and patient perceptions of complications, leading to more intensive pharmacotherapy, especially among older adults (26).
Inequalities in socioeconomic status were related to the prevalence of hypertension among both men and women. Low socioeconomic status may influence nutritional habits, physical inactivity, and other unhealthy behaviours that could affect the clustering of metabolic disorders (28). Targeting people of lower socioeconomic status may help to reduce socioeconomic inequalities in hypertension. Educational differences were associated with greater effects on the prevalence of hypertension among women than men. The difference can be explained by inequalities in health behaviours, because disadvantaged socioeconomic populations tend to be associated with a higher prevalence of obesity, less physical activity, and higher psychosocial risks, and these inequalities are observed more among women than men (293031).
Some research suggests that socioeconomically disadvantaged individuals are less likely to receive appropriate preventive care, and that universal health coverage may not be sufficient to reduce inequalities in preventive care. Many studies have shown that populations with less education and less income also have less access to health services and receive less intensive preventive care (7). However, we found no associations between household income level and awareness or control rates in the context of Korea's universal health insurance system, and educational levels were associated with diagnoses only among women. This is an encouraging finding, especially given the large socioeconomic inequalities characterizing many health outcomes (32), and it may suggest that optimal management does not differ according to socioeconomic status. Once a relatively high standard of access to care at the health system level is achieved, individual socioeconomic characteristics such as education or income are less likely to play an important role compared with when overall access remains poor (33). Since 1989, Korea's national health insurance has improved access to medical care. The Korean government provides universal medical check-ups every 2 years for anyone older than 40 years. Neither income nor education has a statistically significant association with the likelihood that a patient with diabetes will receive medical treatment (33), and secondary prevention of diabetes is not affected by educational level (28).
The positive association between education and awareness appears to be a more consistent finding in women. Health-related behaviors such as being screened by a healthcare professional, seeking advice, and attending educational sessions change with gender (19). Lower socioeconomic status and less education appear to be associated with less knowledge of risk factors of stroke in both sexes but in general women seem to have better knowledge of warning signs than men. Also, men more frequently mentioned stress, physical activity and smoking as risk factors of stroke, while women more often reported diabetes and hypertension, which may also be attributed to the more frequent medical visits of women (34).
Chronic diseases have been proposed as good tracer conditions that can help identify weaknesses in a national healthcare system (233335). Our findings contribute to a body of evidence that suggests that hypertension monitoring strategies should focus on prevalence and incidence trends as a function of social position. There is a need for governments and practitioners to work actively to continuously monitor and address disparities, and to be accountable for reducing gaps in the preventive and care services.
Several limitations of this study should be considered. First, the study was cross-sectional, so the evidence from this study is usually open to reverse causality bias. With regard to the association between hypertension and income level, it is possible that having a disease and suffering from its complications could lead to less affluence, rather than vice versa. However, education is less susceptible to reverse causation because most people have completed their schooling by the time they succumb to chronic diseases in adulthood (2336).
Second, our blood pressure levels were based on the average of 2 measurements at a single visit only; a standard clinical hypertension diagnosis requires 2 or more visits. Thus, hypertension status may have been incorrectly assigned to some individuals. Misclassification may be because of self-reported information, especially information on the use of antihypertensive medication. Nevertheless, this method has been supported as a way to establish the population-level prevalence of hypertension (826). Results from other countries or races are needed for the broadest interpretation and generalization of this study. Despite these concerns, this study suggests strengthening the screening for hypertension in primary health-care settings in the high risk groups and frequent health promotion to the community to enhance individual awareness and commitment of healthy living would be of immense value (37). Another major strength of this study is its use of population-based data, which reduced the likelihood of selection bias.
The chronic care model aims to transform the system of chronic disease care delivery from acute and reactive to proactive, planned, and population-based (38). Identifying missed opportunities for reducing illness and death from common chronic diseases could reduce long-term medical, social, and economic burdens. Monitoring is expected to reveal gaps in the preventive and care services offered to the most vulnerable individuals and may encourage governments and practitioners to address these gaps (23).
 XML Download