Journal List > J Korean Med Sci > v.32(5) > 1108574

Yoo, Choi, and Ha: Mean Hand Grip Strength and Cut-off Value for Sarcopenia in Korean Adults Using KNHANES VI

Abstract

The purpose of this study was to report age- and gender-specific distribution of the hand grip strength (HGS) using data from the Korea National Health and Nutrition Examination Survey (KNHANES) VI-3 (2015) survey and determine cut-off values for low muscle strength of HGS of Koreans. Of a total of 7,380 participants, 4,553 were subjected to measurements of HGS, including 1,997 men and 2,556 women with a mean age of 49.3 years (range, 19–80 years). The mean ages of men and women were 49.0 and 49.5 years, respectively. HGS was measured using a digital hand dynamometer. It was defined as maximal measured grip strength of the dominant hand. The cut-off value for low muscle strength was defined as the lower 20th percentile of HGS of the study population. Maximum grip strength of men was significantly higher than that of women (40.2 kg in men vs. 24.2 kg in women, P < 0.001). The mean HGS was increased from the age of 19 to 39 years. It was peaked in the age of 35 to 39 years range for both men and women. It was then decreased after 39 years. The cut-off values of HGS in male and female elderly healthy populations were 28.6 and 16.4 kg, respectively. These data might be used as reference values when evaluating sarcopenia and assessing hand injuries.

Graphical Abstract

jkms-32-868-ab001.jpg

INTRODUCTION

Hand grip strength (HGS) is a simple, fast, and reliable measurement to assess hand injuries and the maximum voluntary force. (1) It is an indicator of overall muscular strength, nutritional status, muscle mass, and walking performance (234). Recently, HGS has been used as important index of low muscle strength to diagnose sarcopenia because low HGS is a clinical marker of poor mobility and a better predictor of clinical outcome of low muscle mass (567). According to guideline for European working group on sarcopenia in older people (EWGSOP, the Sarcopenia Working Group), low muscle strength using cut-off point for HGS at two standard deviations below the mean reference value is defined as < 30 kg in men and < 20 kg in women. (8) Low muscle strength of HGS in the Asian Working Group for Sarcopenia (AWGS) is defined as < 26 kg in men and < 18 kg in women. (9) However, there is no formal data regarding HGS for Koreans.
The Korea National Health and Nutrition Examination Survey (KNHANES) designed to assess the health and nutritional status of adults and children living in Korea was initiated in 1998. The Korea Centers for Disease Control and Prevention (KCDC) administers this nationally representative survey. KNHANES is a nationwide representative cross-sectional survey for the Korean population with a clustered, multistage, stratified, and rolling sampling design. KNHANES consists of three sections: a health interview, a health examination, and a dietary survey. Survey data are collected through household interviews and direct standardized physical examinations conducted in specially equipped mobile examination centers. The KNHANES VI-3 (2015) survey measures HGS. (10)
The purpose of this study was to report age- and gender-specific distributions of HGS using data from the KNHANES VI-3 survey. In addition, cut-off values for low muscle strength of hand grip of Koreans were determined.

MATERIALS AND METHODS

Participants

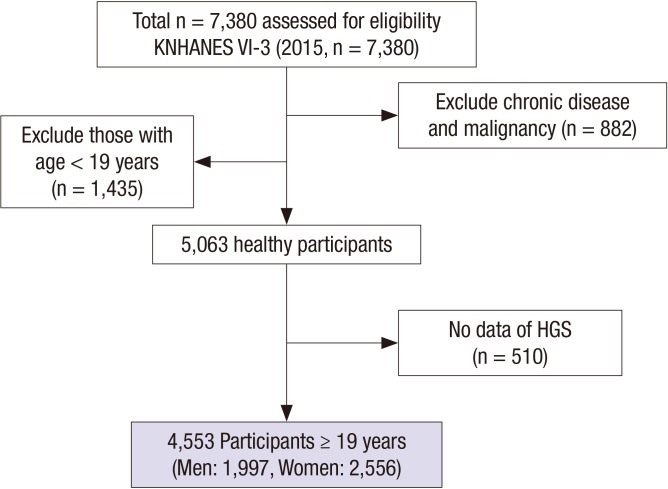
Through the KNHANES VI-3 survey program, data were collected from 7,380 participants. Exclusion criteria were: those who were under the age of 20 years (n = 1,435), those whose data were unavailable to evaluate HGS (n = 510), and those who had chronic diseases such as chronic kidney disease and liver cirrhosis and those who had history of stroke, myocardial infarction, diabetes, or malignancy (n = 882). After these exclusions, a total of 4,553 healthy participants were analyzed for the present study (Fig. 1).
Fig. 1
Selection process of study subjects from KNHANES VI-3.
KNHANES = Korea National Health and Nutrition Examination Survey, HGS = hand grip strength.
jkms-32-868-g001

Health examination survey

A health questionnaire was used to obtain information on age, gender, socioeconomic status, and educational status. Body weight and height were measured in light clothing without shoes. Body mass index (BMI) was calculated as weight (kg) divided by height squared (m2). Information for comorbidity including chronic disease and malignancy were examined through health interview survey.

Measurement of HGS

HGS was measured using a digital hand dynamometer (Digital grip strength dynamometer, T.K.K 5401, Takei Scientific Instruments Co., Ltd., Tokyo, Japan). Grip strength was measured in a standing position with the forearm away from the body at the level of the thigh. Participants were asked to apply the maximum grip strength three times with both left and right hands. Between each measurement, at least 30 seconds of resting interval was allowed. Grip strength was defined as the maximally measured grip strength of the dominant hand (11).

Cut-off value of HGS to determine sarcopenia

The EWGSOP recommends the use of normative (healthy young adult) rather than other predictive reference populations with cut-off value (for muscle strength) at 2 standard deviations below the mean reference value (8). However, reference data from a normative Korean population were unavailable to determine cut-off value for HGS. In the absence of normative reference populations, previous studies have used healthy older adults as their reference groups (applying cut-off values derived from the lowest gender-specific quartiles or quintiles) (9). To overcome this limitation, a healthy elderly population was selected from our study. Their gender specific quintile points (lowest 20%) were used as cut-off values.

Statistical analysis

All data entered into the database were verified by a second independent person. Descriptive statistics such as mean and standard deviation for normally distributed continuous variables and relative frequencies for categorical (qualitative) variables were generated for all variables.
In order to compare means between the non-sarcopenia group and the sarcopenia group, the Student's t-test was used. To compare proportions, the χ2 test was used.
The cut-off values for HGS were calculated using the lowest quintile points (lowest 20%) after adjusting for gender. Statistically significance was considered at P < 0.05. All statistical analyses were carried out with the statistical package SPSS Version 21.0 for Windows (IBM Corp., Armonk, NY, USA).

Ethics statement

This study's protocol for performing an analysis of the 2015 KNHANES data was reviewed and approved by the Institutional Review Board of the KCDC (Approval No. 2015-02CON-21-C). Informed consent was obtained from all participants when the 2015 KNHANES were conducted.

RESULTS

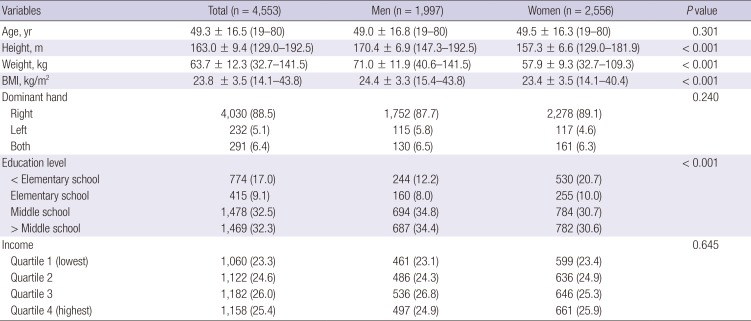
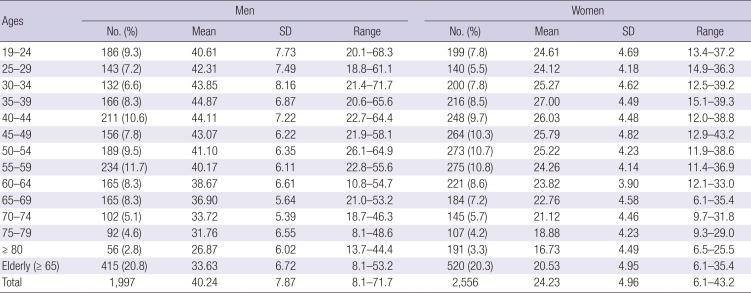
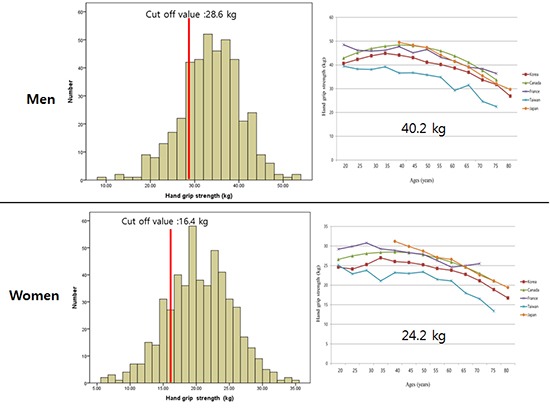
Of 4,553 healthy participants, 1,997 were in men and 2,556 were women. The mean age of this study population was 49.3 ±16.5 years (range, 19–80 years). The mean ages of men and women were 49.0 ±16.8 and 49.5 ±16.3 years, respectively. BMI of men was significantly (P < 0.001) higher than that of women. Education level also showed a significant (P < 0.001) difference between men and women (Table 1). The mean HGS was increased from 19 years to 39 years. It peaked in the range of 35 to 39 years in both men and women. After 39 years, it was decreased. The mean HGS of men was significantly higher than that of women (40.2 kg in men vs. 24.2 kg in women, P < 0.001; Table 2). A total of 935 (20.5%) participants (415 men and 520 women with mean age of 72.2 ± 5.1 and 72.6 ± 5.1 years, respectively) were included in the healthy elderly population to determine the cut-off values of HGS (28.6 kg for men and 16.4 kg for women; Fig. 2).
Table 1

Demographic characteristics of subjects used in this study

jkms-32-868-i001
Variables Total (n = 4,553) Men (n = 1,997) Women (n = 2,556) P value
Age, yr 49.3 ± 16.5 (19–80) 49.0 ± 16.8 (19–80) 49.5 ± 16.3 (19–80) 0.301
Height, m 163.0 ± 9.4 (129.0–192.5) 170.4 ± 6.9 (147.3–192.5) 157.3 ± 6.6 (129.0–181.9) < 0.001
Weight, kg 63.7 ± 12.3 (32.7–141.5) 71.0 ± 11.9 (40.6–141.5) 57.9 ± 9.3 (32.7–109.3) < 0.001
BMI, kg/m2 23.8 ±3.5 (14.1–43.8) 24.4 ± 3.3 (15.4–43.8) 23.4 ± 3.5 (14.1–40.4) < 0.001
Dominant hand 0.240
 Right 4,030 (88.5) 1,752 (87.7) 2,278 (89.1)
 Left 232 (5.1) 115 (5.8) 117 (4.6)
 Both 291 (6.4) 130 (6.5) 161 (6.3)
Education level < 0.001
 < Elementary school 774 (17.0) 244 (12.2) 530 (20.7)
 Elementary school 415 (9.1) 160 (8.0) 255 (10.0)
 Middle school 1,478 (32.5) 694 (34.8) 784 (30.7)
 > Middle school 1,469 (32.3) 687 (34.4) 782 (30.6)
Income 0.645
 Quartile 1 (lowest) 1,060 (23.3) 461 (23.1) 599 (23.4)
 Quartile 2 1,122 (24.6) 486 (24.3) 636 (24.9)
 Quartile 3 1,182 (26.0) 536 (26.8) 646 (25.3)
 Quartile 4 (highest) 1,158 (25.4) 497 (24.9) 661 (25.9)
Values are presented as number (%) or mean ± SD (range).
BMI = body mass index, SD = standard deviation.
Table 2

Distribution of HGS (kg) in Korean adults by age category

jkms-32-868-i002
Ages Men Women
No. (%) Mean SD Range No. (%) Mean SD Range
19–24 186 (9.3) 40.61 7.73 20.1–68.3 199 (7.8) 24.61 4.69 13.4–37.2
25–29 143 (7.2) 42.31 7.49 18.8–61.1 140 (5.5) 24.12 4.18 14.9–36.3
30–34 132 (6.6) 43.85 8.16 21.4–71.7 200 (7.8) 25.27 4.62 12.5–39.2
35–39 166 (8.3) 44.87 6.87 20.6–65.6 216 (8.5) 27.00 4.49 15.1–39.3
40–44 211 (10.6) 44.11 7.22 22.7–64.4 248 (9.7) 26.03 4.48 12.0–38.8
45–49 156 (7.8) 43.07 6.22 21.9–58.1 264 (10.3) 25.79 4.82 12.9–43.2
50–54 189 (9.5) 41.10 6.35 26.1–64.9 273 (10.7) 25.22 4.23 11.9–38.6
55–59 234 (11.7) 40.17 6.11 22.8–55.6 275 (10.8) 24.26 4.14 11.4–36.9
60–64 165 (8.3) 38.67 6.61 10.8–54.7 221 (8.6) 23.82 3.90 12.1–33.0
65–69 165 (8.3) 36.90 5.64 21.0–53.2 184 (7.2) 22.76 4.58 6.1–35.4
70–74 102 (5.1) 33.72 5.39 18.7–46.3 145 (5.7) 21.12 4.46 9.7–31.8
75–79 92 (4.6) 31.76 6.55 8.1–48.6 107 (4.2) 18.88 4.23 9.3–29.0
≥ 80 56 (2.8) 26.87 6.02 13.7–44.4 191 (3.3) 16.73 4.49 6.5–25.5
Elderly (≥ 65) 415 (20.8) 33.63 6.72 8.1–53.2 520 (20.3) 20.53 4.95 6.1–35.4
Total 1,997 40.24 7.87 8.1–71.7 2,556 24.23 4.96 6.1–43.2
HGS = hand grip strength, SD = standard deviation.
Fig. 2
Determination of cut-off values (kg) in men (A) and women (B) using lowest quintiles (< 20%) in healthy elderly population.
HGS = hand grip strength.
jkms-32-868-g002

DISCUSSION

Although several studies have determined HGS, standard and nationally representative HGS reference values for Koreans are currently unavailable. For the first time, this study demonstrated age- and gender- specific distributions of right-hand and left-HGS using data from the KNHANES VI-3 survey. We also suggested the cut-off values for low muscle strength of HGS of Koreans. The principle findings of this study showed that the mean HGSs in men and women were 40.2 kg and 24.2 kg, respectively. It was increased from 19 to 39 years in age and peaked at age of 35 to 39 years for both men and women. After the age of 39 years, it was then decreased. In addition, cut-off values of HGS in the elderly healthy population were determined to be 28.6 kg for men and 16.4 kg for women.
In this study, the mean HGSs of Korean men and women older than 20 years were 40.2 kg and 24.2 kg, respectively. Comparing our data to those of other countries, data from France (46.2 kg in men and 28.2 kg in women) and Canada (44.1 kg in men and 26.4 kg in women) were higher than our results. However, data from Taiwan (35kg in men and 21.2 kg in women) and Japan (36.6 kg in men and 23.7 kg in women) were lower than our findings (Fig. 3A and B). (12131415) Comparing other studies performed in Korea, our findings were slightly lower than those of other studies using Koreans. For example, Shim et al. (16) measured HGS using 300 healthy participants between 20 and 77 years of age and reported that the mean HGS was 43 kg in men and 26.6 kg in women. Han et al. (17) have reported that the mean HGS using 515 healthy participants (234 men and 281 women) between 10 and 84 years was 41.8 kg in men and 25.2 kg in women. Lee et al. (18) have reported that the mean HGS using 479 healthy participants (248 men and 231 women) between 20 and 74 years was 40.8 kg in men and 25.1 kg in women. Although measurement methods, instrument, and participant's demographics were diverse in most studies, these studies all showed that HGSs had ethnic differences.
Fig. 3
Regional reports of HGS in men (A) and women (B) by age groups.
HGS = hand grip strength.
jkms-32-868-g003
HGS is considered as an important value when diagnosing sarcopenia. Lower muscle strength using HGS is mandatory to diagnose sarcopenia. EWGSOP group recommends that the mean reference cut-off value of hand grip is < 30 kg in men and < 20 kg in women. The AWGS group has defined the cut-off value of < 26 kg in men and < 18 kg in women. However, evaluation methods of the 2 representative guidelines are different. EWGSOP group assessed the cut-off value of HGS from healthy population. It used receiver operating curve analysis representing cutoff value to determine walking ability of participants. AWGS recommends the lower 20th percentile of HGS of the study population as the cut-off value for low muscle strength. In Japan, grip strength threshold was measured from healthy older adult population aged over 65 years with a mean age of 71.2 ± 4.9 years. It uses grip strength in the lowest 20% as reference after adjusting for gender. They reported that the cut-off values of HGS in elderly population were 28.8 kg in men and 18.2 kg in women. In this study, cut-off values of HGS in the elderly population were 28.6 kg in men and 16.4 kg in women. When our results are compared to cut-off values of HGS of AWGS and Japan, the cut-off values in men were similar. However, the cut-off value for women in this study was lower than that of other Asian references.
This study has several limitations. First, data used in the present study were from a cross-sectional design study. Prospectively designed studies are necessary to clarify the relationship between sarcopenia and HGS. Second, there were no data on physical performance. Therefore, it was impossible to determine the cut-off values to reflect the physical performance of EWGSOP or the foundation for the National Institutes of Health algorithms (819). Finally, comparison with other studies is very limited due to different measurement methods and/or instrument used for HGS and different demographic characteristics such as ethnic, age, gender, and BMI. Therefore, global standardizations of grip strength measurement are necessary to overcome these problems. In spite of these limitations, this study is worthy to first nationwide Korean study regarding grip strength.
In conclusion, the present study demonstrated that the mean HGSs in Korean men and women were 40.2 and 24.2 kg, respectively. The cut-off values of HGS in the elderly were determined to be 28.6 kg for men and 16.4 kg for women. These data could be used as reference values when evaluating sarcopenia and assessing hand injuries.

Notes

Funding: This research was supported by a grant (HI15C1189) of the Korea Health Technology R & D Project through the Korea Health Industry Development Institute (KHIDI) funded by the Ministry of Health and Welfare, Republic of Korea.

DISCLOSURE: No benefits in any form have been received or will be received from a commercial party related directly or indirectly to the subject of this article. The authors have no potential conflicts of interest to disclose.

AUTHOR CONTRIBUTION: Conceptualization: Yoo JI, Ha YC. Data curation: Choi H. Investigation: Yoo JI, Ha YC. Writing - review & editing: Yoo JI, Ha YC.

References

1. Bohannon RW. Muscle strength: clinical and prognostic value of hand-grip dynamometry. Curr Opin Clin Nutr Metab Care. 2015; 18:465–470. PMID: 26147527.
2. Birman MV, Solomon GS, Vender MI. Functional capacity evaluation in hand surgery. J Hand Surg Am. 2016; 41:133–134. PMID: 26710745.
3. Granic A, Jagger C, Davies K, Adamson A, Kirkwood T, Hill TR, Siervo M, Mathers JC, Sayer AA. Effect of dietary patterns on muscle strength and physical performance in the very old: findings from the newcastle 85+ study. PLoS One. 2016; 11:e0149699. PMID: 26934360.
4. Springstroh KA, Gal NJ, Ford AL, Whiting SJ, Dahl WJ. Evaluation of handgrip strength and nutritional risk of congregate nutrition program participants in Florida. J Nutr Gerontol Geriatr. 2016; 35:193–208. PMID: 27559854.
5. Lauretani F, Russo CR, Bandinelli S, Bartali B, Cavazzini C, Di Iorio A, Corsi AM, Rantanen T, Guralnik JM, Ferrucci L. Age-associated changes in skeletal muscles and their effect on mobility: an operational diagnosis of sarcopenia. J Appl Physiol. 1985; 2003:1851–1860.
6. Park HM, Ha YC, Yoo JI, Ryu HJ. Prevalence of sarcopenia adjusted body mass index in the Korean woman based on the Korean National Health and Nutritional Examination Surveys. J Bone Metab. 2016; 23:243–247. PMID: 27965946.
7. Yoo JI, Ha YC, Kwon HB, Lee YK, Koo KH, Yoo MJ. High prevalence of sarcopenia in Korean patients after hip fracture: a case-control study. J Korean Med Sci. 2016; 31:1479–1484. PMID: 27510394.
8. Cruz-Jentoft AJ, Baeyens JP, Bauer JM, Boirie Y, Cederholm T, Landi F, Martin FC, Michel JP, Rolland Y, Schneider SM, et al. Sarcopenia: European consensus on definition and diagnosis: report of the European Working Group on Sarcopenia in Older People. Age Ageing. 2010; 39:412–423. PMID: 20392703.
9. Chen LK, Liu LK, Woo J, Assantachai P, Auyeung TW, Bahyah KS, Chou MY, Chen LY, Hsu PS, Krairit O, et al. Sarcopenia in Asia: consensus report of the Asian Working Group for Sarcopenia. J Am Med Dir Assoc. 2014; 15:95–101. PMID: 24461239.
10. Kweon S, Kim Y, Jang MJ, Kim Y, Kim K, Choi S, Chun C, Khang YH, Oh K. Data resource profile: the Korea National Health and Nutrition Examination Survey (KNHANES). Int J Epidemiol. 2014; 43:69–77. PMID: 24585853.
11. Roberts HC, Denison HJ, Martin HJ, Patel HP, Syddall H, Cooper C, Sayer AA. A review of the measurement of grip strength in clinical and epidemiological studies: towards a standardised approach. Age Ageing. 2011; 40:423–429. PMID: 21624928.
12. Liu LK, Lee WJ, Liu CL, Chen LY, Lin MH, Peng LN, Chen LK. Age-related skeletal muscle mass loss and physical performance in Taiwan: implications to diagnostic strategy of sarcopenia in Asia. Geriatr Gerontol Int. 2013; 13:964–971. PMID: 23452090.
13. Yoshimura N, Oka H, Muraki S, Akune T, Hirabayashi N, Matsuda S, Nojiri T, Hatanaka K, Ishimoto Y, Nagata K, et al. Reference values for hand grip strength, muscle mass, walking time, and one-leg standing time as indices for locomotive syndrome and associated disability: the second survey of the ROAD study. J Orthop Sci. 2011; 16:768–777. PMID: 21975521.
14. Wong SL. Grip strength reference values for Canadians aged 6 to 79: Canadian Health Measures Survey, 2007 to 2013. Health Rep. 2016; 27:3–10.
15. Hogrel JY. Grip strength measured by high precision dynamometry in healthy subjects from 5 to 80 years. BMC Musculoskelet Disord. 2015; 16:139. PMID: 26055647.
16. Shim JH, Roh SY, Kim JS, Lee DC, Ki SH, Yang JW, Jeon MK, Lee SM. Normative measurements of grip and pinch strengths of 21st century Korean population. Arch Plast Surg. 2013; 40:52–56. PMID: 23362480.
17. Han SH, Nam KS, Ahn TK, Dan JM. Analysis of grip and pinch strength in Korean people. J Korean Orthop Assoc. 2009; 44:219–225.
18. Lee KS, Woo KJ, Shim JH, Lee GH. The clinical study of grip and pinch strength in normal Korean adults. J Korean Orthop Assoc. 1995; 30:1589–1597.
19. Studenski SA, Peters KW, Alley DE, Cawthon PM, McLean RR, Harris TB, Ferrucci L, Guralnik JM, Fragala MS, Kenny AM, et al. The FNIH sarcopenia project: rationale, study description, conference recommendations, and final estimates. J Gerontol A Biol Sci Med Sci. 2014; 69:547–558. PMID: 24737557.
TOOLS
Similar articles