

 PDF
PDF ePub
ePub Citation
 Print
Print


INTRODUCTION
Diabetic kidney disease (DKD) develops in 20%–40% of all patients with diabetes and is the major cause of end-stage renal disease (ESRD) (1). It is also associated with increased risk for cardiovascular disease and all-cause mortality in patients with diabetes (2). Therefore, preventing the development and progression of DKD is important when treating diabetes. It is also essential to identify markers that can predict its development and progression.
Many studies have revealed the important pathophysiological effects of hypertension and organ injury caused by the local renin-angiotensin system (RAS) on the brain (3), heart (4), adrenal glands (5), vasculature (6), and kidneys (7). The intrarenal RAS plays a significant role in the pathogenesis of DKD (78). Earlier, quantitative relationships have been established between urinary levels of angiotensinogen (AGT), intrarenal AGT levels, and angiotensin II production (9). Therefore, urinary levels of AGT could serve as a specific index for intrarenal RAS activity.
We previously showed that urinary levels of AGT were associated with albuminuria and were correlated with urinary tubular marker levels in patients with type 2 diabetes (10). In addition, high levels of urinary AGT were associated with a decrease in renal function in such patients and may serve as an early biomarker of DKD (11). As expected, angiotensin II type 1 receptor blocker (ARB) treatment reduces urinary AGT levels and the higher excretion of urinary AGT before treatment with ARB correlates with the greater ARB-induced reduction in urinary albumin-to-creatinine ratio (ACR) (12). However, previous studies have not investigated whether changes in urinary AGT excretion are associated with a decline in kidney function in type 2 diabetes patients. In this study we evaluated whether changes in urinary AGT levels had clinical impacts on deterioration of DKD by assessing the annual change in estimated glomerular filtration rate (eGFR) and whether the use of RAS inhibitors affect change in urinary AGT levels, particularly in type 2 diabetes patients with preserved kidney function.
MATERIALS AND METHODS
Patients
A total of 118 patients with type 2 diabetes were consecutively enrolled in the outpatient department of Pusan National University Hospital between February 2010 and January 2011, as described previously (10). The subjects were participating in the DKDs; we assessed the utilities of early DKD biomarkers. Briefly, type 2 diabetes patients with eGFR ≥ 60 mL/min/1.73 m2 who were not taking RAS blockers were enrolled at baseline. Patients with active urinary tract infections and any history of other acute and/or chronic disorders affecting the urinary system were excluded.
Patients were followed-up in the outpatient clinic until December 2015. Urine samples for AGT measurement were obtained at baseline and 1 year later (12 ± 1 months). Serum levels of creatinine (Cr) (which allowed eGFRs to be estimated) were measured at intervals of 6 ± 1 months during the follow-up period. Twenty-seven patients were excluded during follow-up: 18 did not provide 1-year urine samples; 2 died from other causes; 4 were hospitalized with active infections; and 3 were diagnosed with malignancies. Finally, 91 patients were enrolled and their data were analyzed.
Measurement of urinary AGT levels
Random spot urine and blood samples were obtained from each subject at each outpatient visit. The urine samples were stored at −80°C prior to analysis. Urine samples were centrifuged for 10 minutes at 3,000 rpm to remove particulate matter and stored at −70°C. Urinary levels of AGT were measured using a commercial enzyme-linked immunosorbent assay (ELISA) (Angiotensinogen ELISA JP27412 Kit; Immuno-Biological Laboratories Co., Ltd., Gunma, Japan) as reported previously (13). The inter- and intra-assay coefficients of variation were 4.3%–7.0% and 4.4%–5.5%, respectively. The detection limit of the AGT assay was 0.03 ng/mL. Values below this level were recorded as a mean of zero and the lower limit of the cut-off, but only when the number of samples under the cut-off was < 5% of the total. Urinary levels of AGT were normalized to the urinary levels of Cr and expressed in μg/g Cr.
Definitions
Changes in urinary levels of AGT (ΔAGT) were calculated by subtracting urinary AGT/Cr at baseline from urinary AGT/Cr after 1 year. eGFR levels were calculated using the Chronic Kidney Disease Epidemiology Collaboration (CKD-EPI) equation (14):
eGFR = 141 × min (serum Cr/kappa, 1)alpha × max (serum Cr/kappa, 1)−1.209 × 0.993age × 1.018 (if female) × 1.159 (if black)
For females, the following values were used: alpha = −0.329 and kappa = 0.7. For males, the following values were used: alpha = −0.411 and kappa = 0.9. The annual rate of eGFR change (mL/min/1.73 m2/year) was determined from the slope calculated by linear regression analysis of all eGFR measurements for each individual during follow-up.
Statistical analysis
All statistical analyses were performed using SPSS software, version 18.0 (SPSS Inc., Chicago, IL, USA). Continuous variables are presented as means ± standard deviations (SDs) or as medians with interquartile ranges (IQRs); categorical variables are presented as numbers with percentages. Pearson's correlation coefficient was used to test the correlations between individual variables. We conducted multivariate regression analyses with annual rates of eGFR change as the dependent variable and urinary AGT at baseline and change in urinary AGT as independent variables, respectively. Several models were gradually built to adjust for confounding factors. Continuous variables that were not normally distributed (skewness and kurtosis) were log-transformed prior to analysis. A P value < 0.05 derived using the 2-tailed t-test was considered to indicate statistical significance.
RESULTS
Baseline patient characteristics and parameters correlated with annual change in eGFR
The baseline patient characteristics are shown in Table 1. A total of 35 males and 56 females were included, with a mean age of 56 ± 10 years and with a mean hemoglobin A1c (HbA1c) level of 7.62% ± 1.61%. All patients had well-conserved renal function; the average eGFR was 90.79 ± 15.26 mL/min/1.73 m2. The median urine ACR was 23.45 (8.73–87.55) mg/g Cr. ACR values were in the normal to mildly increased range for albuminuria (< 30 mg/g Cr) in 49 patients, while 28 patients had moderately increased albuminuria (30–299 mg/g Cr), and 14 patients had severely increased albuminuria (≥ 300 mg/g Cr). The median urinary level of AGT/Cr was 12.48 (6.74–31.39) μg/g Cr.
Table 1
Baseline characteristics of participants
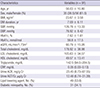
Data are expressed as mean ± SD and median (IQR) for continuous variables and frequencies (%) for categorical variables.
BMI = body mass index, DM = diabetes mellitus, SBP = systolic blood pressure, DBP = diastolic blood pressure, HbA1c = hemoglobin A1c, eGFR = estimated glomerular filtration rate, LDL = low-density lipoprotein, HDL = high-density lipoprotein, CRP = C-reactive protein, ACR = albumin-to-creatinine ratio, AGT = angiotensinogen, Cr = creatinine, SD = standard deviation, IQR = interquartile range.
![]()
The median follow-up period was 52 months (range, 10.0–69.0 months). During follow-up, the mean annual change in eGFR was −2.13 ± 6.88 mL/min/1.73 m2/year. HbA1c, urinary ACR, and AGT/Cr levels at baseline were inversely correlated with the annual change in eGFR (r = −0.275, P = 0.008; r = −0.462, P < 0.001; and r = −0.240, P = 0.022, respectively) (Table 2). However, the annual rate of eGFR change did not correlate with the age, body mass index, diabetes duration, blood pressure, or the lipid profile at baseline. In addition, the annual rates of eGFR change were not different between sex, use of lipid lowering agents or presence of diabetic retinopathy.
Table 2
Parameters that correlated with annual eGFR change
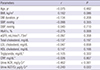
eGFR = estimated glomerular filtration rate, BMI = body mass index, DM = diabetes mellitus, SBP = systolic blood pressure, DBP = diastolic blood pressure, HbA1c = hemoglobin A1c, LDL = low-density lipoprotein, HDL = high-density lipoprotein, CRP = C-reactive protein, ACR = albumin-to-creatinine ratio, AGT = angiotensinogen, Cr = creatinine.
*Logarithm-transformed values were used for analysis.
![]()
Associations of ΔAGT with change in eGFR during follow-up
In crude model, both urinary AGT/Cr at baseline and ΔAGT were inversely correlated with the annual change in eGFR (β = −0.24, P = 0.022; β = −0.29, P = 0.006, respectively) (Table 3). The correlations with annual rate of eGFR change are shown in Fig. 1. In the fully adjusted model, both ΔAGT as continuous variables and ΔAGT dichotomized as an increased AGT (yes/no) remained significantly correlated with the annual eGFR change (β = −0.37, P = 0.001; β = −0.31, P = 0.005, respectively), but the correlation disappeared for urinary AGT/Cr at baseline (β = −0.09, P = 0.401) (Table 3).
Table 3
Association of change in eGFR with change in urinary AGT or increased urinary AGT
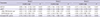
Multivariate linear regression analysis. B means unstandardized coefficient and β means standardized coefficient. Model 1: crude; Model 2: adjusted for baseline age, SBP, HbA1c, TG*, LDL cholesterol, HDL cholesterol, eGFR, AGT/Cr*; Model 3: adjusted for ACR* and use of lipid-lowering agent at baseline, use of RAS inhibitors during follow-up.
eGFR = estimated glomerular filtration rate, AGT = angiotensinogen, CI = confidence interval, Cr = creatinine, ΔAGT = changes in urinary levels of AGT, RAS = renin-angiotensin system, SBP = systolic blood pressure, HbA1c = hemoglobin A1c, TG = triglyceride, LDL = low-density lipoprotein, HDL = high-density lipoprotein, ACR = albumin-to-creatinine ratio.
*ACR, AGT/Cr, ΔAGT, and TG were logarithm-transformed.
![]()
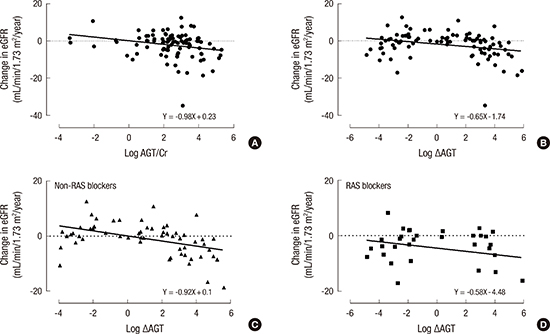
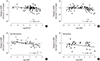 | Fig. 1Correlations with the annual change in eGFR. (A) AGT/Cr, urinary angiotensinogen/Cr at baseline. (B) ΔAGT, subtracting urinary AGT/Cr at baseline from urinary AGT/Cr after 1 year. (C) ΔAGT in non-RAS blockers users. (D) ΔAGT in RAS blockers users.
eGFR = estimated glomerular filtration rate, AGT = angiotensinogen, Cr = creatinine, ΔAGT = changes in urinary levels of AGT, RAS = renin-angiotensin system.
|
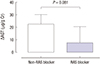
Although no patients were taking an RAS blocker when enrolled (baseline), RAS blockers were prescribed for 36.3% of patients (n = 33) during follow-up. As expected, baseline urinary AGT/Cr and ACR levels were higher in the RAS blocker users than in the non-RAS blocker users (22.07 [9.61–63.11] vs. 9.41 [3.73–39.10] μg/g Cr, P = 0.005; 119 [27.7–392.0] vs. 14 [6.53–39.10] mg/g Cr, P < 0.001, respectively). Comparing ΔAGT, there was a trend for decreased ΔAGT values in the RAS blockers users than in the non-RAS blocker users, but this difference was not significant (7.37 ± 75.88 vs. 22.55 ± 57.45 μg/g Cr, P = 0.081) (Fig. 2). In the subgroup analysis according to use of RAS blockers, ΔAGT significantly correlated with annual change in eGFR among patients who did not use RAS blockers (β = −0.44, P < 0.001), but not in those who took prescribed RAS blockers (β = −0.24, P = 0.184) (Table 3, Fig. 1). In the patients who did not use RAS blockers, the ΔAGT values remained significantly correlated with the annual rate of eGFR change after adjusting for clinical variables (β = −0.41, P = 0.001).
Associations of ΔACR with ΔAGT and change in eGFR during follow-up
Urinary albumin levels were additionally investigated in 1-year urine samples and ΔACR were defined by subtracting urinary ACR at baseline from urinary ACR after 1 year, as ΔAGT were calculated. ΔACR weakly correlated with ΔAGT (r = 0.224, P = 0.034). However, there was not shown any correlation between ΔACR and the annual eGFR change in the crude and fully adjusted model (β = 0.084, P = 0.431; β = 0.038, P = 0.715, respectively). In the subgroup analysis according to use of RAS blockers, ΔACR did not correlate with the annual eGFR change whether the patients used RAS blockers or did not (β = 0.161, P = 0.37 and β = −0.079, P = 0.559; β = 0.384, P = 0.154 and β = −0.003, P = 0.981, after adjusting for clinical factors).
DISCUSSION
In this study, we found an inverse correlation between ΔAGT and the annual rate of eGFR change in type 2 diabetes patients with preserved kidney function (eGFR ≥ 60 mL/min/1.73 m2). This study showed a trend for decreased ΔAGT values in the patients who used RAS blockers than those who did not use RAS blockers. ΔAGT values were inversely significantly correlated with change in eGFR among patients who did not use RAS blockers during the follow-up period, but not in those who used RAS blockers.
The renal RAS can induce renal damage mediated by transforming growth factor β-1, the synthesis of which is induced by angiotensin II. AGT, the rate-limiting enzyme of the RAS, is a marker for RAS activity; upregulation of AGT elevates the angiotensin level (1516). In the kidney, the nephrons of both the interstitial and intratubular compartments contain all RAS components necessary to produce intrarenal angiotensin II (17). Although the major source of circulating AGT is the liver, AGT is also produced in the proximal tubule cells of the kidney and is secreted directly into the tubular lumen (18). Urinary AGT originates from AGT synthesized and secreted by the proximal tubules; it is rarely derived from plasma (19). Therefore, the urinary excretion of AGT might provide a specific index of intrarenal angiotensin II activity (9).
Previous studies have suggested that the urinary level of AGT may reflect intrarenal RAS status, not only in patients with hypertension but also in those with chronic kidney disease (CKD) (2021). Recently, urinary AGT has been identified to be a potential biomarker specific for intrarenal RAS status in patients with diabetes mellitus (2223). We previously reported that urinary levels of AGT were correlated with both the extent of albuminuria and the levels of several markers of urinary tubular damage, including kidney injury molecule-1 (KIM-1) and neutrophil gelatinase-associated lipocalin (NGAL), in patients with type 2 diabetes. This supports the notion that intrarenal RAS activation promotes tubular damage during DKD development (10).
In an earlier study that assessed annual eGFR decline during a mean follow-up period of 23 months, urinary AGT was a suitable predictor of the deterioration of renal function in patients with CKD (20). Moreover, Sawaguchi et al. (23) found that urinary levels of AGT and albumin were positively correlated in patients with type 2 diabetes, and both were inversely correlated with the annual change in eGFR. However, we did not find a correlation between baseline urinary levels of AGT and the annual change in eGFR in the fully adjusted model. This disparity may be due to differences in each study's patient characteristics. Our subjects were type 2 diabetes patients with eGFRs ≥ 60 mL/min/1.73 m2 who were not taking RAS blockers at baseline, while other studies included partly or entirely diabetic patients with CKD or eGFRs < 60 mL/min/1.73 m2 at baseline (2023). In addition, in the present study, urinary levels of AGT (median 12.48 [6.74–31.39] μg/g Cr) were lower and narrower range than those of other studies.
Instead, we found that ΔAGT was inversely correlated with the annual change in eGFR. In the present study we investigated whether changes in urinary AGT levels predict deterioration of DKD as indicated by annual decline in eGFR. The results confirm our hypothesis; the 2 variables significantly correlate after adjusting for clinical factors. The strength of this study is that we show that changes in urinary AGT levels within the same individuals were associated with DKD progression, independently of other clinical factors including urinary ACR levels in type 2 diabetic patients with preserved eGFR.
Previous studies showed that RAS blockers reduced urinary levels of AGT in 13 hypertensive patients with type 2 diabetes mellitus and in 28 patients with CKD; this renoprotective effect was tentatively attributed to suppression of intrarenal AGT synthesis (1220). Similar to these studies, the present study showed a trend for decreased ΔAGT values in the patients who used RAS blockers than those who did not use RAS blockers although this difference was not statistically significant. Because we did not investigate the effects of RAS blockers on urinary AGT excretion prospectively, the interpretation of these results is limited. In our study, ΔAGT values remained inversely correlated with change in eGFR among patients who did not use RAS blockers during the follow-up period, but not in those who used RAS blockers. It may be caused by fewer patients who used RAS blockers, only 33 patients. Another possibility is that change in urinary AGT does not reflect well the renoprotective effect of RAS blockers because of other clinical factors, e.g. urinary ACR and blood pressure which are also influenced by RAS blockers.
In the additional analysis of ΔACR, ΔACR weakly correlated with ΔAGT. However, ΔACR was not correlated with the annual change in eGFR while ΔAGT was inversely correlated. Although limitations of a small number of subjects and 1-year changes of urinary AGT and ACR levels, these results suggest the possibility that ΔAGT is better and earlier index than ΔACR to predict deterioration of DKD. A large number of study subjects and changes of long-term follow-up may be required for more convincing results with sufficient statistical power.
This study had several limitations. First, the results were based on a small number of study subjects and a short follow-up period. Second, the present study showed clinical impacts on deterioration of DKD by only assessing the annual change in eGFR. This study did not show about other renal outcomes including dialysis, doubling of serum Cr or incident albuminuria. These renal outcomes occurred in few patients and could not have sufficient statistical power. Third, we did not examine time-update covariates such as HbA1c or urinary ACR. Forth, although a history of renovascular disease was not detected in the medical records of study subjects, we could not rule out the presence of renovascular disease in enrollment of patients because of not evaluating the kidney vasculature in all of the patients. Despite these limitations, this study demonstrated change in urinary AGT in the same individual was associated with annual change in eGFR in type 2 diabetes with preserved kidney function.
In conclusion, ΔAGT was inversely correlated with the annual change in eGFR in type 2 diabetes patients with preserved kidney function (eGFR ≥ 60 mL/min/1.73 m2), particularly in RAS blocker-naïve patients. In other words, the higher the increase in ΔAGT, the faster the reduction in eGFR, independent of baseline urinary levels of AGT. Noticing changes in urinary AGT excretion in these patients could be helpful for predicting the deterioration of kidney function. Moreover, it may be necessary to be followed-up of urinary AGT levels, even when initial eGFR is preserved and initial urinary levels of AGT are low.
 XML Download