Abstract
Background:
The direct/total (d/t) bilirubin ratio can be used to distinguish the causes of jaundice in many patients who have increased levels of direct and indirect bilirubin. However, the reference range of the d/t ratio has not been established, hindering its clinical usefulness. This study assessed the clinical usefulness of the d/t ratio.
Methods:
Paired total bilirubin and direct bilirubin tests (N=4,357) of cholestasis, hemolytic anemia, and neonatal jaundice were evaluated. Regression analyses were performed between total bilirubin and direct bilirubin, and between total bilirubin and the d/t ratio for each disease. Theoretical correlation models were established and used to compare the regression analyses data.
Results:
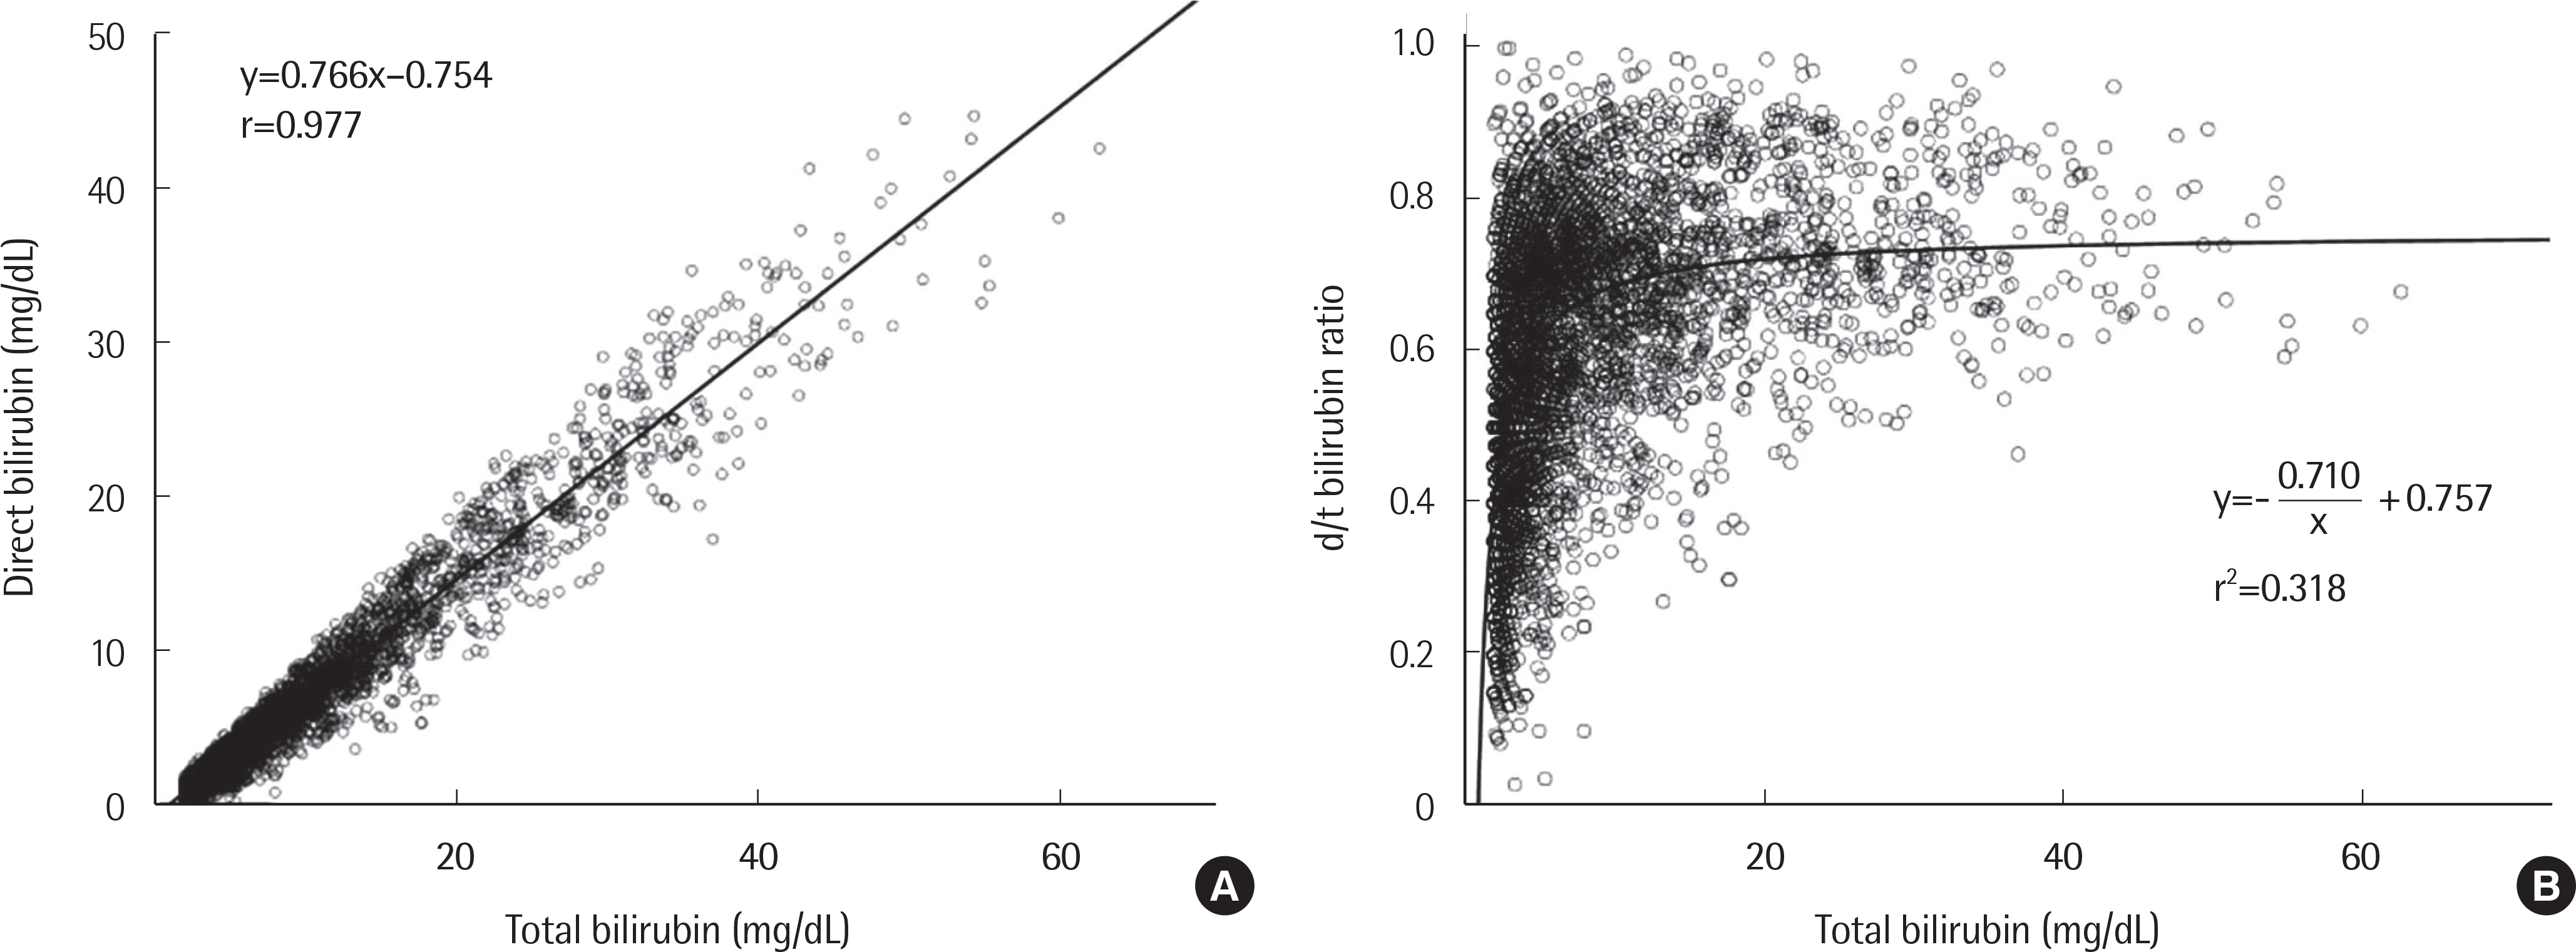
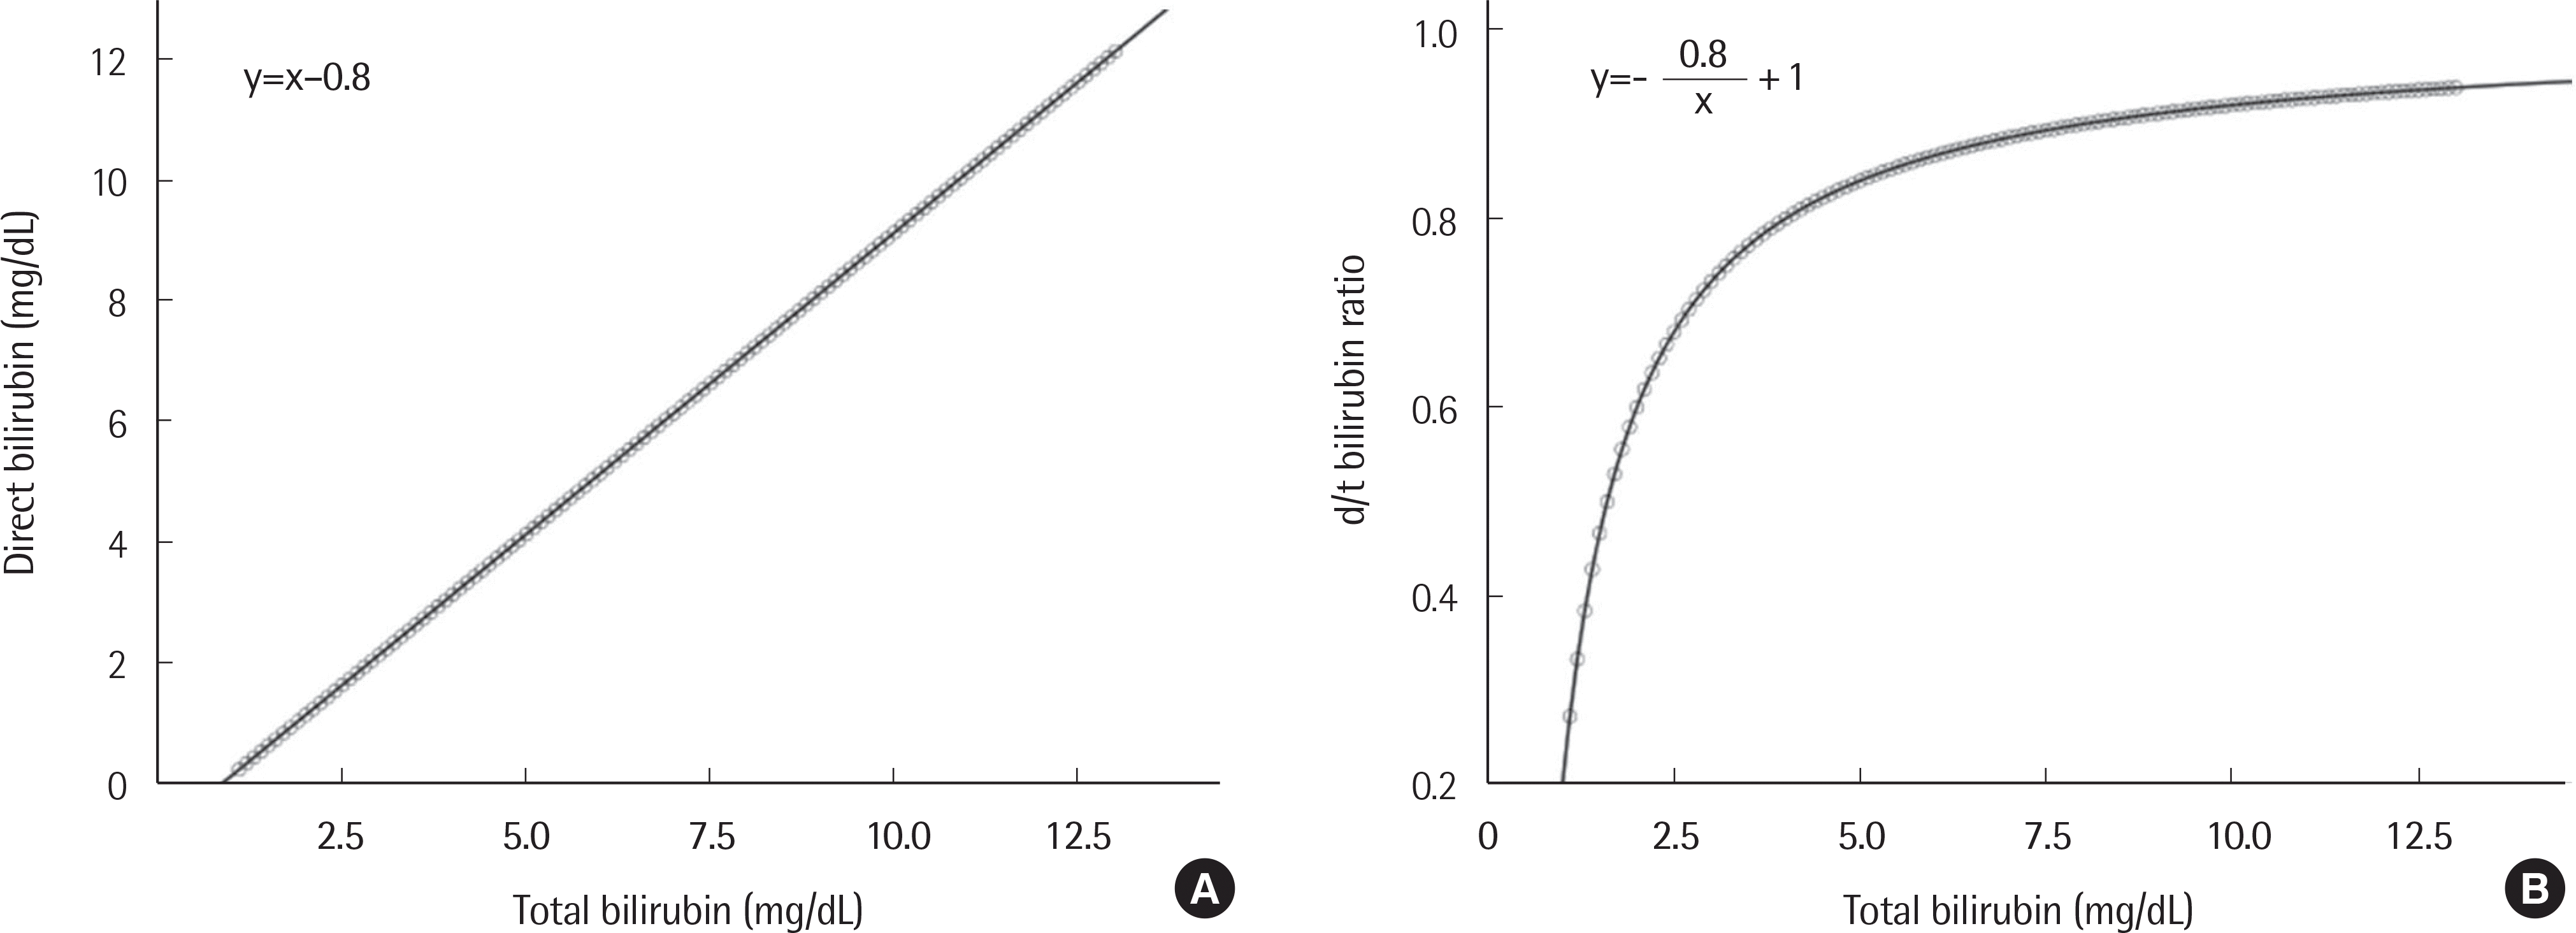
The theoretical model and regression equation between total bilirubin and direct bilirubin displayed linear correlations for all three cholestatic diseases. The model and regression equation between total bilirubin and the d/t ratio showed reciprocal curve correlations for the cholestatic diseases. When the total bilirubin concentration exceeded approximately 10 mg/dL, the rate of change of the d/t ratio decreased and converged to a constant value between 0.7 and 0.9.
Conclusions:
If the total bilirubin concentration exceeds 10 mg/dL, cholestatic diseases can be diagnosed if the d/t ratio is more than 0.7. However, if the total bilirubin concentration is lower than 10 mg/dL, cholestatic diseases should be considered even if the d/t ratio is lower than 0.7. Therefore, use of the d/t ratio with total bilirubin could prove to be valuable in clinical settings.
Go to : 
REFERENCES
1.McPherson RA., Pincus MR. Henry's Cclinical Ddiagnosis and Mmanagement by Llaboratory Mmethods. 23rd ed.Philadelphia: WB Saunders;2016. p. 289–92.
2.Fevery J., Claes J., Heirwegh K., De Groote J. Hyperbilirubinemia: sig-nifcance of the ratio between direct-reacting and total bilirubin. Clin Chim Acta. 1967. 17:73–9.
3.Kubasik NP., Mayer TK., Bhaskar AG., Sine HE., D'Souza JP. The measurement of fractionated bilirubin by Ektachem flm slides. Method validation and comparison of conjugated bilirubin measurements with direct bilirubin in obstructive and hepatocellular jaundice. Am J Clin Pathol. 1985. 84:518–23.
4.Arvan D., Shirey TL. Conjugated bilirubin: a better indicator of impaired hepatobiliary excretion than direct bilirubin. Ann Clin Lab Sci. 1985. 15:252–9.
5.Doumas BT., Wu TW. The measurement of bilirubin fractions in serum. Crit Rev Clin Lab Sci. 1991. 28:415–45.

6.Doumas BT., Yein F., Perry B., Jendrzejczak B., Kessner A. Determination of the sum of bilirubin sugar conjugates in plasma by bilirubin oxidase. Clin Chem. 1999. 45:1255–60.

7.Levitt DG., Levitt MD. Quantitative assessment of the multiple processes responsible for bilirubin homeostasis in health and disease. Clin Exp Gastroenterol. 2014. 7:307–28.

9.Naiki T., Nakayama N., Mochida S., Oketani M., Takikawa Y., Suzuki K, et al. Novel scoring system as a useful model to predict the outcome of patients with acute liver failure: Application to indication criteria for liver transplantation. Hepatol Res. 2012. 42:68–75.

10.Miyake Y., Iwasaki Y., Terada R., Takaguchi K., Sakaguchi K., Shiratori Y. Systemic infammatory response syndrome strongly affects the prognosis of patients with fulminant hepatitis B. J Gastroenterol. 2007. 42:485–92.
11.Krier M., Ahmed A. The asymptomatic outpatient with abnormal liver function tests. Clin Liver Dis. 2009. 13:167–77.

12.Damjanow I. Pathology Ssecrets. 3rd ed.Philadelphisa: Mosby Elsevier.;2009. p. 263–89.
13.Lo DH., Wu TW. Assessment of the fundamental accuracy of the Jendrassik-Grof total and direct bilirubin assays. Clin Chem. 1983. 29:31–6.
14.Wahlefeld AW., Herz G., Bernt E. Modifcation of the Malloy-Evelyn method for a simple, reliable determination of total bilirubin in serum. Scand J Clin Lab Invest. 1972. 2:A11–2.
15.Gollan J., Hammaker L., Licko V., Schmid R. Bilirubin kinetics in intact rats and isolated perfused liver: evidence for hepatic deconjugation of bilirubin glucuronides. J Clin Invest. 1981. 67:1003–15.

16.Berk PD., Howe RB., Bloomer JR., Berlin NI. Studies of bilirubin kinetics in normal adults. J Clin Invest. 1969. 48:2176–90.

17.Sullivan JI., Rockey DC. Diagnosis and evaluation of hyperbilirubi-nemia. Curr Opin Gastroenterol. 2017. 33:164–70.

18.Ullah S., Rahman K., Hedayati M. Hyperbilirubinemia in neonates: types, causes, clinical examinations, preventive measures and treatments: a narrative review article. Iran J Public Health. 2016. 45:558–68.
Go to : 
 | Fig. 1.Correlations between total bilirubin and direct bilirubin concentrations (A) and between total bilirubin concentration and d/t ratio (B) in patients with cholestasis. |
 | Fig. 2.Theoretical correlations between total bilirubin and direct bilirubin concentrations (A) and between total bilirubin concentration and d/t ratio (B) in cholestasis. |
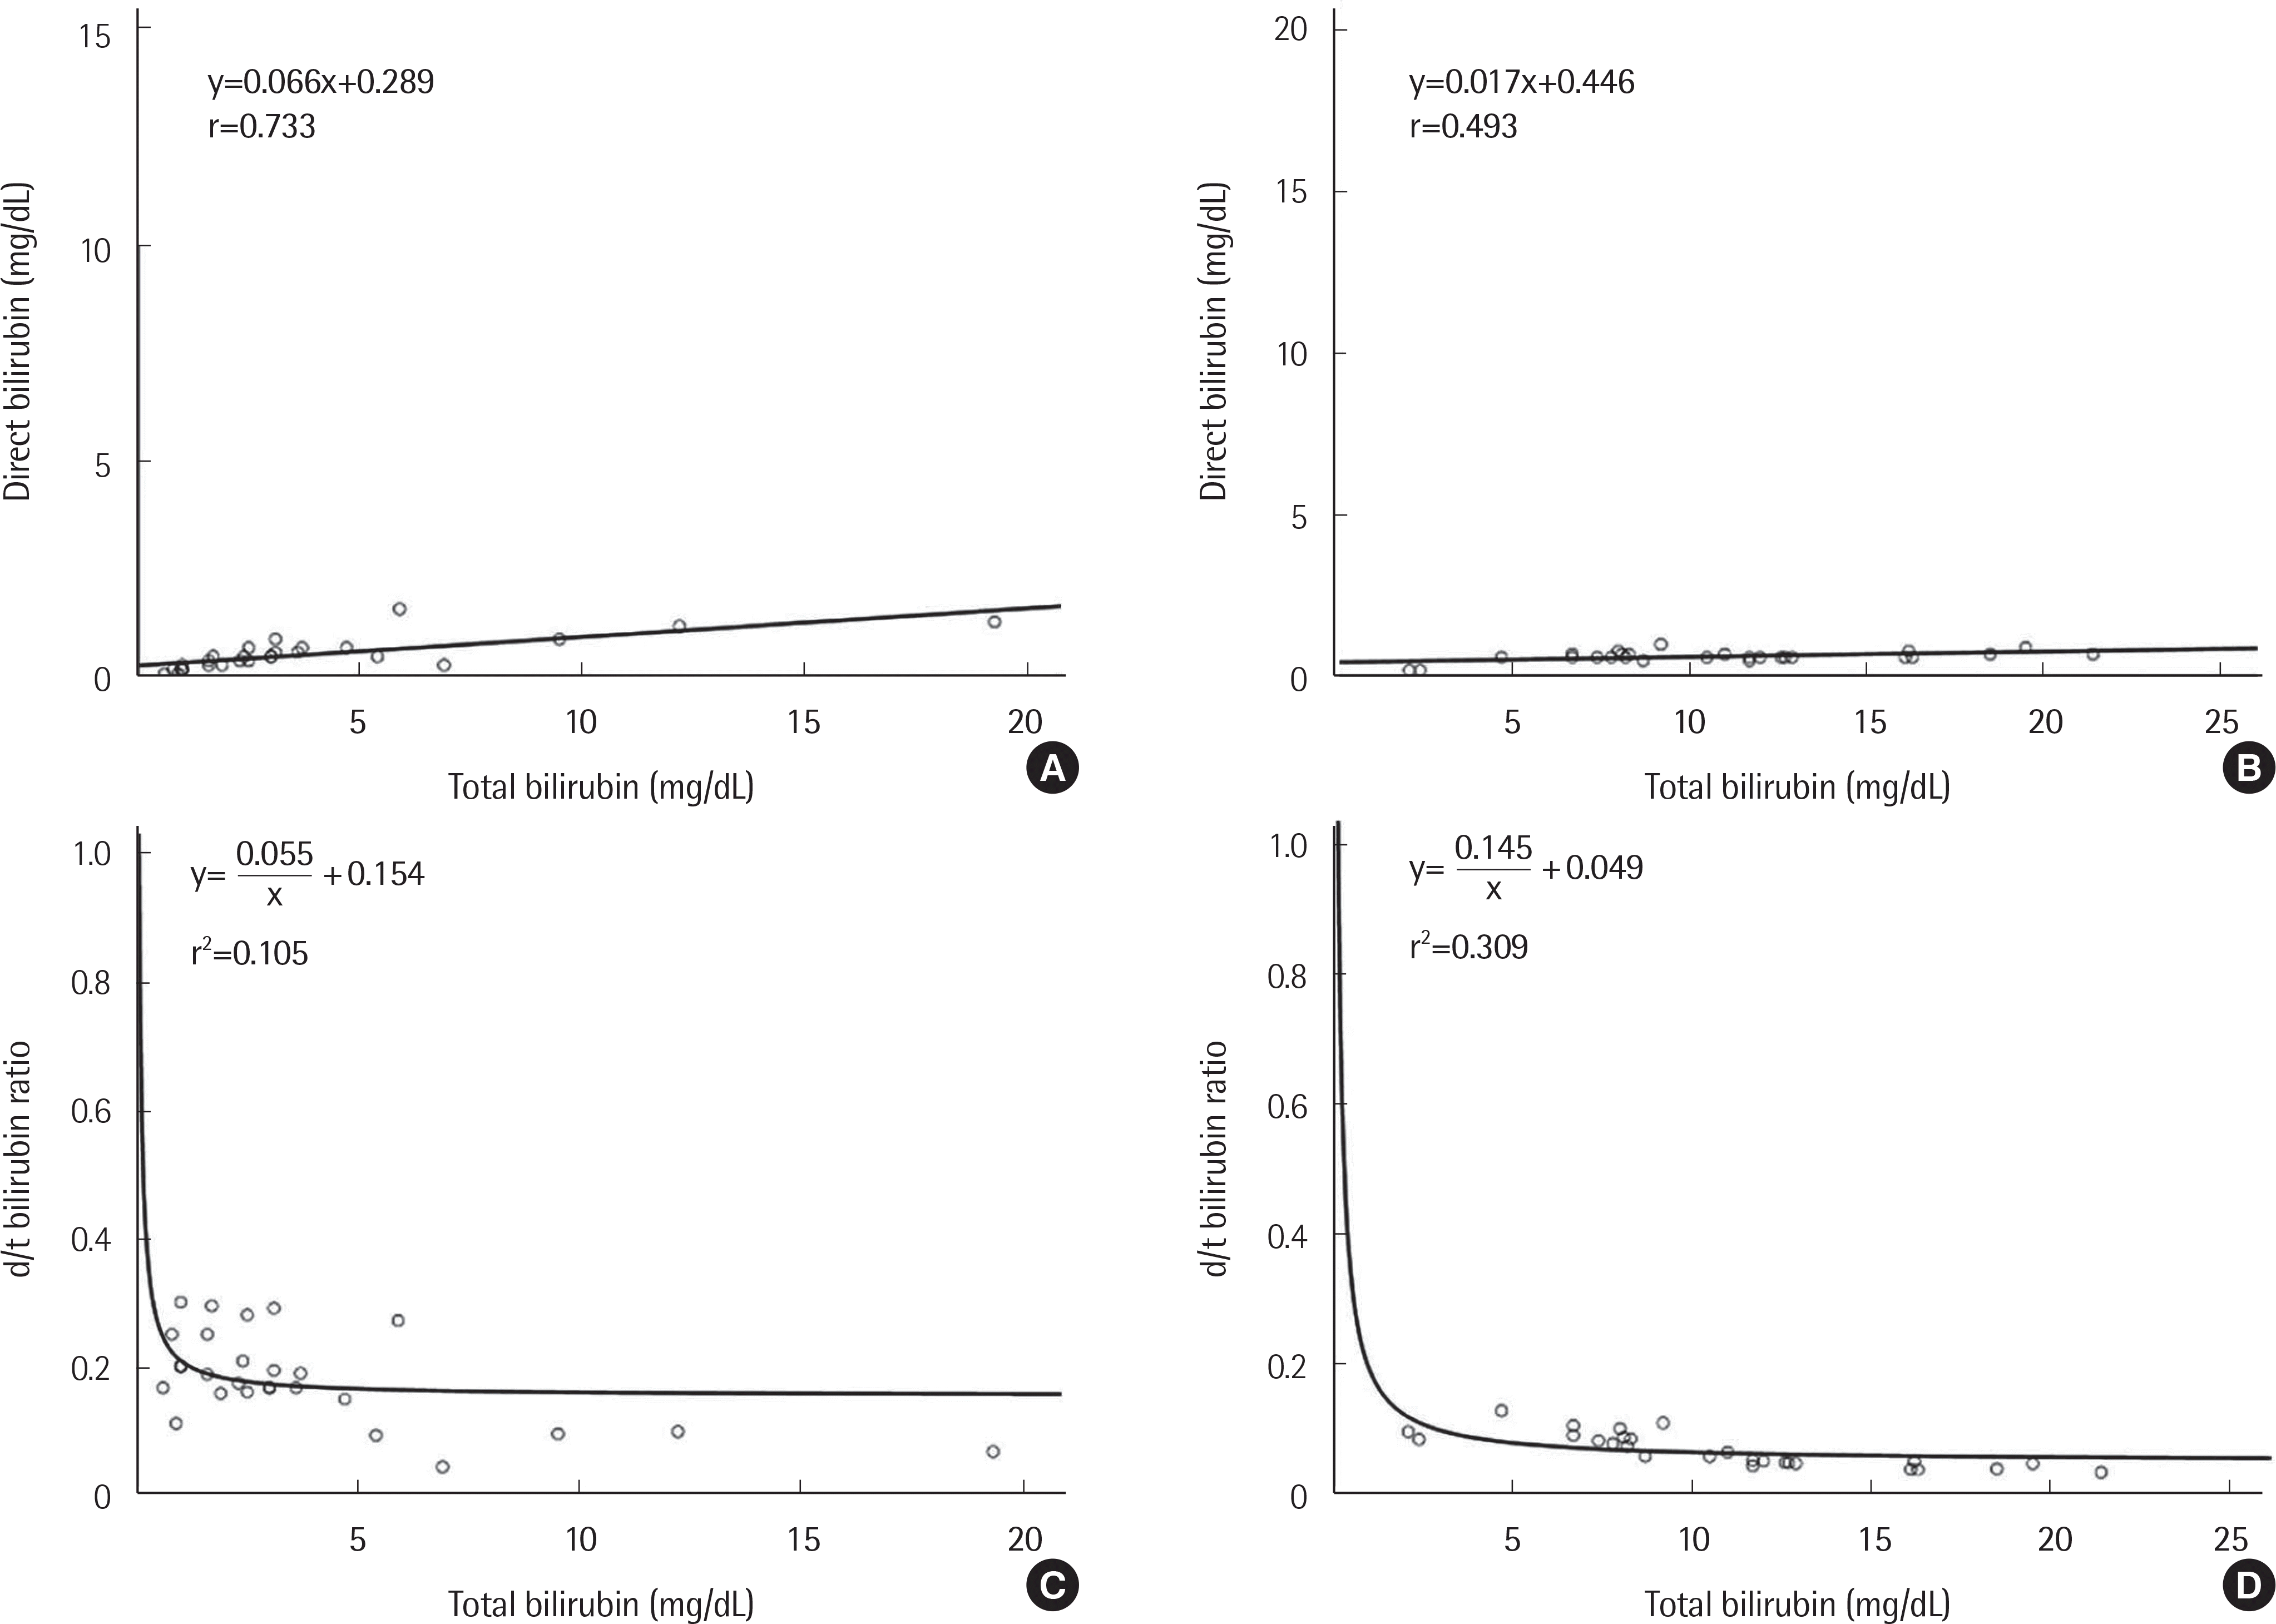
 | Fig. 3.Correlations between total bilirubin and direct bilirubin concentrations in patients with hemolytic anemia (A) and neonatal jaundice (B), and between total bilirubin concentration and d/t ratio in patients with hemolytic anemia (C) and neonatal jaundice (D). |
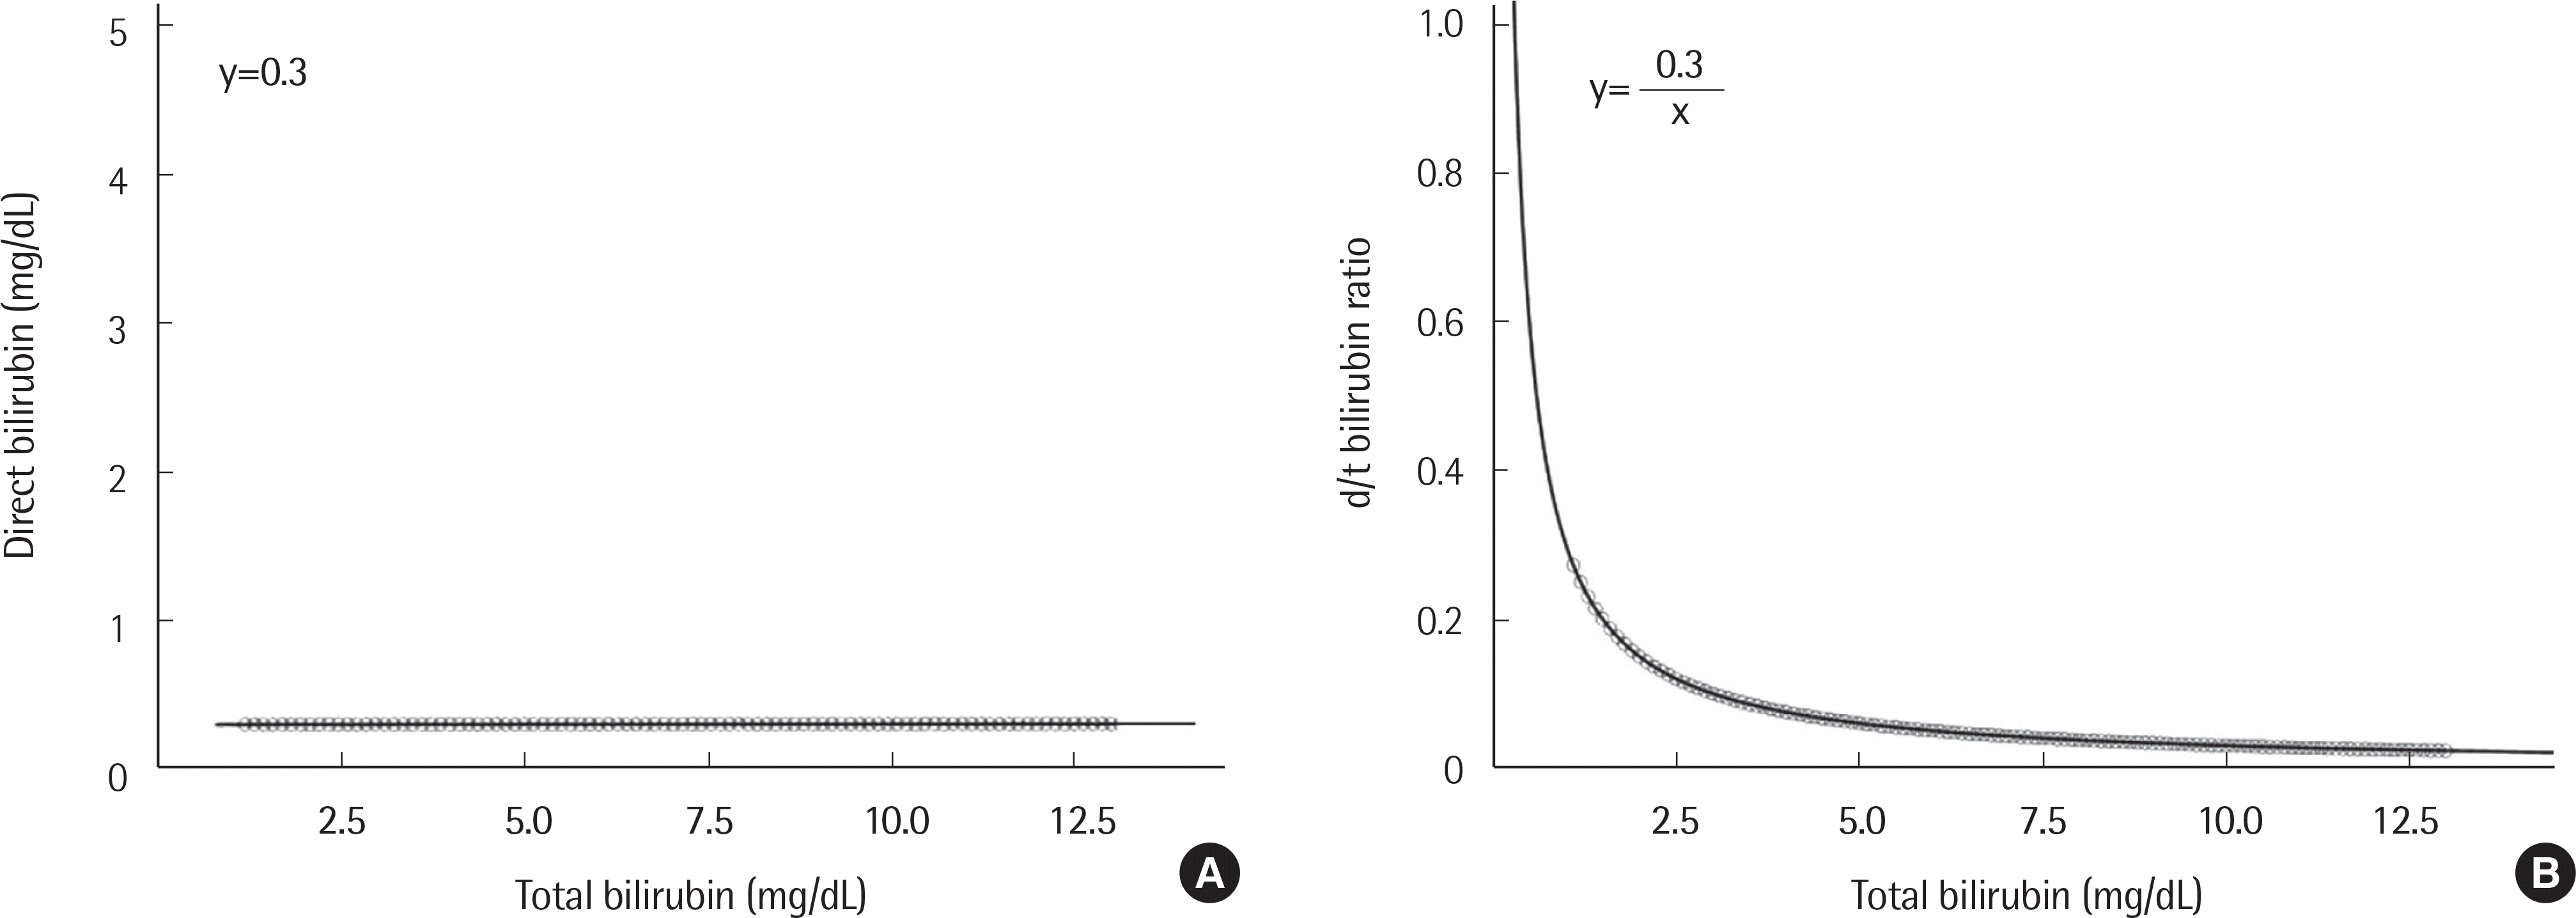
 | Fig. 4.Theoretical correlations between total bilirubin and direct bilirubin concentrations (A) and between total bilirubin concentration and d/t ratio (B) in hemolytic anemia and neonatal jaundice. |
Table 1.
Characteristics of patients with cholestasis, hemolytic anemia, and neonatal jaundice
| Disease | Number of cases | Age, year∗ | Total bilirubin | Direct bilirubin | Indirect bilirubin | d/t ratio† |
|---|---|---|---|---|---|---|
| (Male/Female) | (mg/dL)† | (mg/dL)† | (mg/dL)† | |||
| Cholestasis | 4,302 (2,876/1,426) | 53.72±13.66 | 5.3, 8.1 | 3.3, 6.2 | 1.9, 2.0 | 0.63, 0.25 |
| Intrahepatic cholestasis | 3,553 (2,432/1,121) | 52.25±12.75 | 5.2, 7.8 | 3.1, 5.8 | 2.0, 2.0 | 0.60, 0.26 |
| Hepatitis | 1,128 (732/396) | 47.36±15.08 | 5.8, 8.5 | 3.8, 7.1 | 1.8, 2.1 | 0.68, 0.24 |
| Acute hepatitis | 333 (176/157) | 39.42±14.50 | 5.8, 7.0 | 4.2, 6.2 | 1.6, 1.3 | 0.73, 0.18 |
| Chronic hepatitis | 795 (556/239) | 50.68±14.03 | 5.8, 8.9 | 3.7, 7.3 | 2.0, 2.5 | 0.64, 0.27 |
| Cirrhosis | 1,857 (1,403/454) | 53.01±11.09 | 4.7, 6.8 | 2.6, 4.7 | 1.9, 1.9 | 0.57, 0.26 |
| Alcoholic cirrhosis | 1,015 (914/101) | 50.62±10.30 | 4.5, 6.8 | 2.5, 4.7 | 1.9, 2.0 | 0.56, 0.24 |
| Non-alcoholic cirrhosis | 842 (489/353) | 55.90±11.32 | 5.0, 6.7 | 2.7, 4.7 | 2.0, 1.7 | 0.57, 0.27 |
| Hepatocellular carcinoma | 568 (297/271) | 59.49±7.89 | 6.2, 9.8 | 3.5, 7.0 | 2.3, 2.7 | 0.60, 0.24 |
| Extrahepatic cholestasis | 749 (444/305) | 60.69±15.56 | 5.5, 9.6 | 4.0, 7.5 | 1.7, 1.8 | 0.71, 0.19 |
| Hemolytic anemia | 28 (8/20) | 52.71±25.77 | 2.5, 3.3 | 0.5, 0.4 | 2.0, 2.9 | 0.18, 0.09 |
| Neonatal jaundice | 27 (12/15) | 0±0 | 10.5, 5.1 | 0.6, 0.1 | 9.9, 5.1 | 0.06, 0.04 |
Table 2.
Regression analysis of correlation between total bilirubin and direct bilirubin concentrations Table 3. Regres
| Disease | y=ax-b∗ | ||
|---|---|---|---|
| a (95% CI) | b (95% CI) | r | |
| Cholestasis | 0.766 (0.761–0.771) | 0.754 (0.693–0.814) | 0.977 |
| Intrahepatic cholestasis | 0.757 (0.751–0.762) | 0.784 (0.716–0.851) | 0.977 |
| Hepatitis | 0.735 (0.725–0.744) | 0.373 (0.250–0.496) | 0.985 |
| Acute hepatitis | 0.851 (0.836–0.866) | 0.666 (0.508–0.824) | 0.987 |
| Chronic hepatitis | 0.716 (0.705–0.727) | 0.470 (0.326–0.614) | 0.978 |
| Cirrhosis | 0.764 (0.756–0.772) | 0.938 (0.847–1.030) | 0.974 |
| Alcoholic cirrhosis | 0.767 (0.757–0.778) | 0.986 (0.863–1.109) | 0.976 |
| Non-alcoholic cirrhosis | 0.760 (0.747–0.772) | 0.878 (0.741–1.016) | 0.972 |
| Hepatocellular carcinoma | 0.771 (0.760–0.783) | 1.029 (0.866–1.191) | 0.975 |
| Extrahepatic cholestasis | 0.814 (0.804–0.823) | 0.667 (0.548–0.785) | 0.986 |
| Hemolytic anemia | 0.066 (0.041–0.091) | -0.289 (-0.425–-0.153) | 0.733 |
| Neonatal jaundice | 0.017 (0.005–0.029) | -0.446 (-0.589–-0.303) | 0.493 |
Table 3.
Regression analysis of correlation between total bilirubin concentration and d/t ratio analysis of correlation between total bilirubin concentrati
| Disease |
y=-b/x+a∗ |
||
|---|---|---|---|
| a | b | r2 | |
| Cholestasis | 0.757 | 0.710 | 0.318 |
| Intrahepatic cholestasis | 0.741 | 0.695 | 0.315 |
| Hepatitis | 0.783 | 0.722 | 0.311 |
| Acute hepatitis | 0.838 | 0.600 | 0.302 |
| Chronic hepatitis | 0.755 | 0.748 | 0.342 |
| Cirrhosis | 0.716 | 0.664 | 0.300 |
| Alcoholic cirrhosis | 0.704 | 0.610 | 0.283 |
| Non-alcoholic cirrhosis | 0.731 | 0.737 | 0.324 |
| Hepatocellular cirrhosis | 0.725 | 0.680 | 0.368 |
| Extrahepatic cholestasis | 0.826 | 0.744 | 0.359 |
| Hemolytic anemia | 0.154 | -0.055 | 0.105 |
| Neonatal jaundice | 0.049 | -0.145 | 0.309 |


 PDF
PDF ePub
ePub Citation
 Print
Print


 XML Download