

 PDF
PDF ePub
ePub Citation
 Print
Print


INTRODUCTION
Decreased fluid intake, increased perspiration, and increased urinary concentration could predispose an individual to increased crystallization and stone formation. Additionally, seasonal variation in urinary stone presentation is well described in the literature (12345678).
However, previous studies were limited by having assessed temperatures only in summer or in extreme conditions, and missing significant delayed associations between high daily meteorological values and urinary stone presentation. Recently, the conception of lag periods between temperature exposure and occurrence has been introduced along with the notion that the connection between temperature and incidence should not be measured for just one day but should be cumulative measurements of temperature exposure during the period leading up to an outbreak (67). Multivariate meta-analysis within distributed lag non-linear models (DLNMs) is useful for estimating and pooling nonlinear and delayed associations using time-series data drawn from multiple locations (9).
In the present study, we explored the overall cumulative exposure-response and the lag response relationships and the heterogeneity in the relationships between daily meteorological factors and urolithiasis incidence in 6 major Korean cities.
MATERIALS AND METHODS
Geography, climate, and administrative divisions of Korea
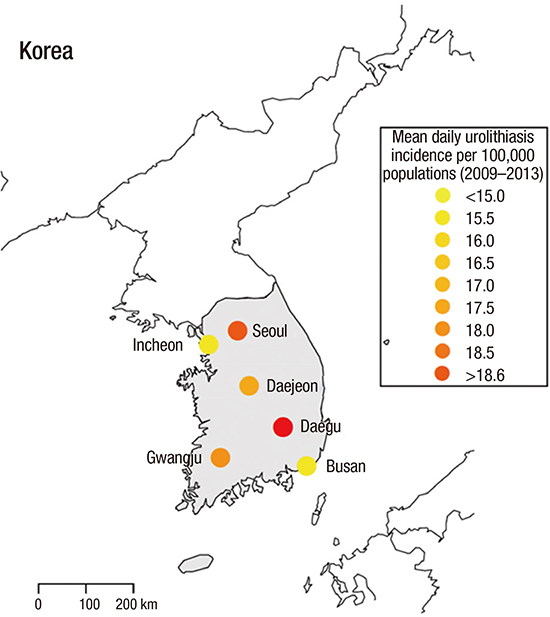
Korea occupies the southern portion of the Korean Peninsula. The country lies between latitudes 33° and 39°N and longitudes 124° and 130°E. Its total area is 100,032 square kilometers (38,622.57 sq mi). Korea tends to have a heat over 30°C and heavy precipitation in summer during a short rainy season called ‘jangma,’ which runs from the end of June through the end of July. Winters can be extremely cold, with the minimum temperature dropping below −20°C in the country's inland region. The major administrative divisions in Korea are 9 provinces and 7 metropolitan cities (Seoul, Incheon, Daejeon, Gwangju, Daegu, Busan, and Ulsan). Of the 7 metropolitan cities, we selected 6 (we excluded Ulsan) to study (Fig. 1A).
Urolithiasis database
This study was conducted among the populations of 6 metropolitan cities in Korea using 5 years of data (from 2009 to 2013). In Korea, the National Health Insurance Service covers the residents' medical costs, and as such, the Health Insurance Review and Assessment Service can collect citizens' data. For study purposes, the service provides data that does not contain any personalized information. Patients who presented at the hospital with urolithiasis were extracted from the database using the Korean Classification of Disease-6 (KCD) codes, which is based on the International Classification of Disease (ICD) 10th version, N20.0 (calculus of kidney), N20.1 (calculus of ureter), N20.2 (calculus of kidney with calculus of ureter), or N20.9 (urinary calculus, unspecified). Repeated visits by the same coded patient within 30 days were regarded as the same stone. Population data were obtained from the Korean Statistical Information Service (http://kosis.kr/).
Meteorological data acquisition
Meteorological data—daily temperature, relative humidity, wind, sea level pressure, and hours of sunshine—were obtained from the website of the Korean Meteorological Administration (www.kma.go.kr). We searched for the monthly meteorological data from the applicable year from all the observatory stations in each of the 6 cities.
Statistical methods and software
We performed inferential statistical analysis in 3 progressive model stages, with the response variable being the daily urolithiasis incidence in each city. A number of different covariates were included in the model, including all meteorological factors. We also included days of week (DOW), (DOW1-Monday, DOW7-Sunday), Korean holidays, years, and months to control for seasonal variations and trends. We compared the differences in the covariates between cities using analysis of variance (ANOVA) and the χ2 test and defined statistical significance as P < 0.05. The analyses were performed using R (version 3.0.1; R Project for Statistical Computing, Vienna, Austria; http://www.r-project.org/) packages ‘dlnm’ and ‘mvmeta.’
Poisson generalized regression model (PGAM)
The first stage was divided into 2 consequential procedures based on our constructing a simple PGAM and applying it to the time series. The aim of this process is to estimate the preliminary associations between the meteorological covariates and the daily urolithiasis incidence. We conducted this procedure in a backward mode with all the climate covariates included. We included a natural cubic spline to control for seasonal variations (time 7×9) using DOW and Korean holidays as factors. Finally, the Akaike information criterion (AIC) was used to find the best fit model.
First-stage time-series model
We performed a time-series study using DLNMs to estimate the relationships between daily meteorological factors and urolithiasis incidence in each of the 6 cities. We estimated the relative risk (RR) of urolithiasis incidence associated with daily meteorological factors for each day during a someday period after the exposure (lag-response). And then, we summed the estimated risks for each lag day to estimate the cumulative RR for urolithiasis presentation associated with mean daily meteorological factors during the someday period after the exposure (cumulative exposure-response relationship).
Second-stage meta-analysis
We pooled the estimated location-specific associations, which were assumed to be constant across the study or predicted for specific years, using multivariate meta-regression models of first-stage coefficients. The models included indications for the cities allowing for country-specific exposure-response and lag-response relationships. And then, we tested and quantified residual heterogeneity using the multivariate extension of the Cochran Q test, I2 statistics, the AIC, and the Bayesian information criterion.
Ethics statement
This study was approved by the Institutional Review Board of Myongji Hospital (IRB No. MJH-15-051). Because it was a retrospective study of anonymous patients, we could not get informed patient consent. However, the study was carried out in agreement with the Declaration of Helsinki.
RESULTS
Urolithiasis presentation of cities and meteorological data
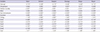
Over the 5-year study period, 687,833 patients sought medical attention for urolithiasis in 6 cities (Table 1). Mean daily urolithiasis incidence (MDUI) per 100,000 population, gender, age distribution, mean daily temperature (MDT), mean daily relative humidity (MDRH), mean daily wind, mean daily sea level pressure (MDSLP), and mean daily hours of sunshine, showed differences between cities (P < 0.01, Table 1). MDUI per 100,000 populations was higher in Seoul, Daejeon, Daegu, and Gwangju than in Incheon and Busan (Table 1, Fig. 1A).
Table 1
Statistical summary of meteorological variables and urolithiasis presentation
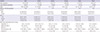
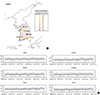
Fig. 1B shows scatter plots of MDUI over the study period to evaluate the patterns. MDUI appeared to be dominated by annual seasonal patterns, with the highest incidence in summer (August) and the lowest in winter (January) in all cities. MDUI also appeared to increase annually between 2009 and 2013 (182.7 vs. 188.8 in Seoul; 35.4 vs. 40.6 in Incheon; 26.9 vs. 27.7 in Daejeon; 25.2 vs. 27.9 in Gwangju; 47.5 vs. 54.9 in Daegu; and 50.9 vs. 58.8 in Busan).
PGAM
There were positive associations between MDT and MDUI in all cities, negative associations between MDSLP and MDUI in all cities except Daegu, and negative associations between MDRH and MDUI in all cites except Daejeon and Gwangju (Table 2). Moreover, MDUI was the highest on Mondays compared with other days and lower on holidays in all cities (Table 2). Therefore, we decided to include MDT, MDSLP, and MDRH in the DLNMs.
Table 2
Poisson model with meteorological factors adjusted for seasonal and calendar before backward procedure
Overall cumulative exposure-response relationships
We used a 20-day lag period based on recent evidence that suggested a short lag time between temperature and urolithiasis presentation (6). We estimated RRs over the distribution of MDT, MDSLP, and MDRH for each city relative to MDT of 13°C, MDSLP of 1,016 mmHg, and MDRH of 60% in each city.
We built Poisson regression models that allowed for over-dispersion for each city. Month and year are indicator variables to control for season, temperature trends, and differences. We constructed 3-dimensional graphs to demonstrate simultaneously the relationships along MDT and lag (Fig. 2A) and MDRH and lag (Fig. 2B). We represented the result of a single-location analysis using data from Daegu and Seoul. First, we could define a predictor-specific summary association at a given predictor value x0 along the lag space. Second, we could define a lag-specific summary association at a given lag value l0 along the predictor space. This is shown in the bottom-left panel for lag l0 = 3 and it coincides with the red line in the 3-D graph perpendicular to the reference. Third, the sum of the lag-specific contributions provides the overall cumulative association, shown in the bottom-right panel. This summarizes an estimate of the net effect associated with a given exposure cumulated over the lag period. Consistent trends of increasing RR of MDUI were observed within 5 days of high MDT across Daegu. The overall cumulative association showed increasing RR with high MDT (Fig. 2A). In contrast, MDRH over 90% was related to lower DMUI within 5 days, and the overall cumulative association showed decreasing RR with high MDRH in Seoul (Fig. 2B). We did not find any association between MDUI and MDSLP.
Fig. 2
The effects of temperature and humidity for daily urolithiasis incidence. (A) Temperature-urolithiasis incidence association in Daegu 2009–2013. Top-left: 3-D graph with black reference line at 13°C. Top-right: predictor-specific at 30°C (red line parallel to the reference in the 3-D graph). Bottom-left: lag-specific summary at lag 3 (red line perpendicular to the reference in the 3-D graph). Bottom-right: overall cumulative summary. The 95% CIs are reported as gray areas. (B) Relative humidity-urolithiasis incidence association in Seoul 2009–2013. Top-left: 3-D graph with black reference line at 60%. Top-right: predictor-specific at 90% (red line parallel to the reference in the 3-D graph). Bottom-left: lag-specific summary at lag 3 (red line perpendicular to the reference in the 3-D graph). Bottom-right: overall cumulative summary. The 95% CIs are reported as gray areas.
CI = confidential interval.
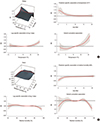
Fig. 3A shows the overall cumulative RRs of MDUI according to MDT and the frequency of MDT in each of the 6 cities; RRs at 20°C compared with 13°C were 1.19 in Seoul (95% confidential interval [CI], 1.18–1.31), 1.22 in Incheon (95% CI, 1.13–1.41), 1.37 in Daejeon (95% CI, 1.35–1.83), 1.23 in Gwangju (95% CI, 1.12–1.47), 1.23 in Daegu (95% CI, 1.18–1.40), and 1.22 in Busan (95% CI, 1.14–1.44); the RRs also showed positive associations with MDT over 20°C in all 6 cities.
Fig. 3
The cumulative effects of temperature and humidity for daily urolithiasis incidence. (A) Overall RR of urolithiasis cumulative over a 20-day lag period with MDT (°C) relative to 13°C in the 6 cities from 2009 to 2013. The estimated RRs of urolithiasis associated with MDT accumulated over a 20-day lag period using DLNMs are shown for each city. The solid red line is the point estimate at each temperature, and the surrounding gray area is the 95% CI. (B) Overall RR of urolithiasis cumulative over a 20-day lag period with mean relative humidity (%) relative to 60% in the 6 cities from 2009 to 2013. The estimated RRs of urolithiasis associated with mean relative humidity accumulated over a 20-day lag period using DLNMs are shown for each city. The solid red line is the point estimate at each temperature, and the surrounding gray area is the 95% CI.
RR = relative risk, MDT = mean daily temperature, DLNMs = distributed lag nonlinear models, CI = confidential interval.
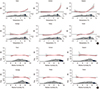
MDRH was a statistically significant predictor for decreasing RRs of MDUI when MDRH was at 84% in Seoul (RR, 0.93; 95% CI, 0.86–0.99), Daegu (RR, 0.81; 95% CI, 0.71–0.93), Busan (RR, 0.98; 95% CI, 0.84–0.98), and RRs decreased to 0.64 in Seoul (95% CI, 0.52–0.79), 0.85 in Incheon (95% CI, 0.74–0.98), 0.89 in Daejeon (95% CI, 0.74–1.86), 0.61 in Gwangju (95% CI, 0.46–0.88), 0.51 in Daegu (95% CI, 0.33–0.79), and 0.82 in Busan (95% CI, 0.70–0.96) at 95% MDRH (Fig. 3B). The proportions over 84% MDRH were 7.1%, 23.0%, 13.6%, 12.4%, 4.9%, and 10.1% in Seoul, Incheon, Daejeon, Gwangju, Daegu, and Busan, respectively (Fig. 3B).
Multivariate meta-regression
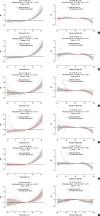
The overall MDT and MDRH-MDUI associations in the 6 Korean cities are illustrated in Fig. 4. They show the region-specific summary associations from the first stage, together with the pooled averages from the multivariate meta-analysis, as predicted by the main flexible model totals and subgroups by gender and age. To partially account for the residual between-location heterogeneity attributed to different temperature distributions, we also included location-specific average MDT and MDT range as additional meta-predictors. Consistent with previous findings, the pooled curve suggests increased RR with high temperatures and high humidity. The multivariate Cochran Q test for heterogeneity at MDT was 12.35 (P value = 0.136), and the related I2 statistic accounted for 35.2% of the variability. Additionally, the Cochran Q test for heterogeneity and I2 statistic at MDHR were 26.73 (P value = 0.148) and 24.7% of variability in the total group. The heterogeneity of MDTG and MDHR showed no significance in any subgroups.
Fig. 4
Multivariate meta-regression model to estimate the exposure-response relationships in RR between temperature and relative humidity and the daily urolithiasis incidence in 6 Korean cities, 2009–2013. Residual heterogeneity was tested and then quantified by the multivariate extension of the Cochran Q test and I2 statistics at total (A), male (B), female (C), less than 40 years old (D), 40–60 years old (E), and more than 60 years old (F). The continuous bold red line represents the population-average curve, whereas the long-dashed grey lines are the study-specific estimates. Reference at 13°C (right), 60% (left).
RR = relative risk, CI = confidential interval, AIC = Akaike information criterion, BIC = Bayesian information criterion.
DISCUSSION
Recent studies explored the association between climatic conditions and urolithiasis. Eisner et al. (10) suggested that increasing temperature may increase stone risk by increasing urine excretion of calcium and the super-saturation of calcium oxalate and calcium phosphate. In the other studies, humidity and urolithiasis only showed weak correlations by the hypothesis of dehydration and stone formation (68).
This is one of the largest ever conducted studies that correlated short-term variations in climate with daily urolithiasis incidence in 6 major cities in Korea. There is only one National Health Insurance in Korea, and nearly the entire national population (97% of populations) is included in the plan. That is, nearly everyone in metropolitan cities is registered with the scheme (5). Therefore, it was valuable to study the relationships between meteorological factors and urolithiasis incidence based on this study's Korean metropolitan city data.
There are 2 main findings in this epidemiologic investigation. First, the existence of an association was confirmed between daily temperature, daily relative humidity, and daily urolithiasis incidence in all 6 cities. The effects of temperature and humidity occurred within 5 days. Due to a high risk of prevalence and recurrence of urolithiasis, modifiable lithogenic risk factors can be targeted to offer an inexpensive and convenient means to decrease it. In a previous study, we investigated the overall cumulative exposure-response and the lag response relationships between daily temperature and urolithiasis presentation and then sub-analyzed the relationships according to age and sex in Seoul, Korea (11). Among the 14,518 patients who visited the emergency departments of the 4 hospitals in Seoul from 2005 to 2013, the RRs for urolithiasis at 29°C vs. 13°C were 2.54 in all patients (95% CI, 1.67–3.87), 2.59 in male (95% CI, 1.56–4.32), and 2.42 in female (95% CI, 1.15–5.07). We also observed consistent trends of increasing RR of urolithiasis presentation within 5 days of high temperatures across all groups (11). Although the previous study has limitations, including studying only 4 hospitals' emergency department patients, the results were similar to those from this study, such as the associations between daily mean temperature and urolithiasis presentation and the short lag.
Second, no heterogeneous influence of temperature or relative humidity was demonstrated between the cities, and as a result, the differences in daily urolithiasis incidence might have been partially attributable to the different frequencies and the ranges in temperature and humidity between the cities. In our study, MDUI per 100,000 populations was lower in Incheon and Busan than in other cities. Our explanation is that the proportion over 84% MDRH was the highest in Incheon and the most frequent MDT ranges were lowest in Busan. In sum, geographic location was not an influence on the associations within and between the 6 cities, and this could be related to Korea's smaller land mass compared with that of the United States (6).
Interestingly, urolithiasis incidence increased during 2009–2013 in our study. This increasing trend could be explained by the increase in hospital use in Korea; the mean number of hospital visits per person increased from 16.04 in 2006 to 18.59 in 2010 (5). Another explanation is that non-enhanced computed tomography (NECT) replaced intravenous urography (IVU) as the imaging tool for confirming the diagnosis of urolithiasis (12). NECT has a higher urolithiasis detection rate, including radiolucent and small stones, compared with IVU. NECT has been described as the best imaging tool for confirming the diagnosis of urolithiasis, and its use could have affected the annual increases in urolithiasis incidence in our study.
One of the limitations of this study was that it included only developed cities. In developed cities, large percentages of people work indoors, which is not representative the urolithiasis presentation in the Korean population. Additionally, temperature-dependent models presume an accurate understanding of current urolithiasis prevalence; however, such data are problematic for a variety of reasons. Urolithiasis occurs intermittently and is not always readily apparent. Many patients harbor undiagnosed asymptomatic urolithiasis, and others require repeated hospitalizations for recurrent urolithiasis events. Consequently, true urolithiasis prevalence is difficult to determine and is likely to be routinely underestimated and occasionally overestimated. We also did not conduct a sub-analysis of stone size on CT scan in this study.
Despite these limitations, the results of our study suggest that specific periods of temperature and humidity exposure might affect the risk of urolithiasis. The key application of our findings is to reduce the overall costs to the health sector. We suggest awareness campaigns about changing temperature and humidity during or before summer. Moreover, we can encourage the public to increase fluid intake and reduce their hours of outdoor activities.
The existence of an association was confirmed between daily temperature, daily relative humidity, and daily urolithiasis incidence. The differences in daily urolithiasis incidence might have been partially attributable to the different frequencies and the ranges of temperature and humidity between 6 Korean cities.
 XML Download