

 PDF
PDF ePub
ePub Citation
 Print
Print


INTRODUCTION
Iron deficiency (ID) is a common nutritional disorder among children (1). ID during infancy, even without anemia, may affect mental, motor, and behavioral development, which can cause long-term neurocognitive impairment (2). Healthy infants who are born at term usually have sufficient iron stores for their first 4–6 months of life, although their iron reserves from the mother are depleted during late infancy. In addition, rapid growth during late infancy leads to high iron requirements, which increases the risk of ID (3). Therefore, active surveillance for ID in this age group, including the identification of potential risk factors, may help provide an important basis for establishing health promotion interventions.
Several large-scale studies have evaluated natal and postnatal risk factors for ID and iron deficiency anemia (IDA) in infancy in both developed and developing countries, although few large scale Korean studies have investigated this topic (4567). During early infancy, iron status depends on the gestational and perinatal conditions of the mother and infant (89). In addition, studies have suggested that the risk of ID is associated with natal factors, such as sex or delivery type, although these results are inconsistent, especially during late infancy (6791011). Furthermore, dietary factors are especially important in controlling the risk of ID, as these factors can be altered through active intervention (1213).
The identification of feeding factors that are related to ID is an important basis for establishing official recommendations regarding complimentary feeding (CF), iron supplementation, and screening for iron status. In 2001, the World Health Organization (WHO) changed their recommendation for exclusive breastfeeding from 4–6 months to 6 months, in order to reduce the incidence of infectious diseases in developing countries (1415). However, it raised a concern regarding the iron status of some infants start receiving complementary food at the age of 6 months (12161718). In addition, the American Academy of Pediatrics recently recommends iron supplementation from 4 months of age for infants with exclusive breastfeeding, and iron status screening at approximately 12 months (19). The introduction of iron-fortified solid foods, rather than medicinal iron supplementation, also has been proposed to ensure that infants achieve optimal iron status by 6 months of age (19). The European Society for Paediatric Gastroenterology Hepatology and Nutrition recommends the introduction of weaning formula at 17–26 weeks, although it does not recommend iron supplementation before 6 months (2021).
Since the introduction of the Korean National Health Screening program for infants and children, exclusive breastfeeding has been recommended in Korea for the first 6 months based on the WHO recommendations (22). However, clinicians have expressed concerns regarding whether the recommendation can reliably ensure that Korean infants fulfill their iron requirements (2324). Unlike in Western countries, iron-fortified cereals are not popular in Korea, which may increase the risk of insufficient iron intake among Korean infants during early weaning, compared to infants in Western countries. Furthermore, a study found that a considerable number of Korean parents were reluctant to provide their breastfeeding infants with medicinal iron if there was no definitive diagnosis of anemia, and that there was poor compliance with instructions to provide medicinal iron (25).
Therefore, large-scale studies are needed to provide the basis for preparing recommendations regarding weaning practice, iron supplementation, and iron screening in Korea. The present study aimed to investigate the natal and postnatal risk factors for ID and IDA, especially feeding and CF-related factors, among healthy Korean infants during their late infancy. We also aimed to establish a diagnostic prediction model for ID and IDA based on easily assessable clinical risk factors.
MATERIALS AND METHODS
Study population
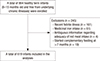
The present study examined healthy Korean infants (8–15 months old) and their caregivers who visited our clinic for health examinations and ID screening between 2012 and 2015. All study participants resided in Seoul or its neighboring cities. Infants with the following conditions were excluded after our evaluation: underlying chronic diseases affecting nutritional status or growth, acute febrile illnesses or acute gastrointestinal diseases during the previous 2 weeks, history of medication (including multivitamins, minerals, medicinal iron, or herbal drugs) since birth, incomplete or ambiguous feeding-related information, and introduction of CF at < 4 months or > 7 months of age. As a result, among 864 potentially eligible infants without underlying chronic disorders, 245 infants were excluded for the final analysis (Fig. 1).
Clinical, anthropometric, and dietary assessments
The infants' parents completed modified and validated questionnaires regarding their demographic and dietary information. The demographic information included birth-related information, such as gestational age, birth weight, and type of delivery. Information regarding the highest level of maternal education was only obtained from the mothers during 2015. The dietary information included type of feeding (breastfeeding, formula feeding, and mixed feeding [MF]), duration of the feeding, and dominancy of the feeding during early and late infancy. Information regarding CF was also obtained, such as the starting age for CF; use of rice-based food, red meat, and cow's milk; and the parent/guardian's opinion regarding the adequacy (amount) of complementary food intake during late infancy. The caregiver's knowledge regarding CF was evaluated using 6 yes/no questions (26): 1) Should beef be given from 6 months of age?; 2) Should cow's milk be given after 12 months of age?; 3) Should nuts not be given during the early weaning period?; 4) Should honey not be given before 12 months of age?; 5) Are mixtures of ground raw grains, soybeans, and vegetables adequate as complementary food?; and 6) Sugar and salt do not need to be added to complementary food?
All children underwent routine physical examinations by an experienced pediatrician. Experienced nurses weighed the infants using a calibrated load cell-operated digital scale (Jenix DS-B02; Dong-Sahn Jenix, Seoul, Korea).
Hematological and biochemical assessments
All infants underwent testing to determine their hemoglobin levels, mean corpuscular volume (MCV), serum iron levels, total iron-binding capacity, and serum ferritin levels. Venous blood samples (approximately 1 mL) were obtained from each participant using venipuncture of the cubital fossa or dorsum of the hand. The samples were collected in a vacutainer tube containing ethylenediaminetetraacetic acid and were subjected to hemoglobin and MCV testing using an automatic cell counter (XE-2100; Sysmex, Kobe, Japan). A second 2-mL sample was collected in a serum separation tube, and the sera were tested for iron levels and total iron-binding capacity using a Roche/Hitachi MODULAR analyzer (Roche Diagnostics GmbH, Mannheim, Germany) and for ferritin levels using the ADVIA Centaur XP Immunoassay System (Siemens Healthcare Diagnostics, Los Angeles, CA, USA).
Definitions
Cases of ID were defined as infants with 1) serum ferritin levels of < 12 ng/mL or 2) MCV of < 70 fL and transferrin saturation of < 10% (12728). The non-ID group was defined as infants who did not fulfill the ID criteria. Anemia was defined as hemoglobin levels of < 11 g/dL, and IDA was diagnosed based on the coexistence of ID and anemia (1).
Birth weights and chronological weights were measured in kilograms and converted to Z-scores according to age and sex using WHO Anthro software (version 3.2.2., January 2011; http://www.who.int/childgrowth/software/en/). Infants who were small for gestational age (SGA) were defined as having a birth weight of below the tenth percentile for their gestational age and sex. Weight gain after birth was expressed as the fold weight gain, by dividing the current weight (kg) by the birth weight (kg). It was also expressed as the difference in Z-scores for weight for age (WAZ) and Z-scores for birth weight (BWZ) at the time of the study (29).
We defined infants who were exclusively/mostly breastfed as either 1) being exclusively breastfed for the first 4–6 months and being mainly breastfeeding thereafter or 2) infants who were mainly breastfed with limited formula supplementation (< 2 servings/day), until the time of study or at least 10 months of age with/without CF. Infants were defined as mostly formula-fed if they 1) exclusively received formula without breastfeeding and with/without CF or 2) were exclusively or dominantly formula fed with/without limited breast milk (< 2 times/day) or CF, until the time of study or at least 10 months of age. Based on these definitions, feeding types were categorized as exclusively/mostly breastfeeding until late infancy (BFL), mostly formula feeding until late infancy (FFL), and MF, which did not fulfill the criteria for BFL or FFL. The majority of MF cases were exclusively/mostly breastfed for the first 4–6 months of age.
The times to CF introduction were defined as early (at 4–5 months of age) or late (at 6–7 months of age). Similarly, the times to red meat introduction were defined as early (at 6–7 months of age) or late (> 7 months of age).
Statistical analysis
All analyses were performed using PASW software (version 20.0; SPSS Inc., Chicago, IL, USA). Normality was tested using the Kolmogorov-Smirnov test. Normally distributed variables were expressed as mean ± standard deviation and were tested using Student's t-test or analysis of variance. Non-normally distributed variables were expressed as median and interquartile range (IQR), and were tested using the Mann-Whitney test or Kruskal-Wallis test. Categorical data were compared using Pearson's χ2 test. Logistic regression models were used to build a prediction model for ID and IDA, based on the infants' demographic, anthropometric (both weight and Z-scores), and feeding-related factors, using a backward elimination method. The model's predictive ability was evaluated using the area under the receiver operating characteristic curve (AUROC). The level of statistical significance was set at a P value of < 0.05.
RESULTS
Infant characteristics
The median age of the 619 included infants was 11.2 months (IQR, 10.3–12.0 months), and 299 infants (48.3%) were male. A total of 288 infants (46.5%) were mostly breastfed until late infancy for a median time of 10.2 months (IQR, 7.0–11.4 months). Approximately one-third of the children (n = 220, 35.5%) started CF before 6 months of age.
A total of 419 infants (67.7%) lived in Seoul, and the other infants lived in its neighboring cities in Gyeonggi province. Only 4 infants (0.6%) were receiving fully or partially paid medical care, and all other infants were covered by national medical insurance. Among the 127 mothers who were evaluated during 2015, the highest levels of maternal education were postgraduate education (11.0%), college or university graduate (79.5%), and high school graduate (9.4%).
Overall prevalence of ID and IDA
The laboratory parameters of the included infants are summarized in Table 1. ID and IDA were present in 174 infants (28.1%) and 87 infants (14.1%), respectively. These prevalence rates were marginally higher than the values when we considered all 864 eligible infants (n = 223, 26.1% and n = 110, 12.9%; respectively). Hemoglobin levels of < 11 g/dL and < 10.5 g/dL were observed in 105 infants (17.0%) and 55 infants (8.9%), respectively. MCV values of < 70 fL were observed in 70 infants (11.3%), and 50 infants (8.1%) had microcytic anemia (hemoglobin of < 11 g/dL and MCV of < 70 fL).
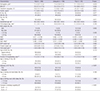
Table 1
Laboratory and clinical parameters of infants with ID and without ID (n = 619)
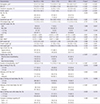
P values were calculated using the χ2 test unless stated otherwise.
ID = iron deficiency, IDA = iron deficiency anemia, MCV = mean corpuscular volume, SGA = small for gestational age, BWZ = Z-scores for birth weight, WAZ = Z-scores for weight for age, MF = mixed feeding, CF = complementary feeding, IQR = interquartile range.
*Between the infants with and without ID; †Between infants with and without IDA; ‡The values are presented as median (IQR). The comparisons according to iron status were performed using the Mann-Whitney's test; §The values are presented as mean ± standard deviation. The comparisons according to iron status were performed using the independent samples t-test;∥Fold weight gain was calculated as current weight (kg) divided by birth weight (kg); ¶A total of 481 mothers reported their duration of breastfeeding; **Adequacy of CF means parental subjective assessment on adequacy of CF; ††Adequacy of red meat intake means parental subjective assessment on adequacy of red meat intake.
![]()
ID and IDA prevalence according to clinical, anthropometric, and feeding factors
The clinical characteristics of the included infants are summarized in Table 1. The prevalence rates of ID and IDA varied significantly according to feeding type: 52.9% and 28.3% for BFL infants, 10.1% and 4.2% for MF infants, and 3.0% and 0.0% for FFL infants (P < 0.001). BFL infants with ID exhibited significantly longer durations of breastfeeding, compared to BFL infants without ID (P = 0.001). In addition to feeding type, the presence of ID or IDA was significantly associated with male sex (P = 0.025 and P = 0.082), late CF (at 6–7 months of age; P = 0.019 and P = 0.069), perceived poor CF adequacy (P = 0.003 and P = 0.002), perceived poor red meat intake (P < 0.001 and P < 0.001), introduction of cow's milk before 12 months of age (P = 0.032 and P = 0.018), and low parental CF-related knowledge (P = 0.309 and P = 0.004). However, ID and IDA were not significantly associated with residential area, medical care, or highest maternal education level.
Laboratory and clinical factors according to feeding types
Because ID and IDA were highly prevalent among BFL infants, we compared the hematological and clinical parameters among the 3 feeding types (Table 2). Significant differences in all iron status parameters were observed when we compared BFL infants with those from the 2 other groups (P < 0.001). BFL infants were significantly less likely to gain weight between birth and the study enrollment, compared to FFL infants (P < 0.001), although FFL infants had lower birth weights. The magnitude of weight gain was not significantly different when we compared the BFL and MF infants or the FFL and MF infants (both P > 0.05). Late CF introduction was significantly more common in the BFL group, compared to the 2 other groups (P = 0.009). The BFL group also exhibited a higher rate of perceived poor CF adequacy (P < 0.001) and perceived poor red meat intake (P < 0.001).
Table 2
Laboratory and clinical parameters according to feeding type (n = 619)
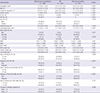
P values were calculated using the χ2 test unless stated otherwise.
MF = mixed feeding, MCV = mean corpuscular volume, ID = iron deficiency, IDA = iron deficiency anemia, SGA = small for gestational age, BWZ = Z-scores for birth weight, WAZ = Z-scores for weight for age, CF = complementary feeding, IQR = interquartile range.
*The values are presented as median (IQR). The comparisons according to feeding type were performed using the Kruskal-Wallis's test; †The values are presented as mean ± standard deviation. The comparisons according to feeding type were performed using one way analysis of variance; ‡Fold weight gain was calculated as current weight (kg) divided by birth weight (kg); §Adequacy of CF means parental subjective assessment on adequacy of CF; ∥Adequacy of red meat intake means parental subjective assessment on adequacy of red meat intake.
![]()
Analysis of CF-practice related factors in the BFL group
To examine the association between feeding practice-related factors and feeding type, we performed a subgroup analysis of the 288 BFL infants. Their clinical parameters according to parental perception of red meat intake are summarized in Table 3. Perceived poor red meat intake was significantly associated with female sex (P = 0.011), SGA (P = 0.011), perceived poor CF adequacy (P < 0.001), and poor parental CF knowledge, especially regarding the timing of red meat introduction (P < 0.001). There were also significant positive associations between late CF introduction and perceived poor CF adequacy (24/85 vs. 85/203; P = 0.030), as well as between late CF introduction and late introduction of red meat (1/85 vs. 24/203; P = 0.003). However, late CF introduction was not significantly associated with perceived poor red meat intake, and late red meat introduction was not significantly associated with perceived poor red meat intake.
Table 3
Laboratory and clinical parameters according to the caregivers' subjective assessment of red meat intake adequacy for the exclusively/mostly breastfed infants until late infancy (n = 288)
P values were calculated using the χ2 test unless stated otherwise.
MCV = mean corpuscular volume, ID = iron deficiency, IDA = iron deficiency anemia, SGA = small for gestational age, BWZ = Z-scores for birth weight, WAZ = Z-scores for weight for age, CF = complementary feeding, IQR = interquartile range.
*The values are presented as median (IQR). The comparisons according to red meat intake were performed using the Mann-Whitney's test; †The values are presented as mean ± standard deviation. The comparisons according to red meat intake were performed using the independent samples t-test; ‡Fold weight gain was calculated as current weight (kg) divided by birth weight (kg); §A total of 481 mothers reported their duration of breastfeeding; ∥Adequacy of red meat intake means parental subjective assessment on adequacy of red meat intake.
![]()
Risk factors associated with ID
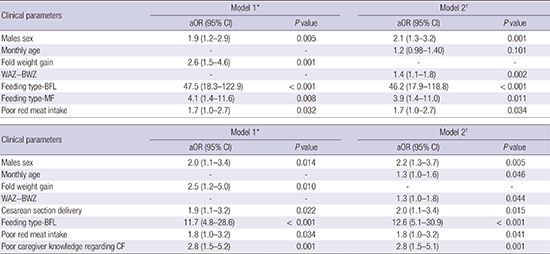
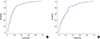
The logistic regression analyses revealed that, in Model 1, ID was independently associated with male sex (adjusted odds ratio [aOR], 1.9; 95% confidence interval [CI], 1.2–2.9), high post-birth weight gain (aOR, 2.6; 95% CI, 1.5–4.6), BFL (aOR, 47.5; 95% CI, 18.3–122.9), MF (aOR, 4.1; 95% CI, 1.4–11.6), and perceived poor red meat intake (aOR, 1.7; 95% CI, 1.0–2.7) (Table 4). Feeding type was the most significant and potent risk factor for ID. The AUROC was 0.846 for Model 1 (Fig. 2A). Similar results were observed for Model 2, which used the Z-score as the independent variable for weight gain after birth instead of fold weight gain.
Table 4
Logistic regression analysis of ID according to demographic, anthropometric, and feeding-related parameters (n = 619)

ID = iron deficiency, aOR = adjusted odds ratio, CI = confidence interval, WAZ = Z-scores for weight for age, BWZ = Z-scores for birth weight, BFL = breastfeeding until late infancy, MF = mixed feeding, AUROC = area under the receiver operating characteristic curve.
*Model 1 included fold weight gain as the independent parameter representing weight gain after birth. The AUROC is 0.846 (95% CI, 0.814–0.878); †Model 2 included Z-scores as the independent parameter representing weight gain after birth. The AUROC is 0.847 (95% CI, 0.815–0.879).
![]()
Risk factors associated with IDA
Because the FFL patients did not exhibit IDA, we analyzed the risk factors for IDA among the 461 infants with BFL and MF (Table 5). The risk of IDA was independently associated with male sex (aOR, 2.0; 95% CI, 1.1–1.4), high post-birth weight gain (aOR, 2.5; 95% CI, 1.5–5.0), Cesarean section delivery (aOR, 1.9; 95% CI, 1.1–3.2), BFL (aOR, 11.7; 95% CI, 4.8–28.6), perceived poor red meat intake (aOR, 1.8; 95% CI, 1.0–3.2), and poor parental CF-related knowledge (aOR, 2.8; 95% CI, 1.5–5.2). Feeding type was also the most significant and potent risk factor for IDA. The AUROC was 0.798 for Model 1 (Fig. 2B). Similar results were observed for Model 2, which used the Z-score as the independent variable for weight gain after birth instead of fold weight gain.
Table 5
Logistic regression analysis of IDA according to demographic, anthropometric, and feeding-related parameters (n = 452)

IDA = iron deficiency anemia, aOR = adjusted odds ratio, CI = confidence interval, WAZ = Z-scores for weight for age, BWZ = Z-scores for birth weight, BFL = breastfeeding until late infancy, AUROC = area under the receiver operating characteristic curve.
*Model 1 included fold weight gain as the independent parameter representing weight gain after birth. The AUROC is 0.798 (95% CI, 0.749–0.846); †Model 2 included Z-scores as the independent parameter representing weight gain after birth. The AUROC is 0.801 (95% CI, 0.753–0.849).
![]()
DISCUSSION
Our results indicate that the prevalence of ID among healthy Korean weaning-age infants was most significantly influenced by the feeding method, as approximately 50% of the BFL infants developed ID, while none of the FFL infants developed IDA. In addition, ours is the first study to suggest that adequacy of red meat intake could be a significant CF-related predictors of ID and IDA among Korean infants. Based on the natal and postnatal risk factors that we investigated, including these feeding-related factors, we have proposed the first Korean models for predicting ID and IDA during late infancy.
In the present study, approximately 28% of healthy full-term infants had ID during their late infancy, and these cases did not involve recent acute febrile illness or medicinal iron replacement. Among the infants with ID, approximately one-half also had IDA, which indicates that the prevalence of IDA in Korea may be midway between the prevalence rates in developed and developing countries. For example, previous large-scale studies of infants and young children have estimated ID prevalence rates of 5%–20% in Europe and 9% in the US (1921). The estimated IDA prevalence rates are 3%–9% in Europe and 2.1% in the US, whereas Chinese and Brazilian studies have reported far higher prevalence rates of anemia (28.2% and 36.0%, respectively) (19213031). Few large-scale Korean studies have evaluated the prevalence of ID among healthy term infants, and one small-scale Korean study from 2007 reported a similar prevalence of ID among exclusively breastfed term infants from a large suburb, compared to the present study (32).
In the present study, BFL was the strongest predictor of ID and IDA after adjusting for other risk factors in the final diagnostic prediction model, as BFL infants had a 48-fold higher risk of ID compared to FFL infants and a 12-fold higher risk of ID compared to MF infants (mainly breastfed only until early infancy). Furthermore, the infants with ID had significantly longer breastfeeding periods, compared to the non-ID group. These results agree with the findings from a recent large-scale Canadian study of 1,600 toddlers, which revealed an inverse association between the total duration of breastfeeding and serum ferritin levels (33). Previous Korean studies have also reported that the prevalence rates of ID or anemia were significantly higher among exclusively breastfed infants with/without CF, compared to infants with other feeding methods (242532).
The timing of CF initiation may be associated with iron status among exclusively breastfed infants from both developed and developing countries (1734). However, we found that the timing of CF initiation was not significantly associated with iron status among the BFL infants. Although this finding conflicts with previous data, our findings are limited to evaluating the association of CF start timing with ID risk during late infancy, as infants with early or late CF may have different diet adequacies. Nevertheless, after adjusting for sex and fold weight gain, we found that the caregiver's subjective assessment of CF adequacy was significantly associated with the risk of IDA among BFL infants (aOR, 1.8; 95% CI, 1.0–3.1; P = 0.033), although it was not included in the final predictive model.
Interestingly, subjective CF adequacy was also closely associated with CF start timing among the BFL infants. Compared to the MF and FFL infants, the caregivers of BFL infants tended to delay starting CF and reported a significantly higher rate of perceived inadequacy of CF intake at the time of the study. Furthermore, the association between perceived inadequate CF and late CF starting was only statistically significant among BFL infants. Based on these results, we assume that a subset of BFL infants may experience difficulty in transitioning to a solid food schedule, which may partially explain the higher prevalence rates of ID and IDA among BFL infants. Thus, BFL status may be associated with less interest in solid foods or the caregivers being relatively passive in promoting adequate solid food intake. Therefore, at least in a subset of breastfed infants, exclusive breastfeeding for 6 months based on the WHO recommendations might create difficulty in transitioning to solid foods, delayed introduction of solid foods, less optimal growth, and a risk of IDA. It may be appropriate to consider personalized approaches, rather than strict adherence to 6 months of exclusive breastfeeding, which might facilitate early solid food introduction for infants who exhibit accelerated growth or who have the natal risk factors for ID that we identified.
Among the CF-related factors from the present study, perceived adequacy of red meat intake was the strongest predictor of ID and IDA. To the best of our knowledge, few Korean studies have investigated the association between red meat intake and ID during late infancy. Low meat intake was a significant risk factor for ID among young European children (21). Unlike in Western countries, Korean parents do not prefer iron-fortified cereals as first foods, and these parents generally provide home-cooked grains and vegetables as first foods. However, these foods have low levels of iron and high levels of phytates, which may actually reduce the absorption of iron from breast milk. Thus, it may be prudent to advise Korean parents to provide red meat during the early transition to solid foods, and our results indicate that promotion of this approach may help prevent ID, especially for the infants with BFL. However, a recent Western study suggested that red meat and iron-fortified cereal have different effects on the shaping of intestinal microbiota in weaning infants (35). Therefore, long-term efforts are also needed to develop and promote iron-fortified cereals that complement Korean dietary styles.
In addition to feeding-related factors, we found that ID risk was related to some natal factors, such as male sex and Cesarean section delivery. Early studies regarding the association between male sex and ID or IDA revealed conflicting population-specific findings, which may indicate that genetic or maternal factors affect this association (11). However, subsequent studies in multiple developed and developing countries have suggested that male sex is associated with ID and IDA (46936). This sex-based difference may be related to boys having lower iron stores at birth and a higher growth rate after birth, as well as various genetic or hormonal factors. Interestingly, the perceived adequacy of red meat intake was significantly higher for caregivers of male infants in our study (P = 0.011; Table 3). Based on these results, we assume that boys may require more iron than girls during late infancy, which has also been suggested by other researchers (36). Thus, it is likely necessary to emphasize the importance of iron intake to caregivers of male infants.
Recently, a meta-analysis revealed a significant association between Cesarean section delivery and anemia among full-term newborns (37). This association may be explained by the quicker cord clamping and weaker placental transfusion during Cesarean section (10). Although only a few studies have reported an association between Cesarean section delivery and anemia during late infancy, a recent Chinese cohort study suggested that these differences were present during both early and late infancy, and we observed similar results (1038). However, a recent Swedish study revealed conflicting results, as delayed cord clamping was associated with improved iron status among 4-month-olds but not among 12-month-olds (3940). These differences may be related to differences in the prevalence rates of ID in developing and developed countries and populations. Based on our findings, it appears that the prevalence rates of ID and anemia during late infancy in Korea are considerably higher than those in Sweden, and the rate of Cesarean section in our Korean population (approximately 33%) was higher than that from the WHO recommendations. Thus, it may be appropriate to consider active measures that address the negative effects of Cesarean section on the prevalence of ID and anemia among full-term Korean infants during their late infancy.
One of the strengths of the present study is that we used stricter criteria for diagnosing anemia, compared to previous studies, and we strictly controlled for factors that could influence hematological test results and the resulting anemia diagnosis. Thus, although we did not consider levels of C-reactive protein, reticulocyte hemoglobin, or transferrin receptor, we improved our ability to accurately diagnose ID by excluding cases of acute febrile diseases, gastroenteritis within the past 2 weeks, and medicinal iron intake. However, the present study also has several limitations that warrant consideration. First, we used questionnaires to collect data from a single-center group of individuals who resided in large cities; these factors are associated with known risks of bias. Second, we did not adjust the analyses for prenatal factors (e.g., maternal status) or precise economic status. Nevertheless, we investigated the insurance status of all participants, as well as the mothers' highest education in a subset of the participants, which revealed that > 80% of the participants were college graduates (higher than the corresponding education level among Koreans who are in their 30s), and parents generally had good CF knowledge. Thus, it is unlikely that our high ID prevalence was related to biased data that were related to low socioeconomic status. Third, we relied on the caregivers' self-reported perceptions regarding CF, which were not quantified. However, our diagnostic prediction model is intended as a ready-to-use tool that complements the busy practice of Korean clinicians, although its diagnostic value may be reduced if it is used for caregivers who have low CF knowledge. Nevertheless, we hope that caregivers' CF knowledge may be improved by education regarding diet, which is administered by pediatricians and provided through the Korea National Health Screening program for infants and children.
In conclusion, we suggest that BFL may be the strongest predictor of ID and IDA, and perceived inadequacy of red meat intake and poor caregiver's knowledge regarding CF practice can be important CF practice-related predictors of poor iron status among healthy Korean infants of weaning age. In this population, ID or IDA may be also predicted by male sex, Cesarean section delivery, and rapid growth. Although, BFL was a potent risk factor for ID and IDA in our analysis, breastfeeding has many health benefits for infants. Early and meticulous education regarding iron-rich food intake, such as red meat, and monitoring by the healthcare provider may help promote adequate iron intake in CF for breastfed infants during their late infancy, especially for those with additional risk factors for poor iron status. If necessary, iron supplementation or iron status testing during late infancy should be considered for these high-risk infants.
 XML Download