

 PDF
PDF ePub
ePub Citation
 Print
Print


INTRODUCTION
Retinal ganglion cells (RGCs) can be stimulated by electrical pulses so that action potentials are generated even when the responses of photoreceptors to visual stimuli are lost due to photoreceptor degeneration (1). A retinal implant using prosthetic electrical stimulation has been developed to provide alternative partial vision to blind people who lost their vision due to a retinal degenerative disease, such as retinitis pigmentosa (RP) or age-related macular degeneration (AMD) (2). According to the results from clinical tests of retinal implants, patients with implants can perceive phosphene with simple spatial patterns, such as large objects and letters (3). Spatial resolution may be improved to some degree by increasing the number of stimulation electrodes, which enables visual guidance of fine hand movements (4). Still, the performance of retinal implants should be improved, as a recent clinical test in multiple human subjects reported inconsistent and variable results of phosphene perception when identical stimulation parameters were applied to different subjects (5).
The observation of neural activities can provide valuable insights into the success of prosthetic electrical stimulation. We have recently shown that temporal patterns of visual input could be successfully decoded from population activities of RGCs evoked by a temporally patterned stimulation pulse train, in both normal (6) and photoreceptor-degenerated retinas (7). Cottaris and Elfar (8) demonstrated that the spatial origin, duration, and amplitude of each stimulation pulse could be identified with multisite cortical local field potential. Prior to these studies, RGC neural activities had been investigated to provide preliminary information on the requirements for electrical stimulation, such as the threshold current level, the latency of evoked neural activities, and the effect of stimulation waveforms (9).
It is essential to examine both temporal and spatial characteristics of RGC responses in order to develop the details of the stimulation methods; i.e., the ‘stimulation strategy,’ for a faithful delivery of spatiotemporal visual information to the brain. This is obvious in that the spatial and temporal aspects of external visual inputs should be properly encoded in the neural activities evoked by stimulation so that they can be transferred to and interpreted in the brain. Previous studies were mainly focused on either the temporal (110) or spatial (11) aspects of RGC activity patterns, and the encoding of spatiotemporal temporal visual information by evoked RGC activities has not been analyzed in detail.
In this study, our specific aim was to investigate whether spatiotemporal visual information can be decoded from the RGC network activity evoked by patterned electrical stimulation. Based on an experimental setup of an in vitro model of retinal implants (11), we tested an amplitude-modulation scheme of biphasic current pulse trains. Here, we assumed that spatiotemporal visual information would be translated to the neural activities by multiple amplitude-modulated electrical pulse trains, just as in the case of cochlear implants, in which the pulse amplitude is modulated by the amplitude of sound pressure. Along with a thorough characterization of spatial spreading of stimulation current and temporal information encoding, we demonstrated that the multipixel spatiotemporal visual information can be accurately decoded from the population activities of RGCs that are stimulated by amplitude-modulated pulse trains.
MATERIALS AND METHODS
Retinal tissue preparation and electrophysiological recoding
The Rd1 (C3H/HeJ strain) mice (age: postnatal day 56) were used in this study. The methods for retinal tissue preparation and for the recording of RGC activities were previously reported (1) and are briefly described here. Retinal patches from Rd1 mice were prepared following the method of Stett et al. (11). Retinas were isolated, cut into patches of –3 × 3 mm, and mounted on a planar microelectrode array (MEA; Multichannel Systems GmbH, Reutlingen, Germany) so that the ganglion cell layer faced the MEA. The MEA contained 64 TiN electrodes (circular shape; diameter: 30 μm, interelectrode spacing: 200 μm, impedance: < 50 kat 1 kHz) on a glass substrate in an 8 × 8 square-type grid layout. The 4 electrodes at the vertices were inactive. The waveforms from the electrodes were recorded with a sampling rate of 25 kHz/channel (amplification gain: 1,200, bandwidth: 10–3,000 Hz) and stored on a hard drive using data acquisition software (MC_Rack; Multichannel Systems GmbH). The data recorded by MC_Rack were converted to text file by MC_DataTool (Multichannel Systems GmbH). The recorded waveforms were futher analyzed to generate single unit spike trains by spike detection and spike sorting based on principal component analysis (12).
Electrical stimulation
Amplitude-modulated current pulse trains were generated with a stimulus generator (STG 1004; Multichannel Systems GmbH) and applied to the retina via 2 or 4 channels of the MEA at its vertices. The other channels were used for recording. The stimuli consisted of symmetric, charge-balanced biphasic pulses (anodic first, with no temporal separation between the anodic and cathodic phases).
For the characterization of the modulation behavior of RGC responses by pulse amplitude, trains of 20 identical pulses were applied at 1-second interpulse intervals from one of the stimulating electrodes while the pulse amplitude was increased from 2–60 μA (2, 5, 10, 20, 30, 40, 50, and 60 μA). The pulse rate and pulse duration were fixed at 1 Hz and 500 μs, respectively. This procedure was repeated for all of the stimulating electrodes.
Then, the amplitude-modulated pulse trains were applied to investigate whether the RGC responses can be made to encode spatiotemporal visual information. The pulse amplitudes were modulated according to predetermined temporal patterns of brightness of pixels. The procedure for the pulse amplitude modulations based on natural scenes is described below (Fig. 1). Black-and-white movies of natural scenes were recorded by a camcorder (Xacti HD1010; Sanyo, Osaka, Japan) for 2 minutes at 60 frames/s with a 1,280 × 720 resolution. The resolution was reduced to 16 × 9 by downsampling. Two or 4 pixels of the 16 × 9 resolution scene were randomly selected, and the amplitude of each pulse was modulated according to the time-series of the pixel intensity within the range of 1–20 μA (1 μA resolution). The pulse trains were simultaneously applied to the retina via 2 or 4 channels of the MEA to present the electrical stimulation with spatial pattern, as shown in Fig. 1. The pulse repetition rate varied from 2–10 Hz (2, 4, 6, 8, and 10 Hz). The pulse duration per phase varied from 200–400 μs (200, 300, and 400 μs).
Fig. 1
Encoding and decoding of visual information. Pulse trains of which amplitudes were modulated according to the brightness of 2 (or 4) pixels were delivered to RGCs via the stimulation electrode on the MEA. The visual information was reconstructed (i.e., decoded) from the evoked RGC activities. Then, the “goodness-of-fit” between the original and decoded pulse amplitude time-series was calculated to evaluate the effectiveness of the stimulation.
MEA = microelectrode array, RGC = retinal ganglion cell.
Spike train decoding
Spike train decoding was used to estimate how accurately the spatiotemporal visual information was transferred to RGC neural activities by multichannel electrical stimulation. Because each pulse train was applied to each stimulating electrode independently, it was possible to select RGCs whose evoked activities were effectively modulated by a specific pulse train (as in Fig. 2E). The selected RGCs were used to decode the pulse amplitude time-series. Thus, 2 and 4 groups of RGCs were used to decode visual spatiotemporal information with 2 and 4 pixels, respectively. The overall procedure for spike train decoding is illustrated in detail in Fig. 2 of Ryu et al. (7) and briefly described herein. The raw waveforms from each electrode were transformed into single unit spike trains, and then, the RGC spike trains were transformed to a firing rate time-series by counting the numbers of spikes in 50 ms bins.
Fig. 2
Temporal patterns of the neural activities of RGCs. Rhythmic bursting patterns of (A) spontaneous activity and (B) electrically evoked response (pulse amplitude: 20 μA, pulse rate: 1 Hz). (C) PSTH derived from (B). As the arrows indicate, both spontaneous and electrically evoked activities show rhythms of bursts at similar frequencies. (D) ISIH of spontaneous spikes derived from (A). (E) Modulation of response strength by pulse amplitude. The response strength of the RGCs was measured by counting the number of poststimulus spikes within approximately 100 ms of the stimulus onset, which corresponds to the first peak in the PSTH shown in Fig. 2C.
RGC = retinal ganglion cell, PSTH = post-stimulus time histogram, ISIH = interspike interval histogram.
The input to the decoder consisted of firing rates of multiple RGCs within a number of time bins. That is, the firing rates of multiple RGCs within a short temporal interval after the stimulus were used to decode the pulse amplitude time-series at every time bin, corresponding to the intensity time-series of multiple pixels. The input-output relationship can be described as follows:

Here, ŝ(i) is the estimated value of the pulse amplitude of one electrode at the ith time bin, and fp(j) is the jth coefficient of the linear filter corresponding to the pth RGC. rp(i) is the firing rate of the pth unit at the ith time bin of 50 ms duration. Φ(.) indicates a general nonlinear function. The above expression should approximate the inverse mapping of the neuronal encoding process.
The decoder can be regarded as a temporal filter because it calculates the output from the past and present values of the input. When linear mapping is used, the decoding algorithm becomes an optimal linear finite impulse response (FIR) filter (13). In this case, Φ(.) is merely a unity function, and the coefficients fp
(j) were obtained by the least squares method, as illustrated by Warland et al. (14). More generally, nonlinear regression algorithms, such as multilayer perceptron or support vector machine (SVM), can be used for the input-output mapping of the decoding algorithm. The specific algorithm of the SVM that we used is described in Hoegaerts et al. (15).
The recordings were divided into 2 groups of equal size (i.e. 1–2 minutes recordings). The first one minute of the recording was used for the training of the decoding algorithms and the remaining one minute was used to test the trained decoding algorithms. To quantify the accuracy of the information decoded from RGC activity, similarities between the original and decoded pulse amplitude time-series were computed by correlation coefficient (CC).
RESULTS
In total, 1,185 single units of RGCs showing apparent spiking activities were identified from 27 retinal patches obtained from 27 mice. The average number of RGCs per patch was 43.89 ± 5.66. Among these, 894 RGCs (33.11 ± 7.51 RGCs/patch, 75.44%) showed consistent and evident modulation of evoked responses according to pulse amplitude, as shown in Fig. 2E (well-modulated RGCs), and were included in further analyses.
Fig. 2A and B show typical waveforms of spontaneous and electrically evoked activities of an RGC. The oscillatory bursts in the spontaneous activity produced the distinct shape of the interspike interval histogram (ISIH, Fig. 2D), with 2 apparent peaks in the ISIH. The first peak at –10 ms resulted from an interspike interval within each burst of spikes. The second peak at –80 ms corresponded to the interburst interval. Rhythmic burst firing patterns were also observable in electrically evoked RGC activities, as indicated by the arrows with dotted lines in Fig. 2A-C). The RGC responses were in the form of repetitive oscillatory bursts with strong phase-locking across different trials (Fig. 2B), as we have shown in a previous study (1). The phase-locked bursts of spikes were maintained up to 500–700 ms (Fig. 2B and C). In spite of the significant alteration in firing patterns of electrically evoked activities, the strength of the evoked activities could be effectively modulated by the amplitude of the stimulation pulses (Fig. 2E), just as in the case of a normal retina (6). The number of poststimulus RGC spikes within 100 ms increased essentially monotonically when the pulse amplitude was increased to 20 μA and were saturated thereafter. Short latency responses elicited by direct activation of RGCs were also observed after artifact removal at –3 ms poststimulus. Short latency spike waveforms are significantly contaminated by stimulation artifact. And, only a single short latency spike is evoked in response to a single current pulse, so that the decoding accuracy in our study is not depedent on the short latency response. Thus, we did not included the short latency responses, which are severly contaminated by stimulation artifact and not essential for the decoding in this study (1617).
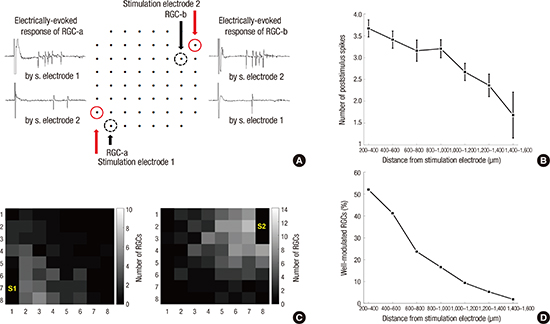
The spatial patterns of evoked RGC activities were characterized by the relationship between the response strength and the distance between stimulation and recording electrodes (Fig. 3). The electrical stimulation was applied at one of the 2 stimulating electrodes in Fig. 3A. As a typical example, for a 20 μA amplitude biphasic pulse, the RGCs within 800–1,000 μm of the stimulation electrode fired 3 spikes (Fig. 3A and B). We defined the RGCs, the firing rates of which could be effectively modulated by pulse amplitude, as well-modulated RGCs (Fig. 2E). We tried to find the spatial range of effective stimulation from the distribution of the well-modulated RGCs (Fig. 3C and D). Stimulation pulse trains were applied independently to the 2 stimulation electrodes. The RGCs were clustered into 2 groups (group 1 and 2) according to the strength of response to the electrical stimulation. That is, if the stimulation at the stimulating electrode 1 (S1) elicited more spikes at a specific RGC than the stimulation at the stimulating electrode (S2), then the RGC was assigned to group 1. Fig. 3C show the spatial distribution of the group 1 and 2 RGCs. It clearly indicates that the RGC activities were evoked and modulated more effectively by the stimulation site in closer proximity. Fig. 3D shows the ratio of well-modulated RGCs as a function of the distance from the stimulation electrode, which implies that the range of RGCs for effective encoding of information is almost linearly decreased as a function of the distance.
Fig. 3
Dependence of evoked RGC activities on the distance to the stimulation site. (A) Typical temporal patterns of evoked RGC activities. Stimulation pulse trains were applied independently to one of the 2 stimulation electrodes (pulse amplitude: 20 μA). (B) Response strength as a function of the distance between the stimulation and recording electrodes. (C) Spatial profile of the well-modulated RGCs. The number of well-modulated RGCs displayed at the location of the recording electrodes. (D) The percentage of the electrodes with well-modulated RGCs as a function of the distance between the stimulation and recording electrodes. The percentages were calculated by the ratio between the number of all the electrodes and the number of electrodes where the well-modulated RGCs were observed. This result was obtained from 19 retinal patches.
RGC = retinal ganglion cell.
When 2 independent amplitude-modulated pulse trains were applied simultaneously at the 2 stimulating electrodes, both of the pulse amplitude time-series obtained from 2 pixels of natural scenes could be successfully decoded from the RGC spike trains (Fig. 4). A nonlinear decoder using a SVM resulted in more accurate decoding, although both linear and nonlinear methods yielded satisfactory decoding. The decoding accuracy was strongly dependent on the details of stimulation, especially on the pulse amplitude range. Fig. 4A and B show the comparison of the original and decoded pulse amplitude time-series when the range of the pulse amplitude was 1–20 μA and 1–10 μA, respectively (pulse rate: 8 Hz, pulse duration: 300 μs). We tested several stimulation parameters and found that the decoding accuracy was the highest for the pulse amplitude range of 1–20 μA and the pulse duration of 300 μs (Fig. 4A). When the amplitude range was changed to 1–10 μA while fixing the pulse rate and duration, the decoding accuracy significantly deteriorated (Fig. 4B). The difference in decoding accuracy was statistically significant (Fig. 4C, CC was 0.5912 ± 0.24 and 0.3827 ± 0.23 at 1–20 and 1–10 μA, respectively; 17 retinal patches, P < 0.001). Another critical parameter was the pulse rate. As shown in Fig. 4D, when the pulse rate was changed to 2 Hz, the decoding accuracy was significantly lower than at 8 Hz (CC was 0.6733 ± 0.18 and 0.4177 ± 0.23 at 8 and 2 Hz, respectively; 6 retinal patches, P < 0.001). The pulse amplitude time-series applied to 4 stimulating electrodes could also be successfully decoded from a group of RGCs (Fig. 5), just as it was with 2-channel stimulation. More accurate decoding was possible by increasing the number of RGCs for the decoder input, but the increase of decoding accuracy was saturated at –10 cells (data not shown). Although the distance between adjacent stimulating electrodes was as short as 1,216 μm, 4 independent time-series were faithfully reconstructed (Fig. 5A). The decoding accuracy was calculated for several different stimulation parameters, and it was the highest for the pulse amplitude range of 1–20 μA and the pulse duration of 400 μs (Fig. 5A). When the amplitude range was changed to 1–10 μA while fixing the pulse rate and duration, the decoding accuracy significantly decreased (Fig. 5B, CC was 0.6679 ± 0.10 and 0.4788 ± 0.19 at 1–20 and 1–10 μA, respectively; 7 retinal patches, P < 0.001). The decoding accuracies of 2 channel and 4 channel stimulations were not compared directly since different retinal patches were used for the 2 channel and the 4 channel stimulation experiment.
Fig. 4
Examples of original and decoded pulse amplitude time-series, obtained from 2 pixels of a natural scene. (A) Pulse amplitude range: 1–20 μA, pulse duration: 300 μs, pulse rate: 8 Hz. (B) Pulse amplitude range: 1–10 μA, pulse duration: 300 μs, pulse rate: 8 Hz. The location of stimulation electrode of the MEA is described in each panel (open circle: stimulation electrode, closed circle: ground electrode). (C, D) Decoding accuracy vs. simulation parameters. Comparison of the decoding accuracies of (C) 2 different pulse amplitude ranges (obtained from 17 retinal patches, pulse rate: 8 Hz, SVM) and (D) 2 different pulse rates (obtained from 6 retinal patches, pulse amplitude range: 1–20 μA, SVM). The decoding accuracy significantly changed in both cases (t-test, P < 0.001**).
MEA = microelectrode array, SVM = support vector machine.
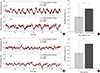
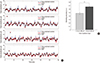
Fig. 5
Examples of original and decoded pulse amplitude time-series, obtained from 4 pixels of a natural scene. (A) Pulse amplitude range: 1–20 μA, pulse duration: 400 μs, pulse rate: 8 Hz. Pulse amplitude time-series applied to 4 stimulating electrodes could also be successfully decoded from a group of RGCs, just as it was with 2-channel stimulation. (B) Decoding accuracy vs. pulse amplitude ranges. Four-pixel decoding accuracy was significantly different at 2 different pulse amplitude ranges (t-test, P < 0.001**, obtained from 7 retinal patches, pulse rate: 8 Hz, SVM).
RGC = retinal ganglion cell, SVM = support vector machine.
DISCUSSION
In this study, we demonstrated that spatiotemporal visual information can be decoded from the RGC activities of a photoreceptor-degenerated retina evoked by simultaneous multichannel stimulation based on pulse amplitude modulation. In our recent studies on temporal information encoding by electrically stimulated RGCs, the pulse amplitude time-series could be successfully reconstructed from evoked RGC activities (67). This is supported by recent reports on human clinical trials of retinal implants, such as the report of Greenwald et al. (18), where it was shown that the brightness of the phosphene elicited by electrical stimulation of the retina followed the current amplitude. Thus, we inferred that pulse amplitude modulation might be an appropriate approach for delivering temporal visual information to the retina.
The encoding of spatial information is evidently crucial for visual function restoration. Cottaris and Elfar (8) showed that specific features of electrical stimulation pulses, including spatial location of the stimulation site, could be identified from local field potential in V1. Hence, it is natural to expect that spatial information of visual input might be effectively encoded by prosthetic electrical stimulation as well. Our results have explicitly shown for the first time, to our knowledge, that multipixel spatiotemporal information can be decoded from the activities of the RGC network when evoked by a multichannel amplitude-modulated stimulation pulse train. These results support the plausibility of a pulse generation strategy based on amplitude modulation for successful encoding of spatial information in neural activities.
The decoding accuracy was strongly dependent on the details of stimulation. The range of amplitude modulation was crucial, as it could be predicted from the characteristics of the RGC-evoked firing rate as a function of pulse amplitudes (Fig. 2E). It is obvious that an excessively wide pulse amplitude range is not beneficial for high decoding accuracy, due to the firing rate modulation characteristics shown in Fig. 2E. This resulted in strong dependence of the decoding accuracy on the range of amplitude modulation. When the pulse amplitude was modulated at 1–10 μA, which is half of the optimum (1–20 μA), the decoding accuracy considerably deteriorated, due to the insufficient changes in the firing rate that caused ineffective encoding of the intensity variation. Considering the high level of spontaneous RGC firing in photoreceptor-degenerated retinas (19), it is also feasible that the level of electrically evoked activities was not differentiated from that of the spontaneous activities.
The current spread to adjacent sites is another reason to limit the pulse amplitude range, and the spatial profile of the evoked RGC activities (Fig. 3) was useful in determining the appropriate pulse amplitude range. Other parameters, such as pulse duration or pulse rate, also significantly affected the decoding accuracy. The optimization of the stimulation strategy should be performed in a multidimensional parameter space in real clinical applications of retinal implants, as demonstrated conceptually by Eckmiller et al. (20). The decoding-based strategy of our study can be utilized for this purpose as well.
For successful perception of a geometrical pattern, multiple localized phosphenes should be generated, and their brightness should be controlled individually. This is expected to be achieved by selective activation of groups of RGCs in close proximity of each stimulating electrode. We tried to investigate whether such a spatially selective activation of groups of RGCs is possible by observing the evoked RGC activities as a function of the distance from the stimulation electrode.
It is known that the spatial resolution that is achievable by long-latency RGC responses (i.e., by indirect activation) is limited in space by spatial extent of the ganglion cell dendritic field and is better than that of short-latency response (i.e., by direct activation) (21). However, this is for a case when the size of the stimulation electrode is sufficiently small. The spatial resolution deteriorates for a larger electrode due to the current spread. Considering that the electrode size is considerably large and that the current amplitude is substantially above the threshold in our study, as well as in clinical trials conducted thus far, the spatial resolution is expected to be worse than the optimum determined by the ganglion cell dendritic field. The current spreading was indeed quite substantial, and the evoked activities were quite strong for the RGCs within 800–1,000 μm from the stimulating electrodes, as shown in Fig. 3.
The effect of stimulation was spatially limited despite the current spreading. The well-modulated RGCs were concentrated near the site of stimulation (Fig. 3). Less than 20% of the well-modulated RGCs were outside of 800 μm. Considering that 1 mm corresponds to a visual angle of 3.4° in human eyes (22), the spatial resolution achievable by our strategy is expected to be 2°–3°. It is accepted that a spatial resolution of 10° is required for perceiving large objects and movement direction (23) and thus, a spatial resolution of 2°–3° is surely enough to be helpful in improving the quality of life of the blind. Further improvements should be expected with smaller electrode sizes and inter-electrode spacing.
The decoding accuracy was strongly dependent on the pulse rate, as shown in Fig. 4, where the pulse rate of 8 Hz was significantly more effective than a rate of 2 Hz. A higher pulse rate might be beneficial because it prevents abnormal rhythmic RGC responses due to the short inter-pulse intervals. However, the pulse rate should be determined carefully because excessively high pulse rate may suppress rather than activate the RGC activities (10).
It is reported that short-width pulses can selectively evoke short-latency responses of RGCs and generate precise temporal spiking patterns by evoking only one spike with each pulse (10). A similar strategy has recently been implemented using optogenetic stimulation as well (24). However, this requires minute electrode size and short inter-electrode distance, which are not compatible with current retinal implant devices undergoing clinical trials, which are rather bulky. For example, the stimulating electrode size is as large 200 µm (25). The size and inter-electrode spacing of these current devices are comparable to those in our study. Thus, our in vitro model can provide a basis for the evaluation and optimization of a stimulation strategy for these current devices.
In conclusion, we showed that multipixel spatiotemporal visual information could be decoded accurately from RGC network activity evoked by patterned electrical stimulation when the detailed parameters of the simulation pulse trains were carefully determined. Our results suggest that useful visual function may be restored by amplitude modulation-based retinal stimulation.
 XML Download