

 PDF
PDF ePub
ePub Citation
 Print
Print


INTRODUCTION
Obstructive sleep apnea (OSA) is a silently advancing sleep-related breathing disorder, and the majority of high-severity patients are unaware of their condition (12). OSA diagnosis is very important to those whose sleep apnea is undetected. OSA episodes lead to oxygen de-saturation and subsequent arousals resulting in sleep fragmentation, fatigue, and excessive daytime sleepiness. According to several studies (3), a considerable percentage of patients with OSA remain unidentified. Undiagnosed OSA can significantly affect the quality of life and cause health complications including fatigue, daytime sleepiness, motor vehicle crashes, reduced work performance, sudden death, and cardiovascular disease (456).
Polysomnography (PSG) is a standard diagnostic tool for OSA that simultaneously performs electroencephalogram (EEG), electrocardiogram (ECG), electrooculogram (EOG), electromyography (EMG), and oxygen saturation (SpO2) analyses, and also monitors mouth, nasal, abdominal, and thoracic breathing; body position; and snoring. These signals can be supported objectively to assess and monitor OSA. However, PSG is expensive, inconvenient, and labor-intensive, making it unwieldy for unattended OSA screening in home healthcare settings.
To overcome these challenges, numerous alternative methods have been proposed based on various physiological signals (78). For instance, several studies (9) have investigated snoring sounds for OSA detection via spectral analyses. However, the highly sensitive microphones that these techniques employ are costly, and background noise can affect the quality of recording (10). ECG-based studies have considered heart rate variability (HRV) analyses for apnea detection. These methods reduce the issues associated with conventional PSG, but are limited by the inconvenience of attaching electrodes to the body (11). Pulse oximetry-based systems measure photoplethysmogram (PPG) and SpO2. Pulse rate variability (PRV) from PPG and oxygen desaturation index (ODI) from SpO2 is correlated well with the OSA severity. Depending on the patient group, pulse oximetry yields an over/underestimation of incidents for OSA detection. To the best of our knowledge, there are no reported studies based on a piezo-electric snoring sensor for OSA detection.
A piezo-electric snoring sensor is a small, cost-effective sensor that is widely used for monitoring snoring sounds in PSG studies. In addition, it is highly efficient under mechanical loading conditions (12), and its signal-to-noise ratio makes it an excellent platform for tracking snoring episodes. In previous studies, a piezo-electric sensor was used for measuring bio-signals including snoring (1314), respiration rate (15), and sleep activities (16). Because it can sense a mechanical load, it is less sensitive to ambient noise than a microphone. It can be attached to the neck of a patient and detect heartbeats through the pulse waves originating from the carotid artery. It can not only provide data on snoring, but also on movement and heartbeat during sleep. We, therefore, hypothesize that a piezo-electric sensor can be used as an alternative tool for OSA diagnosis.
The aim of this study was to investigate a novel method for OSA classification using a piezo-electric sensor. All snoring episodes and heartbeats are identified in the form of piezo-electric signals during sleep. These vital signs are analyzed via time–frequency domains, and features are extracted to differentiate between normal breathing and OSA during sleep. Finally, machine learning algorithm on a support vector machine (SVM) is employed to classify an event as OSA event or normal breathing.
MATERIALS AND METHODS
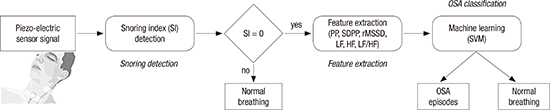
In this study, we propose a novel method for OSA classification using a piezo-electric sensor. Fig. 1 presents all the steps of the proposed method. First, all snoring episodes are detected and then the snoring index (SI) is calculated. Next, the SI is used to determine the suspected region of OSA for the PRV analysis. The PRV signal for extracting the temporal and spectral domain features is identified using a piezo-electric sensor. Finally, OSA classification is performed via an SVM using the features obtained from the PRV analysis.
 | Fig. 1Steps of the proposed method.
OSA = obstructive sleep apnea, PP = pulse-to-pulse interval, SDPP = standard deviation of the pulse-to-pulse interval, rMSSD = root mean square of successive differences, LF = low-frequency, HF = high-frequency, SI = snoring index, SVM = support vector machine.
|
Subjects and data collection
We enrolled 98 patients suspected with OSA, and conducted a full-night PSG for these patients at the Samsung Medical Center in Seoul, Korea as per standard clinical guidelines (1). The exclusion criteria in this study were as follows: patients with central sleep apnea, mixed sleep apnea, and cardiovascular disorders. A total of 45 subjects suffering from OSA were included in this study (Table 1). All patients were subjected to a full-night, attended diagnostic PSG using an Embla N7000 (Embla Systems Inc., Broomfield, CO, USA) device. The PSG studies were scored according to the standard criteria defined by the sleep specialists at American Academy of Sleep Medicine (AASM). All subjects provided written informed consents, and the study protocol was approved by The Institutional Review Board of the Samsung Medical Center. The piezo-electric sensor (REF 1420610; Embla Systems Inc.) was attached to the neck of a patient to measure vital signs during nocturnal PSG. Signals were recorded at a sampling rate of 200 Hz, which is the minimum acceptable sample rate for snoring according to the AASM guideline (1). Snoring episodes were traced via a sleep-specific program, RemLogic (Embla Systems Inc.) and footnoted by an experienced sleep specialist. Signal processing and analysis were performed using MATLAB (Mathworks Inc., Natick, MA, USA).
Table 1
Anthropometric and sleep characteristics of study subjects
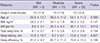
Data are shown as mean ± SD.
AHI = apnea-hypopnea index, BMI = body mass index, SD = standard deviation.
![]()
Snoring detection
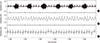
In this study, snoring episodes were detected via a piezo-electric sensor as shown in Fig. 2. We used the method proposed previously by our research team for automatic snoring detection (13). This method was based on a short-time Fourier transform analysis with a 100 ms hamming window. The snoring episodes so detected were interpreted using SIs, where SI represents the frequency of snoring episodes. The SI, which can be determined heuristically and demonstrates the incidence of snoring within a predetermined interval, was calculated as the number of snoring events occurring within 10 seconds. Snoring induces vibrations of the skin surface in the neck area. A piezo-electric sensor can measure not only snoring vibrations, but also non-snoring vibrations related with breathing, body movements, and coughing during sleep. All non-snoring events were considered as normal breathing and thus, rejected in the elimination process.
Feature extraction
Features used for classification of OSA were extracted from the PRV analysis. The PRV signal was identified with a piezo-electric sensor to extract temporal and spectral domain features. The pulse rate was obtained by detecting the pulse waves originating from the carotid artery using the piezo-electric sensor attached to the neck. For recognizing the PRV signals, we used a self-developed, sensor-customized algorithm based on an autocorrelation method to detect the heartbeat peaks (Fig. 3). The pulse rate was calculated from the pulse-to-pulse interval (PP), and an unequal time interval signal was adjusted to an equal interval signal via linear interpolation. The adjusted pulse rate signal was resampled at 4 Hz to analyze the extracted features in both the time and frequency domains. These features were extracted from the resampled pulse rate signal using a length of 2 minutes and a hamming window with 25% overlapping. In the time domain, we calculated the PP, its standard deviation (SDPP) and the root mean square of successive differences (rMSSD). In the frequency domain, we extracted the low-frequency power (LF) range (0.04–0.15 Hz), high-frequency (HF) power range (0.15–0.40 Hz), and LF/HF ratio. These features reflect the short-term HRV and parasympathetic nerve activity, and are known to be associated with sleep-disordered breathing. The values of PP, SDPP, and rMSSD increased during OSA; however, there was no significant difference between normal breathing and OSA. LF, HF, and LF/HF ratio decreased during OSA, also with no significant differences between normal and OSA regions (Table 2). To classify an OSA event, an SVM was used as a classifier in this study.
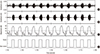
 | Fig. 3Heartbeat detection process. (A) Piezo-electric sensor signal. (B) Filtered signal (+) in signal shows detected peak point. (C) Reference ECG signal.
ECG = electrocardiogram.
|
Table 2
Statistical values of the features from the PRV analysis

Data are shown as mean ± SD.
G1 = mild (AHI > 5), G2 = moderate (AHI > 15), G3 = severe (AHI > 30), AHI = apnea-hypopnea index, PRV = pulse rate variability, OSA = obstructive sleep apnea, PP = pulse-to-pulse interval, SDPP = standard deviation of the pulse-to-pulse interval, rMSSD = root mean square of successive differences, LF = low-frequency, HF = high-frequency, SD = standard deviation.
![]()
OSA classification
Before classification, the SI was used to distinguish between normal and OSA suspected regions. Next, the OSA suspected region was analyzed via SVM using temporal and spectral features (Fig. 1). Finally, OSA was classified using an SVM. The aim of SVM is to determine an optimal separating hyperplane that shows the maximum margin between the apneic and non-apneic segments. First, the input data was transformed into a higher dimensional space by employing a kernel function, and then a linear optimal hyperplane was constructed between normal and OSA classes in the transformed space. These data vectors nearest to the constructed line in the transformed space are called support vectors. In this study, we applied a single binary SVM classifier with a radial basis function employed as the kernel function. The multiplier coefficient α and regularization parameter C were determined empirically (C = 1; α = 0.5). The extracted parameters of the PRV time series were used as input features in the SVM, and the output types were represented as follows: −1 = Normal and +1 = OSA. Then, the number of automatically detected apneic events was counted (per hour of recording) and compared with standard cutoffs (5, 15, and 30 events/hr) to designate the recording as a mild, moderate, or severe group. All SVMs were trained and tested on the SVM toolbox of MATLAB (Mathworks Inc.).
Data analysis
To test the performance of the proposed method, we used the piezo-electric signals from the sleep recordings of the 45 patients suffering from OSA (Table 1). These patients were divided into 3 groups based on the severity of the regular apnea to validate the classification ability of the proposed algorithm. We used OSA and snoring footnotes of the PSG, while the pulse rates from the piezo-electric sensor were confirmed using reference ECGs in the PSG recordings. A cross-validation was performed to evaluate the proposed method for each patient group.
Five characteristics, namely, accuracy, sensitivity, specificity, positive predictive value, and kappa value were calculated to assess the performance of the proposed method. Accuracy indicates the overall detection accuracy, sensitivity is interpreted as the ability of the algorithm to accurately classify OSA, and specificity indicates its ability to not generate a false negative (normal breathing). The kappa coefficient (κ) (17) was used to evaluate the agreement between the estimated apnea-hypopnea index (AHI) level of the proposed method and annotated AHI of the clinical diagnosis of PSG. The Kruskal-Wallis test was performed for comparing patient groups. P < 0.01 was accepted as significant.
RESULTS
We have obtained 3 major results through this study. First, the result of automatic snoring detection is presented in Table 3. The total mean sensitivity, specificity, and accuracy are determined as 88.5%, 96.1%, and 95.6%, respectively. The mean sensitivity, specificity, and accuracy are 81.8%, 96.5%, and 95.6%; 94.2%, 95.9%, and 96.0%; and 89.5%, 95.9%, and 95.4% for groups with mild, moderate, and severe OSA, respectively. The above values reflect that there is no significant difference in these parameters for OSA detection in the 3 subject groups. This is indicative of the stability and reliability of the snoring detection algorithm. In addition, we report the heartbeat detection results of the proposed algorithm in Table 4. It shows that the mean sensitivity and positive predictive value for all subjects is 94.3% and 87.1%, respectively. The average sensitivity and positive predictive value are 93.1% and 86.8% for the mild; 94.4% and 85.7% for the moderate; and 94.3% and 90.2% for severe OSA groups, respectively. The results exhibit that there is no significant difference in the sensitivity and positive predictive value of the algorithm for the 3 subject groups.
Table 3
Results of snoring detection

![]()
Table 4
Results of heartbeat detection

![]()
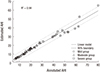
Finally, we classified OSA using an SVM. The performance of leave-one-out cross-validation tests based on specific characteristics for the classification (overall accuracy, sensitivity, and specificity) is summarized in Table 5. The total mean sensitivity, specificity, and accuracy are 74.5%, 76.4%, and 74.3%, respectively. The mean sensitivity, specificity, and accuracy are 72.5%, 74.2%, and 71.5%; 85.8%, 80.5%, and 80.0%; and 70.3%, 77.1%, and 71.9% for the mild, moderate, and severe OSA groups, respectively. Furthermore, in order to estimate the severity of apnea for each individual, we counted the AHI manually and compared with that of the annotated AHI obtained from PSG. Fig. 4 shows the Bland-Altman plot of the estimated and AHI value. The correlation ratio between the 2 quantities values is found to be 0.94 (P < 0.001). The normalized mean and standard deviation values are 26.83 and 18.77, respectively, and only 5 of 45 subjects were outside the 95% confidence interval (CI) as expected statistically.
Table 5
Results of OSA detection

Data are shown as mean ± SD.
AHI = apnea-hypopnea index, OSA = obstructive sleep apnea, SD = standard deviation.
![]()
DISCUSSION
In this study, we investigated the feasibility of the OSA classification method using a piezo-electric sensor-based SI and features obtained via PRV analysis. The performance test of the piezo-electric sensor resulted in a mean sensitivity of 85.8%, specificity of 80.5% and accuracy of 80.0% for the group with moderate sleep apnea, demonstrating the usefulness of the piezo-electric sensor for OSA classification and screening.
Several methods have been presented to detect OSA by analyzing snoring, the hallmark symptom of OSA. Most studies analyzing snoring sounds used snoring signals recorded through high-performance microphones attached to different regions of the neck of the subject (Table 6). Solà-Soler (18) investigated the association between snoring and OSA by analyzing the intensity and frequency of the OSA. Nakano (20) reported that OSA screening based on snoring sound analysis using a high-performance microphone had a higher sensitivity and specificity compared with the method using blood SpO2 levels. Azarbarzin and Moussavi (19) classified OSA by applying various features of the tracheal snoring sound to a machine-learning algorithm (9). In these studies, a microphone was attached to the neck of each subject to reduce background noise during sleep. Additionally, they employed a high-performance microphone to permit detailed snoring analysis, which was costly and time consuming. The piezo-electric sensor used in this study is cost effective and relatively simple for detecting snoring. The piezo-electric sensor was not influenced by ambient noise, because of which our snoring detection results (Table 3) are found to be better and similar to the results of previous studies (1314).
Table 6
Comparison between the proposed method and previous studies

| Authors | Subjects | Sensor location | Method | Sensitivity/specificity (AHIPSG threshold) | |||
|---|---|---|---|---|---|---|---|
| 5 | 10 | 15 | 20 | ||||
| Nakano et al. (20) | 383 | Tracheal microphone | Disturbance index and ODI | 96/76 | - | 79/95 | - |
| Solà-Soler et al. (18) | 16 | Tracheal microphone | Mean, SD, and density of pitch | - | 64.4/58.5 | 82/81 | 82/81 |
| Azarbarzin and Moussavi (19) | 57 | Tracheal microphone | TV norm of Fp and ZCR | 74/82 | 83/91 | 85/96 | 92/98 |
| Our method | 45 | Tracheal piezo snoring sensor | Snore index, PRV | 73/74 | - | 86/81 | 70/77 |
AHI = apnea-hypopnea index, PSG = polysomnography, ODI = oxygen desaturation index, SD = standard deviation, ZCR = zero-crossing rate, PRV = pulse rate variability.
![]()
The primary advantage of our method is that a piezo-electric sensor can simultaneously measure snoring and heartbeat. Features extracted from 2 biological signals were used for OSA classification using an SVM and the performance was higher or comparable with previous studies. It showed our method could be a possible tool for OSA diagnosis. In particular, the rMSSD and HF features played an important role in accurate classification.
The Bland-Altman test revealed that only 5 subjects out of 45 were outside of the 95% CI. These 5 subjects had high BMI values (53.1, 59.1, 62.2, 63.2, and 79.6), which imply that the heartbeat quality degrades because of a high concentration of fat and tissue around the neck. Three groups were classified as mild, moderate, and severe OSA based on the estimated AHI and best detection rate of OSA. The latter, which is found to be > 80%, was obtained for the moderate group as shown in Table 5. This was a result of the high-accuracy snoring and heartbeat detection in that group. Furthermore, our method was evaluated by the correlation between the estimated AHI values with annotated AHI obtained from PSG and it showed a high correlation (0.94, P < 0.001) between the 2 parameters.
Our proposed method also has some limitations. First, the connection of the piezo-electric sensor to the necks of the subjects may result in inconvenience and discomfort during sleep. Second, the data obtained in a lab setting may be qualitatively and spatially different from that obtained in a state of natural and comfortable sleep. Third, any cardiac abnormalities were excluded in our study, so that the proposed algorithm may not be as good if the subject suffers from certain types of cardiac abnormalities, in particular, arrhythmias. Fourth, central and mixed types of OSA are excluded. With an improved algorithm and piezo-electric sensor, OSA can be divided into different types of apnea. Fifth, it is assumed that all patients with OSA snore, so that if a patient does not snore then it would lead to an underestimation of the AHI. Finally, this study was not performed on a large population size or on the usage of the optimized piezo-electric sensor because we focused on the possibility and potential of sleep apnea monitoring using a piezo-electric sensor in this study. These issues will be addressed in a follow-up study.
Finally, our results showed the potential for OSA classification using a piezo-electric sensor. Thus, the proposed method may be considered as a reliable tool for screening the OSA level of a subject.
 XML Download