

 PDF
PDF ePub
ePub Citation
 Print
Print


INTRODUCTION
Diabetic neuropathies are neuroendocrine disorders related to chronic hyperglycemia, affecting nerve fibers of the body part in approximately half of all diabetes patients (12). The condition of insulin secretory function, insulin sensitivity, insulin resistance (IR), and subsequent hyperinsulinism play a vital role in the pathogenesis of the diabetic complication and the development of type 2 diabetes mellitus (T2DM) (34). Multifactorial interventions, dyslipidemia management including strict glycemic control are known to diminish the progression but cannot remove the risk of cardiac autonomic neuropathy (CAN) in patients with T2DM (567). High levels of plasma triglycerides (TGs) are a risk marker for cardiovascular disease (CVD), and it has often been related to impaired fasting glucose, T2DM, and diabetic complication (8910). Thus, much stress had been placed on controlling hyperglycemia along with hypertension and hyperlipidemia to prevent and delay the onset of diabetic complications (11). Recently, the triglyceride glucose index (TyG index), has been suggested in several studies as a simple assessment method for metabolic abnormality (121314). This index is the mathematical product of the fasting blood glucose and TG levels, which correlates with the degree of IR (15).
Recently a report revealed that dyslipidemia and hyperglycemia contribute to the development of CAN (16). However, data on the direct relationship between indices and peripheral neuropathy in T2DM are lacking, and there is no comparative study regarding IR indices among patients with CAN and T2DM. The majority of studies on the prevalence and associated risk factors of CAN are executed in Western countries in the past.
To the best of our knowledge, none of the previously published studies investigated the TyG index on the presence of CAN with regard to T2DM in Indian population. In this study, we aimed to assess the role of IR indices like TyG index in the development of CAN along with the prevalence of CAN in Indian T2DM patients.
MATERIALS AND METHODS
Study design
It was a prevalence study conducted in a tertiary care setting hospital of Jamia Hamdard. This investigation included 202 patients treated in May 2015 to November 2016. Based on Ewing autonomic function test and symptoms, the patients were divided into 2 groups. The first group of 62 subjects consisted of T2DM patients with CAN and was considered as CAN patients group while the other group consisted of 140 T2DM patients without CAN and was considered as non-CAN patients group and 9 patients withdrew from the study due to medical expenses. The study was conducted in the department of medicine, with both outdoor and indoor patients and patients attending the Hakeem Abdul Hameed Centenary Hospital (HAHC) associated with Hamdard Institute of Medical Sciences and Research, Jamia Hamdard (HIMSR). Included subjects were of either sex, above 18 years of age, and had the diagnosis of T2DM. Exclusion criteria were heart failure, urinary tract infection, fever, cirrhosis of liver, and prostatitis. Patients were asked to avoid smoking, consumption of coffee, and tea before assessment. All patients had a complete history of neurological symptoms using a semi-structured questionnaire which was documented. Symptoms like numbness, asleep feeling, burning sensation, deep aching, unsteadiness in walking, unexplained resting tachycardia, postural fainting, orthostatic hypotension, sweating, ejaculation problems, and other symptoms documented in previous literature were considered for neuropathy symptoms. Manometer, handgrip dynamometer, mouth piece, and electrocardiography (ECG) machine were used during the autonomic function test.
Clinical feature measurement
Blood pressure (BP) of the participants was measured at the time of recruitment in the sitting position in the right arm by sphygmomanometer (Diamond Deluxe BP apparatus; BP Instruments, Pune, India). Body weight was measured on the same scales in light clothing and no shoes before breakfast, and upright height was measured on the same wall-mounted stadiometer. Individual body mass index (BMI) was then calculated as weight (kg)/height (m2). The right-arm BP of each seated subject was obtained after 10 minutes of rest using a sphygmomanometer. A brief prescription detail, ongoing medication, and medical history were recorded for all subjects. A thorough general and physical examination including the vital data was done for all the subjects. Blood was collected in a fasting state for plasma glucose, glycated haemoglobin (HbA1c), lipid profile, and another clinical variable. Quantitative estimation of HbA1c was done by using high performance liquid chromatography (HPLC). Retinal conditions were assessed by ophthalmologists using a combination of clinical examination.
Neuropathy assessment
Neuropathy testing was performed by the experienced physician and technician according to standardized procedures. Neuropathy was assessed using monofilament, pinprick sensations, ankle reflexes, and vibration perception threshold (VPT) test. Quantification of peripheral neuropathy was assessed by VPT using a Biothesiometer (Proactive Health Inc, Ahmedabad, Gujarat, India) by a single observer for all the participants. VPT was then measured at 5 different locations on the both legs. Monofilament of 10 g is a simple instrument that is used frequently in assessing the loss of protective sensation. It is adjusted in such a way that it takes 10 g of force to buckle. During this test the monofilament was placed perpendicular to the skin site of each foot in such a way that it would not slip and pressure was applied to the filament just buckled with a contact time of 2 seconds. Inability to perceive the sensation felt at any one site of each leg was considered loss of protective sensation. In addition, ankle reflexes were also assessed with a percussion hammer, and recorded as either present or absent. All tests were conducted on a quiet workbench.
Autonomic function test
Ewings autonomic function test was performed to confirm the diagnosis of CAN. Out of 5 autonomic function tests, 3 of these measurements mainly assessed parasympathetic function heart rate responses to deep breathing (beat-to-beat variation), to standing (30:15 ratio), and to the Valsalva manoeuvre. Sympathetic function was assessed by BP response during posture change and handgrip test (17).
Deep breathing test
The patient laid quietly and breathed deeply at a rate of 6 breaths (expiration and inspiration) per minute and heart rate along with the time elapsing between 2 consecutive R waves in the electrocardiogram (R-R interval) was recorded by ECG. The ratio of R-R interval during expiration and inspiration was considered as E:I ratio. The result was then expressed as the mean of the difference between maximum and minimum heart rates for the 6 measured cycles in beats/minute and considered as abnormal response if it is < 10 beats/minute.
Heart rate response to standing
The patient laid quietly and stood up unaided; the heart rate was recorded continuously by ECG. The ‘30:15 ratio,’ which is the ratio of the longest R-R interval (around the 30th beat after starting to stand up) to the shortest R-R interval (around the 15th beat), was then calculated and considered as normal if 30:15 ratio was above 1.04.
Valsalva manoeuvre
The patient forcibly exhales into the mouthpiece of a manometer, exerting a pressure of 40 mmHg for 15 seconds. ECG was recorded continuously in supine position in during the whole process. The longest and shortest R-R intervals were measured. The mean of 3 Valsalva ratios taken as the final value and considered as normal if the Valsalva ratio above than 1.20
Sympathetic function test
BP response to standing
BP was measured while the patients were active in standing position and again when in a supine position. The postural fall in BP was taken as the difference between systolic BP lying and just after standing.
BP response to handgrip test
It consists of variation in BP during handgrip test. After instructions in using handgrip dynamometer, the subject gripped maximally with his dominant arm for 5 minutes, this was repeated thrice. The highest of the 3 readings is called maximum voluntary contraction (MVC) and considered as abnormal if diastolic blood pressure (DBP) < 10 mmHg.
Patients were classified as CAN positive if any of the above-mentioned tests found abnormalities. Further, CAN patients were classified as the early CAN if 1 of 3 heart rate tests were abnormal, definite CAN if 2 heart rate tests were abnormal and severe CAN if 2 heart rate tests were abnormal + 1 or both BP tests were abnormal (1718). Later during analysis process non-CAN were specified as stage 0, early CAN as stage 1, definite CAN as stage 2, and severe CAN as stage 3.
Statistical analysis
The study variables contained both categorical and continuous variables. Frequencies with proportions were represented the categorical variables and scale variables as mean ± standard deviation (SD). All continous variables were tested for normality using the Shapiro-Wilks test. Categorical variables and continuous variable were compared using the χ2 test and Student's t-test. Kaplan-Meier survival curves were plotted to assess the time taken for CAN development and compared using the log-rank test. The 2-sided critical region with P ≤ 0.05 was considered as statistical significance. All analysis was performed using SPSS ver. 21.0 statistical software (IBM Corp., Armonk, NY, USA).
Ethics statement
The study was conducted in compliance with the declaration of Helsinki and approved by Institutional Review Board (IRB-Approval number-JHIEC-2015(05/15), inform consent: present) of Jamia Hamdard, Hamdard University, New Delhi, India. Written informed consent was obtained from each patient prior to inclusion in the study and for using their health-related data.
RESULTS
Characteristics of participants
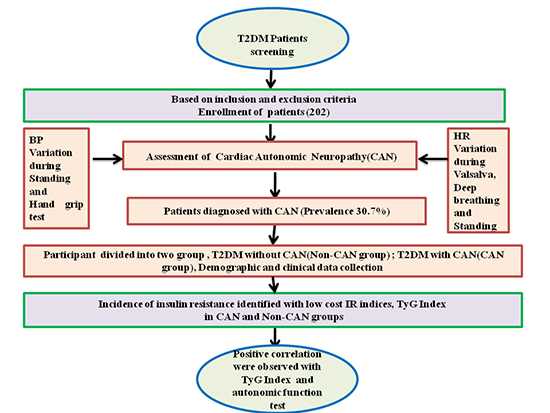
In total, 362 subjects diagnosed with T2DM visited the study centre. A total of 202 patients aged 18–80 (range) years who fulfilled the inclusion criteria were enrolled. The flow diagram of participant inclusion is shown in Fig 1. Comparison of baseline data of the non-CAN and the CAN patients group are shown in Table 1. Demographic and clinical data were collected as follows: age, gender, systolic blood pressure (SBP), DBP, weight, height, and BMI. Weight and height were measured by balance beam scale and tape measure. The mean BMI, SBP, DBP, TG, cholesterol, and fasting blood glucose levels were significantly higher in the CAN patients group (P < 0.001). According to autonomic function test results 140 patients (69.30%) out of 202 T2DM patients had 2 scores and categorized as T2DM without CAN, 7 patients (11.29%) out of 62 had 4 scores, were considering as early CAN while 24 (38.70%) out of 62 were considered definite and 31 (50%) patients out of 62 had more than 5 scores which were categorized as the severe CAN. Over all prevalence of CAN was 30.7% (62 cases), however, it was less than earlier prevalence report conducted in India (19). We also assessed the neuropathy condition in the patients by various tests including monofilament and VPT. Based on cut-off range of Biothesiometer (Proactive Health Inc), score of monofilament test and other symptoms, there were 29 patients in the CAN who had diabetic peripheral neuropathy (DPN) simultaneously. Out of these DPN patients in CAN, one was diagnosed with diabetic foot. Further more, we found that prevalence of microvascular complication (retinopathy, nephropathy, and DPN) in CAN was significantly higher with respect to non-CAN patients group. In addition, TyG index levels did not differ significantly depending on the presence or absence of DPN (TyG index in DPN it was 10.12 vs. 9.79, P = 0.06, in CAN and non-CAN, respectively). Variation in heart rate during deep breathing (HRD), heart rate variation during standing (HRS), BP variation during posture change and BP variation in the hand grip test were statistically significant when compared to non-CAN with CAN patients group as shown in Table 2. There was a significant difference in medication modalities (insulin, oral hypoglycemic agent, and angiotensin-converting enzyme inhibitor [ACEI]/angiotensin receptor blocker [ARB] intake) among CAN patients and T2DM patients group. Smoking habit was obtained by questionnaire and patients were divided into smokers (present or former) and non-smokers. Out of 202 patients, 67 patients were smokers. Smoking was significantly associated with CAN (P < 0.001). The SBP and DBP was significantly (P < 0.001) associated with CAN.
 | Fig. 1Flow chart showing the study participants.
T2DM = type 2 diabetes mellitus, OPD = outpatient department.
|
Table 1
Clinical and laboratory profiles of all subjects
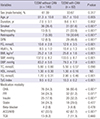
Values are mean ± SD or number (%). Data was analyzed using student's t-test.
T2DM = type 2 diabetes mellitus, CAN = cardiac autonomic neuropathy, DPN = diabetic peripheral neuropathy, FG = fasting glucose, HbA1c = glycated haemoglobin, BMI = body mass index, SBP = systolic blood pressure, DBP = diastolic blood pressure, TC = total cholesterol, HDL = high-density lipoprotein, TG = triglyceride, TyG = triglyceride glucose, OHA = oral hypoglycemic agent, PPI = proton pump inhibitor, ACEI = angiotensin-converting enzyme inhibitor, ARB = angiotensin receptor blocker, TCA = tricyclic antidepressant, NS = not significant, SD = standard deviation.
*Intergroup P value were analyzed by χ2 test.
![]()
Table 2
Autonomic function tests in patients with CAN and non-CAN
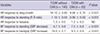
Significance level, P < 0.05.
CAN = cardiac autonomic neuropathy, T2DM = type 2 diabetes mellitus, HR = heart rate, BP = blood pressure, SBP = systolic blood pressure, DBP = diastolic blood pressure, NS = not significant.
![]()
Association of BMI, age, duration, and gender
Mean BMI in our study was found 25.8 ± 1.6 kg/m2, 25.2 ± 1.8 kg/m2 in CAN and non-CAN patients group, respectively. The mean age of subjects was 55.7 ± 10.0 and 51.3 ± 10.2 years in CAN and non-CAN patients group, respectively. Further, we found 3.2% (2 of 62) CAN patients were below 40 years, 22.58% (14 of 62) CAN patients were between 40–49 years of age group, 27.40% (17 of 62) CAN patients were between 50–59 years of age group, 38.70% (24 of 62) CAN patients were between 60–69 years of age group and 8.06% (2 of 62) CAN patients were ≥ 70 years of age group. Diabetes duration appeared to be longer in those with CAN group. Forty-three point five four percent (27 of 62) CAN patients were ≤ 5 years of duration of T2DM, 35.48% (22 of 62) CAN patients were in the range of 6–10 years of duration of T2DM, 16.12% (10 of 62) CAN patients were in the range of 11–15 years of duration of T2DM and 4.8% (3 out of 62) CAN patients were ≥ 15 years of duration of T2DM. Comparison of mean age at diagnosis of diabetes and duration took for the CAN development made. No significant differences were observed either of sex. Kaplan-Meier analysis (Fig. 2) were plotted to support the previous result as shown in Table 3. Prevalence of CAN in the female patients was found approximately 2 fold than male.
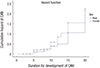 | Fig. 2Kaplan-Meier curves for the period from diagnosis of T2DM to the establishment of CAN in men and women.
T2DM = type 2 diabetes mellitus, CAN = cardiac autonomic neuropathy.
|
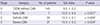
Table 3
Sex differences in the age at diagnosis of T2DM (non-CAN) and time gap for CAN development

The duration taken for the development of CAN (years). It was calculated by subtracting the age at diagnosis of T2DM (non-CAN) from the age at diagnosis of CAN. Data presented as mean ± SD.
T2DM = type 2 diabetes mellitus, CAN = cardiac autonomic neuropathy, SD = standard deviation.
![]()
Association of TyG Index with autonomic neuropathy
As demonstrated in Table 1, the TyG index was significantly correlated with CAN (P < 0.001). The mean ± SD for TyG was 10.3 ± 0.2 and 9.5 ± 0.2 in CAN and non-CAN patients, respectively. The difference of TyG index, in CAN and non-CAN patients group was highly significant (P < 0.001). Furthermore, we also find any correlation between TyG index and types of CAN. A significant difference was observed when TyG index of early, definite and severe CAN was compared with T2DM group separately (Table 4).
Table 4
The relation of TyG index to category of CAN
| Stage | Category | No. of patients | TyG index | P value |
|---|---|---|---|---|
| 0 | T2DM without CAN | 140 | 9.5 ± 0.2 | - |
| 1 | Early CAN | 7 | 10.2 ± 0.4 | < 0.031* |
| 2 | Definite CAN | 24 | 10.3 ± 0.1 | < 0.049† |
| 3 | Severe CAN | 31 | 10.3 ± 0.3 | < 0.034‡ |
T2DM with CAN specified as stage 0, T2DM with early CAN as stage 1, T2DM with definite CAN were specified as stage 2, T2DM with severe CAN as stage 3.
TyG = triglyceride glucose, CAN = cardiac autonomic neuropathy, T2DM = type 2 diabetes mellitus.
*P, stage 1 vs. stage 0; †P, stage 2 vs. stage 0; ‡P, stage 3 vs. stage 0.
![]()
Pearson's correlation analysis
A significant association was found between autonomic function parameter and clinical variables (Table 5). The TyG index shows significant correlation with autonomic function test (P < 0.001). Similarly, age factor found to be positively associated with BP variation during the hand grip test. Further, we found that deep breathing also significantly associated with BP variation during posture change.
Table 5
Univariate correlation between cardiac autonomic function tests and TyG index in patients

Correlation result with autonomic function test.
TyG = triglyceride glucose, HRD = heart rate during deep breathing, HRS = heart rate variation during standing, BPS = blood pressure standing, BPH = blood pressure handgrip.
![]()
Multivariate regression analysis
Results of multivariate linear regression are shown in Supplementary Table 1 and expressed after adjustment with other variable as standardized coefficient β and P value. The TyG index (continuous variable) of the participants as independent risk factor was significantly associated with CAN (β = 0.389; P = 0.005). The autonomic function test like heart rate response to standing (continuous variable) of the participants showed a slightly significant association with CAN (β = −0.236; P = 0.061). Furthermore, retinopathy (categorical variable) of the participants showed a significant association with CAN (β = −0.310; P = 0.025).
DISCUSSION
We investigated whether TyG index is associated with CAN in patients with T2DM. The novel insight of the present study shows that TyG index is potentially elevated in CAN with respect to non-CAN patients group. Our study report shows that there is a significant difference in the TyG index in CAN and non-CAN patients group. In this study, we also found that TyG index significantly increases in early, definite and severe CAN with respect to non-CAN patients group. The results from this study suggest that product of fasting glucose and TG has a significant association with the CAN patients group. Although the pathophysiology regarding the role of IR in diabetic neuropathy is complex, mitochondrial dysfunction has been stated to play a pivotal role in the pathology of IR (20). In addition to that, one of the investigations reported that diabetic parasympathetic neuropathy affects the IR in type 2 diabetic patients (21). It has the potential to be a simple clinical marker of the metabolic syndrome. The finding of the present study could be interesting in search for a sensitive biomarker for diabetic neuropathy and a low-cost IR index (TyG index) may play a vital role in predicting the disease course. Further, we found that there was a significant difference in medication modalities (insulin, oral hypoglycemic agent, and ACEI/ARB intake) among CAN and non-CAN patients group.
Hyperlipidemia develops in the course of diabetes mellitus, and the late development of an abnormal lipid profile coincides with the delayed encounter and progression of diabetic neuropathy (2223). IR has been observed as a pathogenic component in diabetic neuropathy for a decade. Longitudinal Rochester Study also supports the role of IR in diabetic neuropathy (24). One of the experimental studies also revealed that insulin deficiency is a major component in the diabetic neuropathy due to neurotrophic effects of insulin (25). Earlier investigational reports suggest that age, duration of diabetes, and metabolic control has a significant association with CAN progression (2627). Our study also suggests that age and duration of diabetes was strongly associated with CAN. The results showed that the prevalence of CAN was 30.7% however this was lesser as reported in previous study conducted in India (19). Variation in prevalence widely seen in such type of study, which may be due to population studied, types of diabetes and methodology followed for assessment. The levels of HbA1c, high blood glucose were relatively high among CAN and non-CAN patients group in our study because of patients with long standing diabetes. The incidence of development of retinopathy, nephropathy, and peripheral neuropathy (Triopathy) was relatively high among the CAN patients group. Findings of earlier investigations suggest the high percentage of nephropathy, peripheral neuropathy, retinopathy were found in the study population (2728). In our study, there was no significant difference in the incidence of the development of insulin resistant among the different patterns of CAN. In addition to that, no significant differences were observed among the CAN with or without presence of other micro vascular complication.
Furthermore, we performed the Pearson's correlation analysis and multivariate linear regression analysis which suggest the positive correlation of TyG index with autonomic function parameter. In addition to that, in our study, besides the CAN evaluation parameter, age, duration was also independently and significantly a risk factor for cardiovascular risk in autonomic neuropathy. TyG index, a measure of IR was found to be independently and significantly associated with autonomic neuropathy. Previous reports also revealed the high IR indices, age, and other clinical risk factor levels among autonomic neuropathy and diabetes mellitus (222829).
Screening parameters specific to nerve related dysfunction in T2DM are not studied much. Limited literature data to autonomic neuropathy are available where the emphasis on an alternative tool for CAN diagnosis was investigated.
The predicting ability of TyG index has been studied in various metabolic disorders. This association between atherogenic lipoprotein abnormalities and the development of diabetes was described earlier, which reported that changes in the TyG index over time altered the incidence and risk of diabetes (30). Due to variation in ethnicity and other factors for determining cut-off range of TyG index (31), we have set a cut-off point for TyG index for diabetes risk (TyG index 9) after observing the variation of TyG index in non-CAN and CAN patient groups (32). However, the TyG index was more than the cut point in all T2DM and CAN group. TyG index in the various category of CAN group was significantly high in comparison to T2DM group. However, no significant difference in TyG index was observed when compared to either sex in the patients cohort.
Various prospective studies have reported that IR predicts incident cardiac disease in both the general and diabetic subjects (33343536). The TyG index has been proposed as a surrogate of IR, in the hyperinsulinemic-euglycemic clamp test and with the homeostasis model assessment of insulin resistance (HOMA-IR) (37). The utility of the TyG index to early identify individuals at risk of diabetes was well described in the past (38). Hence in the present study, we have explored the association of TyG index in CAN.
The ominous impact of long-term poor glycemic control on the development and progression of CAN is now generally accepted. One of the studies has revealed that fasting TGs is significantly associated with diabetic neuropathy (39). The prevalence of hypertriglyceridemia has increased and become a major concern with a growing population with obesity, metabolic syndrome, and T2DM. The previous study has been done with limited sample size focussed on the IR and metabolic disorder including CAN (3240). In these circumstances TyG index, is a low-cost alternative that may be a more suitable clinical marker for the diabetes-related metabolic disorder.
Apart from the enthusiastic result, there are some limitations of the present study. It is very difficult to establish the causative relation between CAN and TyG index due to insufficient data as we could not collect the insulin secretion, food habit, and energy consumption. We could not go through plasma catecholamine or its metabolite for assessing sympathetic autonomic activity.
Despite limitations, the present study demonstrates that TyG index is significantly associated with CAN patients. Our study result revealed that TyG index significantly increased in CAN patients. TyG index has potential impact in neuropathy condition of T2DM patients. Further investigation of TyG index in a larger T2DM population may have a great impact in developing the clinical biomarker for diagnosis and disease progression of CAN.
 XML Download