

 PDF
PDF ePub
ePub Citation
 Print
Print


INTRODUCTION
Mammalian target of rapamycin (mTOR) inhibitors are potently active against a wide variety of cancers. mTOR inhibitors could be useful in treatment of urothelial carcinoma (UC) of the bladder, since the inhibitors reduce cell viability in various cancer-derived cell lines and in a mouse model of UC of the bladder (123). We previously demonstrated that 2 mTOR downstream genes, p70S6K and elF4E, are involved in the regulation of cell proliferation to a similar extent, and inhibition of cells using a high dose of the mTOR inhibitor rapamycin effectively prevents in vitro and in vivo cellular growth in high-grade (HG)-UC of the bladder (45). We also reported that activation downstream of the mTOR pathway through phosphorylation by p70S6 kinase is related to high recurrence and progression in non-muscle invasive UC of the bladder (456). Despite such promising preclinical observations, clinical trials with mTOR inhibitors have proven disappointing (78). This might be due to cross-talk in the mTOR pathway leading to multiple sites of regulation and diverse genetic aberrations that activate the pathway.
Our aim was to identify downstream genes of the mTOR pathway that are transcriptionally altered due to mTOR pathway inhibition in UC cells using RNA interference (RNAi) and small molecule inhibitors. p70S6K and elF4E were knocked-down using 3 different small interfering RNAs (siRNAs) in 2 HG-UC cell lines (5637 and T24) that feature marked amplification and overexpression of downstream genes of the mTOR pathway, and since rapamycin targets the mTOR pathway. The downstream genes of the mTOR pathway identified in this study could be candidate targets for drug therapy that could overcome mTOR pathway cross-talk in non-muscle invasive HG-UC of the bladder.
MATERIALS AND METHODS
Cell cultures and reagents
Human HG-UC cell lines 5637 and T24 were purchased from the American Type Culture Collection (Manassas, VA, USA). Rapamycin was purchased from Sigma-Aldrich (St. Louis, MO, USA). Antibodies to p70 S6 kinase (gene name; RPS6KB1), phosphorylated-p70 S6 kinase (p-p70 S6 kinase, Ser371), eIF4E, phosphorylated-eIF4E (Ser209), and β-actin were purchased from Cell Signaling Technologies (Beverley, MA, USA). Antibody to ATP7A was purchased from Abcam (Cambridge, MA, USA). For generation of stable knockdown cell lines, plasmid ATP7A short-hairpin RNA (shRNA) constructs and a non-targeting shRNA control were purchased from Sigma-Aldrich. HG-UC 5637 cell line was transfected with either 5 μg of ATP7A shRNA plasmid DNA using Lipofectamine® 2000 (Invitrogen; Thermo Fisher Scientific Inc., Waltham, MA, USA) according to the manufacturer's instructions. Puromycin (0.1–1.0 μg/mL) was initiated 2 days after shRNA transfection.
Cell viability analysis
Human HG-UC ATP7A knockdown 5637 cell lines were plated in 96-well plates in complete medium and treated with various concentrations of rapamycin. After 48 hours, cell viability was analyzed using the 3-(4,5-dimethylthiazol-2-yl)-2,5-diphenyltetrazolium bromide (MTT) assay according to the manufacturer's instructions (Sigma-Aldrich).
Wound-healing migration assay
This assay was performed using the Cytoselect Wound Healing kit (Cell Biolabs, Inc., San Diego, CA, USA) according to the manufacturer's instructions. Cells of ATP7A knockdown and non-targeting shRNA control 5637 cell lines were plated in wells of a 6-well plate and incubated overnight to allow formation of a monolayer. The inserted wells were removed to create a wound field of 0.9 mm diameter. After washing, the cells were treated with 1 µM rapamycin and then incubated for 48 hours. The extent of wound closure was determined and photographed with a Zeiss 8 Axiovert 200M live cell microscope.
Invasion assay
The cell invasion assay was performed with BioCoat™ Matrigel® Invasion Chambers 24-well plate (Corning Inc., Corning, NY, USA) according to the manufacturer's instructions. Briefly, the lower chambers contained 600 µL medium. ATP7A knockdown or non-targeting shRNA control 5637 cells were seeded in the upper chamber with 300 µL medium alone or medium containing 1 µM rapamycin. After 48 hours' incubation, non-invasive cells were removed from the upper chamber, and the adhered cells in the lower chamber were fixed in 4% paraformaldehyde for 20 minutes, stained with hematoxylin and enumerated using an upright microscope.
Western blot analysis
Cells were washed with ice-cold phosphate-buffered saline and trypsinized prior to the addition of lysis buffer (iNtRON Biotechnology, Seoul, Korea). The lysates were stored at −20°C until analysis. The amount of protein was quantified by the Bradford assay (Bio-Rad, Hercules, CA, USA). Equal amounts of protein were loaded onto Readygels (4%–20% Tris-HCL; Bio-Rad), and electrophoresis was performed according to the manufacturer's instructions. Proteins were blotted onto polyvinylidene fluoride membranes (Invitrogen) and incubated for 1 hour at room temperature in 5% skim milk to blocking each membrane. Blots were incubated with primary antibody overnight at 4°C and with horseradish peroxidase-conjugated secondary antibody for 1 hour at room temperature. The membranes were developed using enhanced chemiluminescence.
siRNA transfection
p70S6K siRNA (ID#: 6566, sense strand: 5′-GUGCCAAUCAGGUCUUUCU-3′, antisense strand: 5′-AGAAAGACCUGAUUGGCAC-3′) and eIF4E siRNA (ID#: 6311, sense strand: 5′-GGAUGGUAUUGAGCCUAUG-3′, antisense strand: 5′-CAUAGGCUCAAUACCAUCC-3′) were purchased from Cell Signaling Technologies. S6K siRNA (ID#: sc92312, sense strand 5′-CCUUCAACCACUAUCAGAAUU-3′, antisense strand: 5′-UUCUGAUAGUGGUUGAAGGUU-3′) were from Santa Cruz Biotechnology (Santa Cruz, CA, USA). Transient transfection of 5637 and T24 cells was performed using Lipofectamine® 2000 reagent (Invitrogen) according to the manufacturer's instructions.
Microarray analysis
Gene expression analysis using oligonucleotide microarrays
For the control, and triple siRNA (p70S6K, S6K, and eIF4E), and rapamycin treated 5637 and T24 cells, the synthesis of target cRNA probes and hybridization were performed using Low RNA Input Linear Amplification kit (Agilent Technology, Palo Alto, CA, USA) according to the manufacturer's instructions. Amplified and labeled cRNA was purified on cRNA Cleanup Module (Agilent Technology) according to the manufacturer's protocol. The fragmented cRNA was resuspended in 2X hybridization buffer and directly pipetted onto assembled Agilent's Human Oligo Microarray (4 × 44K). The arrays were hybridized at 65°C for 17 hours using an oven (Agilent Technology). The hybridized microarrays were washed according to the manufacturer's washing protocol (Agilent Technology).
Cutoffs
The absolute cutoff value of fold-change had to be greater than 2.0 in at least 1 experiment, and the average intensity had to be greater than 300. These cutoffs reduced the number of genes from 8,976 to 234. Data were filtered to select genes that had both a proper fold change to remove the background of mostly unchanging genes and an average intensity distinguishable from the noise of microchip hybridization.
Data acquisition and analysis
The hybridized images were scanned using a DNA microarray scanner and quantified with Feature Extraction Software (Agilent Technology). All data normalization and the selection of genes with 2-fold change in expression were performed using GeneSpringGX 7.3 (Agilent Technology).
Patient cohort and tissue microarray (TMA) construction
We used 215 non-muscle-invasive UC bladder specimens collected at Chung-Ang University Hospital between 2005 and 2013 after obtaining Institutional Review Board approval. Paraffin blocks were available for 215 cases and TMAs were constructed using a manual array device (TMA set, Labro, Seoul, Korea) for 125 HG-UC samples. Two mm-thick tumor samples were collected in triplicate from each sample, and 4 µm-thick sections were consecutively incised from the recipient block and transferred to polylysine-coated glass slides. Because it was a retrospective study of anonymous patients, informed patient consent was waived. The study was carried out in agreement with the Declaration of Helsinki.
Immunohistochemistry
For the immunohistochemical procedures, 4 µm-thick sections were deparaffinized, rehydrated, and subjected to heat-induced antigen retrieval with a buffer solution using a streamer autoclave. Sections were then incubated with the appropriate primary antibody. After application of a secondary antibody, slides were developed using 3-3′-diaminobenzidine as a chromogen and counterstained with hematoxylin. TMA spots with artificial folds or those lacking target tissue representations were omitted from further analyses. The antibodies listed in Supplementary Table 1 were used. Tumor TMA spots stained with each marker were evaluated for extent (percent of positive cells) and intensity (0 to 3+ score). The standard H-score (scale 0–300) was calculated based on the product of percentage of stained cells (0–100) multiplied by staining intensity (1 = weak, 2 = moderate, and 3 = strong) (9). A final H-score was generated as the average of triplicate tissue samples. The H-scores of markers were used in the statistical analyses. In the Kaplan-Meier curve, a cutoff value of expression of each marker was used according to the median tumor H-score. In a Kaplan-Meier curve and Cox regression model, a cutoff value of the expression of each marker was used according to the median tumor H-score. Strong expression of a marker was defined as expression equal to or greater than the cutoff value, and weak expression as no expression or expression less than the cutoff value.
Statistical analysis
IBM SPSS ver. 21.0 (IBM Corp., Armonk, NY, USA) was used for all statistical analyses. The analysis of variance (ANOVA) test and Student's t-test were performed at P < 0.05 in order to identify genes that were differentially expressed across conditions. Hierarchical clustering was performed using similarity measurements based on Pearson correlations close to zero. Recurrence-free and progression-free survival (PFS) curves were estimated using the Kaplan-Meier method, and any differences in the survival curves were compared by log-rank tests. A Cox regression model was used to investigate predictive factors for the recurrence of HG-UC in a multivariate analysis.
RESULTS
Western blot of mTOR pathway expression after treatment with triple siRNAs or rapamycin in HG-UC cell lines
We analyzed the expression of p70S6K and eIF4E proteins in 5637 and T24 UC cells. To study the downstream targets of the mTOR pathway, 5637 and T24 cell lines were treated with triple siRNAs (p70S6K, S6K, and eIF4E) or the mTOR inhibitor rapamycin (Fig. 1A). We evaluated protein expression after treatment with p70S6K, S6K, and eIF4E siRNAs in 5637 and T24 cells to confirm inhibition of p70S6K and eIF4E gene expression before performing complementary DNA (cDNA) microarray analysis. The triple siRNA treatment blocked the expression of p70S6K and eIF4E proteins in the 2 UC cell lines, and rapamycin inhibited the phosphorylation of p70S6K and eIF4E.
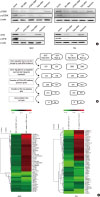 | Fig. 1Protein-level validation of p70S6K and eIF4E suppression after RPS6KB1 and eIF4E siRNA treatments, gene filtering, and gene expression profiling in HG-UC cell lines. (A) Reduced gene expression was observed in 5637 and T24 cells after transfection with siRNAs against p70S6K and eIF4E. Inhibited gene expression of both p70S6K and eIF4E was evident after treatment with triple siRNAs (p70S6K, S6K, and eIF4E). (B) Gene filtering process in 5637 and T24 cells. (C) Hierarchical clustering analysis of 5637 and T24 cells; red spots indicate up-regulation, green spots indicate down-regulation, black spots indicate an absence of modulation, and gray spots indicate the absence of values.
siRNA = small interfering RNA, HG = high-grade, UC = urothelial carcinoma, PI3K = phosphoinositide 3-kinase, mTOR = mammalian target of rapamycin.
|
Gene expression patterns after siRNA or rapamycin treatment
In 5637 cells, 633 genes were down-regulated by triple siRNA treatment in comparison to the control. In T24 cells, 3,089 genes were down-regulated by triple siRNA treatment. We filtered reliable genes based on the objective criteria (Fig. 1B). The first filtering resulted in genes that were down-regulated by more than 2-fold compared to the control in response to triple siRNA treatment. The second filtering resulted in genes that were down-regulated or up-regulated by more than 2-fold in comparison to the control after rapamycin treatment. The third filtering excluded genes were upstream of the phosphoinositide 3-kinase (PI3K)/mTOR pathway. The fourth filtering removed genes with a low signaling spot (flags A, M). With the fifth filter, we selected genes related to the cell cycle.
Hierarchical cluster analysis was used to profile the gene expression patterns (Fig. 1C). In 5637 cells, 14 of the 42 genes included after the filtering process were rapamycin down-regulated genes and 28 genes were rapamycin up-regulated genes. In comparison, 27 of 43 genes in T24 cells were rapamycin down-regulated genes and 16 genes were rapamycin down-regulated genes. Two rapamycin down-regulated genes (FABP4 and H19) and 2 rapamycin up-regulated genes (PLXND1 and ADAMTS5) were filtered from both the 5637 and T24 cell lines.
Selection of mTOR pathway downstream genes according to gene expression pattern after siRNA or rapamycin treatment
Of 85 genes filtered from 5637 and T24 cells, we selected 4 that were simultaneously filtered from 5637 and T24 cells and 4 known to be associated with cancers based on a review of published studies (Table 1). FABP4, H19, ANXA10, and UPK3A were down-regulated by rapamycin and FOXD3, ATP7A, PLXND1, and ADAMTS5 were rapamycin up-regulated genes. We investigated the gene ontology (GO) classes that were enriched in the gene expression profiles of RNAs and rapamycin-treated UC cell lines using the GO categorizer (Table 1) (10). In triple siRNA-treated UC cell lines, the representative enriched GO classes were functional categories involved in response organic substance (FABP4), immune response (H19), response calcium ion (ANXA10), potassium homeostasis (UPK3A), blood vessel morphogenesis (PLXND1), regulation of DNA binding (FOXD3), proteolysis (ADAMTS5), and blood vessel morphogenesis (ATP7A). Among these genes, ANXA10, FOXD3, and ADAMTS5 were tumor suppressor genes.
Table 1
Selection of mTOR pathway downstream genes according to the gene expression patterns after siRNAs or rapamycin treatment in HG-UC cell lines

mTOR = mammalian target of rapamycin, siRNA = small interfering RNA, HG = high-grade, UC = urothelial carcinoma, GO = gene ontology, D = down-regulated expression, U = up-regulated expression.
![]()
Patient and tumor characteristics and expression of mTOR pathway downstream genes in relation to clinicopathological variables
FABP4, H19, ANXA10, UPK3A, FOXD3, ATP7A, PLXND1, and ADAMTS5 expression were detected by immunohistochemical staining in 115 (92.0%), 24 (19.2%), 119 (95.2%), 118 (94.4%), 119 (95.2%), 115 (92%), 102 (81.6%), and 99 (79.2%) of 125 non-muscle-invasive HG-UC samples, respectively (Fig. 2A). The median H-scores of FABP4, H19, ANXA10, UPK3A, FOXD3, ATP7A, PLXND1, and ADAMTS5 were 25.0, 0, 5.6, 13.3, 5.0, 30.0, 2.2, and 30.0, respectively.
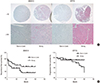 | Fig. 2Expression of downstream genes of the mTOR pathway in HG-UC of bladder tissues, and Kaplan-Meier curves based on staining results in HG-UC patients. (A) Immunohistochemical staining of ANXA10 and ATP7A in paraffin-embedded sections of HG-UC tissues (× 40, × 200). (B) In RFS curves, HG-UC with no or weak ANXA10 immunohistochemical staining exhibited decreased RFS (P = 0.037). In PFS curves, HG-UC with strong ATP7A immunohistochemical staining exhibited decreased PFS (P = 0.004).
mTOR = mammalian target of rapamycin, HG = high-grade, UC = urothelial carcinoma, RFS = recurrence-free survival, PFS = progression-free survival.
|
The basic characteristics of the patients are shown in Supplementary Table 2. The mean age was 66.7 years (range, 31–90) at the time of diagnosis of UC, and the median follow-up duration was 27 months (range, 2–60). Thirty-three patients (26.4%) had recurrence of UC within a mean follow-up of 36.5 months (range, 1–60). Thirteen patients (10.4%) developed a muscle-invasive disease within a mean period of 41.4 months (range, 3–60). Those aged 60–70 years comprised the largest number of patients (34.4%), and 88.8% of the patients were male. Primary tumors accounted for 28% of the prior recurrence rate. Single tumors were observed most frequently (60.8%) and a tumor size of ≤ 3 cm (59.2%) was observed more frequently than a tumor size > 3 cm. T1 cancer was present in 101 (80.8%) patients. A total of 57 patients (45.6%) received bacillus Calmette-Guérin (BCG) instillation as intravesical treatment.
Among the rapamycin down-regulated genes, FABP4 showed stronger expression in the T1 pathologic T stage than the Ta stage (H-score, 76.6 ± 25.5 vs. 49.4 ± 19.0; P = 0.038), and ANXA10 showed weaker expression in tumors > 3 cm in size (H-score, 13.4 ± 6.7 vs. 39.6 ± 9.8; P = 0.020) (Supplementary Table 2). Of the rapamycin up-regulated genes, ATP7A (H-score, 90.4 ± 30.7 vs. 59.0 ± 25.3; P = 0.046) showed higher expression in T1 stage than Ta stage and FOXD (62.4 ± 22.2 vs. 86.8 ± 27.3; P = 0.037) showed weaker expression; ADAMTS5 showed weaker expression in tumors larger than 3 cm (H-score, 12.0 ± 6.0 vs. 26.0 ± 13.0; P = 0.014) (Supplementary Table 3).
In the Cox regression model, tumor multiplicity and none or weak ANXA10 gene expression predicted shorter recurrence-free survival (RFS). And T1 stage, strong FABP4, and strong ATP7A gene expressions predicted shorter PFS in low-grade (LG)-UC in univariate analysis (Table 2). In multivariate analysis, tumor multiplicity (hazard ratio [HR], 2.173; P = 0.017), and none or weak ANXA 10 (HR, 2.137; P = 0.035) were independent factors predicting recurrence and strong ATP7A gene expression (HR, 5.866; P = 0.038) was an independent factor predicting progression (Table 2). In immunohistochemical staining, ANXA10 was expressed in the nucleus and cytoplasm of tumor cells and ATP7A was expressed in the cytoplasm of tumor cells, and non-muscle invasive HG-UC patients with none or week ANXA10 exhibited decreased RFS (P = 0.037), and strong ATP7A immunohistochemical staining exhibited decreased PFS (P = 0.004) in Kaplan-Meier's survival curve (Fig. 2A and B).
Table 2
Cox proportional HR to identify predictive factors for recurrence and progression in HG-UC of the bladder
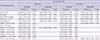
HR = hazard ratio, HG = high-grade, UC = urothelial carcinoma, RR = relative risk, CI = confidence interval.
![]()
Cell proliferation, wound healing, and invasion inhibition effect of rapamycin in ATP7A knockout 5637 cells
The 5637 cells knocked-out for rapamycin up-regulated gene ATP7A were used to evaluate the synergistic effects of rapamycin and ATP7A inhibition. Two stable shATP7A RNA transfected 5637 cells (shATP7A#1 and shATP7A#2) were selected by Western blot analysis. Cell proliferation-inhibition effects of rapamycin were significantly increased in shATP7A#1 (P < 0.023) and shATP7A#2 (P < 0.007) compared with control in low concentration (1 μM) (Fig. 3A and B). The migration-inhibition effect of rapamycin was aggravated in ATP7A knockout 5737 cells compared to control (Fig. 3C). The invasion-inhibition effect of rapamycin was significantly exacerbated in ATP7A knockout 5637 cells compared to control at low rapamycin concentration (1 μM) (P = 0.005) (Fig. 3D).
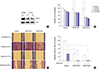 | Fig. 3Down-regulation of up-regulated ATP7A expression after siRNAs or rapamycin treatment in HG-UC 5637 cell line. (A) Western blots of whole-cell lysates from ATP7A stable knockdown and non-targeted shRNA control 5637 cell line after puromycin selection: control, pLKO.1 control vector; shATP7A#1 and shATP7A#2, ATP7A shRNA vectors. (B) Cell viability determined by MTT assay. Data are mean ± SD (n = 6). (C) ATP7A stable knockdown 5637 cell lines exhibited reduced cell migration to rapamycin treatment. (D) ATP7A stable knockdown 5637 cell lines exhibited significantly reduced cell invasion compared to that of the control.
siRNA = small interfering RNA, HG = high-grade, UC = urothelial carcinoma, shRNA = short-hairpin RNA, MTT = 3-(4,5-dimethylthiazol-2-yl)-2,5-diphenyltetrazolium bromide, SD = standard deviation.
*P < 0.050, †P < 0.010.
|
DISCUSSION
Since the mTOR pathway is associated with aggressive disease and poor prognosis of HG-UC, molecular profiling of genes suppressed downstream of the mTOR pathway might provide candidate molecular targets for new therapies. Gene expression patterns, GO, and gene clustering by triple siRNA (p70S6K, S6K, and eIF4E) or rapamycin treatment of 5637 and T24 cells were investigated using microarray analysis. We selected downstream genes of the mTOR pathway that were suppressed by over 2-fold and genes that were up- or down-regulated over 2-fold by rapamycin treatment. We then validated the expression of downstream genes of the mTOR pathway with immunohistochemistry using a TMA of 125 non-muscle invasive HG-UC patients to determine whether the genes predicted clinical aggressiveness and long-term outcome. Molecular profiling clustered UC of the bladder on the basis of histopathogenesis and biological criteria. The identified molecular targets were associated with histopathologic criteria and might become clinically useful biomarkers for the management of patients with UC of the bladder.
Our microarray data identified 2 rapamycin down-regulated genes (FABP4 and H19) and 2 rapamycin up-regulated genes (PLXND1 and ADAMTS5) that were altered due to mTOR pathway inhibition in UC cells using RNAi and small molecule inhibitors. These genes were functionally classified as encoding responses to organic substances (FABP4), immune response (H19), blood vessel morphogenesis (PLXND1), and proteolysis (ADAMTS5). This supports the hypothesis that the mTOR pathway is related to tumorigenesis because of its vital roles in cell growth, proliferation, and metabolism, indicating the successful implementation of the microarray. To our knowledge, this study is the first to show a molecular pattern associated with mTOR inhibition and specific to UC cell lines.
ANXA10 and ATP7A were possible mTOR-related biomarkers for predicting tumor recurrence (ANXA10) and progression (ATP7A) of HG-UC in the multivariate Cox model. These results support several suggestions. The first is that these biomarkers might be capable of estimating the therapeutic efficacy of rapamycin. If the expression of ATP7A is high, the therapeutic efficacy of rapamycin to prevent recurrence or progression could be lower than usual. Rapamycin treatment may not be appropriate to prevent recurrence due the suppression of ANXA10 in HG-UC patients with high ANXA10 expression. Second, the biomarkers might be candidates for targeted therapy in HG-UC and could explain why rapamycin did not show high efficacy for HG-UC. In particular, the agonist for ANXA10 and the inhibitor for ATP7A could be used as adjuvant treatment to rapamycin or new therapeutic agents for patients with rapamycin resistance.
ANXs are a family of calcium and phospholipid-binding proteins that share a similar structure characterized by the presence of 4 or 8 repeats of a 70-amino-acid motif and a highly variable N-terminal end (11). The ANX family is composed of 12 eukaryotic members that participate in diverse important biological and physiological processes including anti-coagulation, endocytosis, exocytosis, immune suppression, differentiation, and tissue growth (111213). ANXA10 was one of the markers included in the signature for predicting recurrence of non-muscle-invasive UC of the bladder, and low expression of ANXA10 correlated with shorter RFS in patients with stage Ta and T1 tumors (14). Furthermore, patients with more advanced tumors and low ANXA10 expression had an unfavorable prognosis (14).
The ATP7A gene product serves as a direct link between management of copper homeostasis and effective concentration of cisplatin in cells, and the ATP7A copper efflux ATPase pumps critically regulate cisplatin efflux (1516). Thus, the uptake-efflux relative kinetics control intracellular accumulation of various drugs including cisplatin and, therefore, its cytotoxic action. ATP7A overexpression in cancer cells renders the cells resistant to drugs due to increased sequestration of the drug into the vesicular fraction, thus keeping the drug away from the target sites of its cytotoxic action (1516). In our study, the higher expression of ATP7A, a rapamycin up-regulated gene, was related to predict higher progression in non-muscle invasive HG-UC of the bladder, and ATP7A knockout potentiated the cell proliferation, migration, and invasion inhibition effect of rapamycin. We suggest that up-regulated ATP7A inhibits uptake of mTOR inhibitor and the effect of drugs. ATP7A might be novel target to overcome the cross-talk of the mTOR pathway.
One of the limitations of this study was that tumor size and tumor stage were not related to progression and recurrence, although tumor multiplicity was related to recurrence in multivariate analysis. In the case of tumor size, the number of patients (n = 125) was smaller than other studies, and most patients with HG (84.2%) showed T1 stage, so we need more patients to validate the effects of tumor size and stage (17). And we need to discuss the effect of BCG because 45.6% of patients received BCG intravesical instillation to prevent recurrence and progression. We instilled intravesical BCG to patients with large size and high stage, and we hypothesis that the effect of BCG might interfere the effect of tumor size and stage (17).
Based on microarray and clinical characteristics, our results reveal that the ANXA10 is an mTOR-related down-regulated biomarker and the low expression by mTOR inhibitor could predict recurrence in HG-UC of the bladder. So, we need to choose other treatment agents than mTOR inhibitor for bladder cancer when the expression of ANXA10 is high. Also, ATP7A is a potential mTOR-related up-regulated biomarker and the high expression by mTOR inhibitor could predict progression in HG-UC of the bladder. Moreover, in our study, ATP7A knockout can potentiate the effect of mTOR inhibitor, which means that the resistance of mTOR inhibitor might be related with the rapamycin cross-talk and mTOR and ATP7A dual inhibitor might overcome rapamycin cross-talk. Since mTOR expression is associated with aggressive disease and poor prognosis of UC, molecular profiling of downstream genes of a suppressed mTOR pathway, which is associated with recurrence and progression of UC, might provide candidates for novel molecular target therapies. mTOR inhibitor could have clinical utility for preventing recurrence and progression in UC when rapamycin down-regulated genes are expressed in non-muscle-invasive UC of the bladder. The expression of rapamycin-up-regulated genes might predict recurrence and progression after rapamycin treatment, so new agents to inhibit these genes in combination with rapamycin treatment are needed. These genes might be useful target genes for novel targeted therapies and these studies might enable individualized therapies for non-muscle invasive UC of the bladder. Further in vitro and in vivo studies will evaluate the mechanisms and functions of these candidate genes and demonstrate clinical validation to advance individualized therapies.
 XML Download