Journal List > J Korean Med Sci > v.32(8) > 1108454

Oh, Ahn, Kim, Kim, Woo, Kim, Baek, Kim, Choi, Lee, Choi, Han, Kang, Kim, Choi, and Korea HIV/AIDS Cohort Study: Metabolic Complications among Korean Patients with HIV Infection: The Korea HIV/AIDS Cohort Study

Abstract

Currently, metabolic complications are the most common problem among human immunodeficiency virus (HIV)-infected patients, with a high incidence. However, there have been very few studies regarding metabolic abnormalities published in Asia, especially in Korea. This cross-sectional study was performed to investigate the prevalence of and risk factors for metabolic abnormalities in 1,096 HIV-infected patients of the Korea HIV/AIDS cohort study enrolled from 19 hospitals between 2006 and 2013. Data at entry to cohort were analyzed. As a result, the median age of the 1,096 enrolled subjects was 46 years, and most patients were men (92.8%). The metabolic profiles of the patients were as follows: median weight was 63.8 kg, median body mass index (BMI) was 22.2 kg/m2, and 16.4% of the patients had a BMI over 25 kg/m2. A total of 5.5% of the patients had abdominal obesity (waist/hip ratio ≥ 1 in men, ≥ 0.85 in women). Increased levels of fasting glucose, total cholesterol, low-density lipoprotein (LDL) cholesterol, and triglycerides were present in 10.4%, 6.0%, 5.5%, and 32.1% of the patients. Decreased high-density lipoprotein (HDL) cholesterol levels were observed in 44.2% of the patients. High systolic blood pressure was present in 14.3% of the patients. In multivariate analysis, high BMI and the use of protease inhibitors (PIs) were risk factors for dyslipidemia in HIV-infected patients. In conclusion, proper diagnosis and management should be offered for the prevalent metabolic complications of Korean HIV-infected patients. Further studies on risk factors for metabolic complications are needed.

Graphical Abstract

jkms-32-1268-abf001

INTRODUCTION

The introduction of highly active antiretroviral therapy (HAART) for the treatment of human immunodeficiency virus (HIV) infection changed the characteristics of HIV infection, from a fatal disease to a chronic manageable infectious disease (1). However, as the life expectancy of HIV-infected patients increased, lifestyle-related comorbidities such as cardiovascular disease (CVD), diabetes, and hyperlipidemia began to emerge as a problematic issue and challenge in the treatment of HIV infection. Furthermore, antiretroviral drugs have the potential to induce many adverse drug reactions as well as drug-drug interactions with medications administered for the treatment of other comorbidities (2).
Long-term metabolic complications induced by antiretroviral drugs include osteoporosis, lipodystrophy, dyslipidemia, hyperglycemia, hypertension, and metabolic syndrome, among others. These complications may be risk factors for cerebral vascular disease and coronary artery disease, and may contribute to the morbidity and mortality of these diseases. Recent studies have reported a higher prevalence of these diseases in HIV-infected patients than in the general population (34).
Differences in the prevalence of these long-term metabolic complications have been observed across previous studies, because each of the studies was performed in a different population and used different diagnostic criteria (5). Choe et al. (6) published a study evaluating the incidence of metabolic complications in a Korean population of HIV-infected patients in 2004. The study analyzed 66 HIV-infected patients and found an incidence of metabolic complications of 20.3%. In detail, the incidence of hypertriglyceridemia, hypercholesterolemia, hyperglycemia, and diabetes was 12.3%, 5.8%, 1.4%, and 4.3%, respectively.
To date, several studies have investigated the prevalence of metabolic complications in HIV-infected patients in Korea. However, these studies were limited by small sample sizes, and each study did not analyze metabolic parameters comprehensively (67891011). The purpose of the present study was to identify the prevalence of and evaluate the risk factors for metabolic complications in HIV-infected patients in Korea.

MATERIALS AND METHODS

Study population and design

Participants in this prospective cross-sectional study were HIV-infected subjects who visited 19 hospitals affiliated with the Korean HIV/AIDS Cohort from December 2006 to July 2013. The study protocol was approved by the Institutional Review Board of each of the participating hospitals. All participants were older than 18 years and provided informed consent prior to enrollment. Data at entry to cohort were used for analyses. The prevalence of metabolic abnormalities was calculated, and the rates of metabolic abnormalities were compared with data reported for the general population. The rates of metabolic abnormalities were compared between treatment-naïve and treatment-experienced subjects. In addition, a case-control study was performed to identify risk factors for dyslipidemia.

Data collection

Demographic and clinical characteristics were obtained for all participants. Biologic data such as age, sex, race, body weight, body mass index (BMI), waist circumference (WC), waist/hip ratio, and blood pressure were collected. Regarding comorbidities, history of hypertension, diabetes, dyslipidemia, CVD, smoking history, and family history were collected. In terms of history related to HIV infection, sexual habits, history of exposure route of HIV, time of entry to cohort, time of diagnosis, clinical classification guided by the Centers for Disease Control and Prevention, baseline CD4+ T-cell counts, baseline HIV viral loads, antiviral treatment status, and antiretroviral regimen were collected. Laboratory data related to metabolic complications such as fasting glucose, total cholesterol, high-density lipoprotein (HDL)-cholesterol, low-density lipoprotein (LDL)-cholesterol, and triglycerides were evaluated. To assess cardiovascular risk, the Framingham risk score (FRS) was calculated (12).

Definitions

Hyperglycemia is defined as serum fasting glucose ≥ 126 mg/dL (13). Hypercholesterolemia is defined as serum total cholesterol ≥ 240 mg/dL. Hypoalphalipoproteinemia is defined as serum HDL-cholesterol < 40 mg/dL. Hyper LDL-cholesterolemia is defined as serum LDL-cholesterol ≥ 160 mg/dL. Hypertriglyceridemia is defined as serum triglycerides ≥ 200 mg/dL (14). High and low BMI are defined as BMI > 25 and < 18.5, respectively (15). Dyslipidemia was defined as the presence of one or more of hypercholesterolemia, hyper LDL-cholesterolemia, hypoalphalipoproteinemia, and hypertriglyceridemia (16). Lipodystrophy was defined as the presence of peripheral lipoatrophy or central fat accumulation subjectively measured by standardized physical examination procedure (17). The FRS is the most commonly used tool for prediction of cardiovascular risk, and is calculated using variables including age, sex, total cholesterol, HDL-cholesterol, hypertension, hypertension treatment, diabetes mellitus, and current smoking. Subjects were classified as having a very low, low, moderate, or high 10-year coronary risk in accordance with the Framingham equation (< 10%, 10%–15%, 16%–20%, and > 20%, respectively) (18).

Data analysis

Continuous variables were expressed as mean or median (interquartile range) and compared using Student's t-test if the variables followed a normal distribution. Continuous variables with skewed distribution were compared using the Mann-Whitney U test. Categorical variables were compared using the χ2 test. Variables with a P value less than 0.05 on univariate analysis were included in the logistic regression model for multivariate analysis for predicting risk factors for dyslipidemia. All statistical analyses were performed using SAS 9.2 (SAS Institute Inc., Cary, NC, USA). P values less than 0.05 were considered statistically significant.

Ethics statement

The study was approved by the Institutional Review Board of the Yonsei University Health System Clinical Trial Center and proceeded with getting informed consent from all patients participating in the study (Study No. 4-2006-0158).

RESULTS

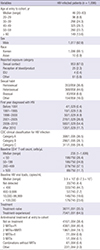
A total of 1,096 patients were eligible for inclusion in this study. The median age of participants was 46 years, and the proportion of men was 92.8%. Almost all participants were Korean (99.1%), and the most frequent exposure route of HIV infection was sexual contact (87%). The proportion of intravenous drug use was 0.4%. The median baseline CD4+ T-cell count of participants was 235 cells/μL, and the proportion of treatment-naïve patients was 35.5%. The most commonly used antiretroviral regimen was a protease inhibitor (PI)-based regimen (40.4%) (Table 1).
Table 1

Baseline characteristics of HIV-infected patients in this study

jkms-32-1268-i001
Variables HIV-infected patients (n = 1,096)
Age at entry to cohort, yr
 Median (range) 46 (20–83)
 20–29 96 (8.8)
 30–39 266 (24.3)
 40–49 325 (29.7)
 50–59 260 (23.7)
 ≥ 60 149 (13.6)
Sex
 Male 1,017 (92.8)
Race
 Korean 1,086 (99.1)
 Asian 10 (0.9)
Reported exposure category
 Sexual contact 953 (87.0)
 Reception of blood/product 25 (2.3)
 IDU 4 (0.4)
 Other 61 (5.6)
Sexual habit
 Homosexual 353/958 (36.8)
 Heterosexual 368/958 (44.6)
 Bisexual 83/958 (8.6)
 Other 154/958 (16.0)
First year diagnosed with HIV
 Before 1991 4/1,029 (0.4)
 1991–1995 19/1,029 (1.8)
 1996–2000 50/1,029 (4.9)
 2001–2005 276/1,029 (26.8)
 2006–2010 560/1,029 (54.4)
 After 2010 120/1,029 (11.7)
CDC clinical classification for HIV infection
 Category A 398/1,095 (36.5)
 Category B 286/1,095 (26.1)
 Category C 311/1,095 (28.4)
Baseline CD4+ T-cell count, cells/µL
 Median (range) 235 (1–1,699)
 < 50 198/750 (26.4)
 50–199 186/750 (24.8)
 200–499 278/750 (37.1)
 ≥ 500 88/750 (11.7)
Baseline HIV viral loads, copies/mL
 Median (range) 3.9 × 10⁵ (0–7.5 × 10⁷)
 Not detected 33/745 (4.4)
 < 400 333/745 (44.7)
 400–9,999 57/745 (7.7)
 10,000–99,999 146/745 (19.6)
 ≥ 100,000 176/745 (23.6)
Treatment
 Treatment-naïve 387/1,091 (35.5)
 Treatment-experienced 704/1,091 (64.5)
Antiretroviral treatment at entry to cohort
 Not on treatment 416/1,084 (38.4)
 2 NRTIs + PI 438/1,084 (40.4)
 2 NRTIs + NNRTI 196/1,084 (18.1)
 2 NRTIs + II 7/1,084 (0.6)
 3 NRTIs 1/1,084 (0.1)
 Combinations without NRTIs 4/1,084 (0.4)
 Other 22/1,084 (2.0)
HIV = human immunodeficiency virus, IDU = intravenous drug use, CDC = Centers for Disease Control and Prevention, NRTI = nucleoside analogue reverse transcriptase inhibitor, PI = protease inhibitor, NNRTI = non-nucleoside reverse transcriptase inhibitor, II = integrase inhibitor.
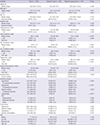
The prevalence of metabolic complications in all HIV-infected patients in the cohort was as follows. The prevalence of obesity based on BMI, obesity based on waist/hip ratio (waist/hip ratio ≥ 1 in men, ≥ 0.85 in women), hyperglycemia, hypercholesterolemia, hypoalphalipoproteinemia, hyper LDL-cholesterolemia, and hypertriglyceridemia were 16.4%, 19.0%, 10.4%, 6.0%, 44.2%, 5.5%, and 32.1%, respectively (Table 1). Among metabolic parameters, median serum total cholesterol (155 [48–297] vs. 176 [11–364] mg/dL; P < 0.001), HDL-cholesterol (38 [4–137] vs. 45 [10–177] mg/dL; P < 0.001), and triglycerides (155 [14–636] vs. 202 [18–1,040] mg/dL; P < 0.001) were significantly higher in treatment-experienced patients (Table 2). Additionally, the proportion of hypercholesterolemia (2.7% vs. 7.7%; P = 0.008) and hypertriglyceridemia (23.7% vs. 37.2%; P < 0.001) were significantly higher in treatment-experienced patients than in treatment naïve patients. Other metabolic parameters did not show statistically significant differences between the 2 patient groups.
Table 2

Comparisons of metabolic parameters between treatment-naïve patients and treatment-experienced patients

jkms-32-1268-i002
Variables Total (n = 1,091) Treatment-naïve (n = 387) Treatment-experienced (n = 704) P value
Weight, kg
 Median (range) 63.8 (36.4–122.5) 64.4 (39–107) 63.4 (36.4–122.5) 0.190*
BMI, kg/m2
 Median (range) 22.2 (14.5–37.8) 22.2 (14.8–33.8) 22.14 (14.5–37.8) 0.817*
 > 25 140/856 (16.4) 56/318 (17.6) 84/537 (15.6) 0.452
WC, cm
 Median (range) 82.0 (60.0–120.0) 81.2 (65–118) 82.4 (60.0–120.0) 0.176*
 Abdominal obesity 85/447 (19.0) 28/154 (18.2) 57/293 (19.5) 0.745
Waist/hip ratio
 Median (range) 0.87 (0.71–1.21) 0.87 (0.73–1.21) 0.88 (0.71–1.16) 0.160*
 Abdominal obesity 23/417 (5.5) 7/146 (4.8) 16/273 (5.9) 0.648
Fasting glucose, mg/dL
 Median (range) 103 (62–432) 101 (62–346) 104 (64–432) 0.240*
 ≥ 126 82/787 (10.4) 22/265 (8.3) 60/522 (11.5) 0.166
Total cholesterol, mg/dL
 Median (range) 169 (11–364) 155 (48–297) 176 (11–364) < 0.001*
 ≥ 280 12/997 (1.2) 2/332 (0.6) 10/663 (1.5) 0.008
 240–279 48/997 (4.8) 7/332 (2.1) 41/663 (6.2) -
HDL-cholesterol, mg/dL
 Median (range) 43 (4–177) 38 (4–137) 45 (10–177) < 0.001*
 < 40 337/763 (44.2) 148/254 (58.3) 189/507 (37.3) < 0.001
LDL-cholesterol, mg/dL
 Median (range) 101 (10–1,236) 98 (10–623) 103 (11–1,236) 0.313*
 ≥ 190 13/688 (1.9) 3/230 (1.3) 10/455 (2.2) 0.593
 160–189 25/688 (3.6) 7/230 (3.0) 18/455 (4.0) -
Triglycerides, mg/dL
 Median (range) 186 (14–1,040) 155 (14–636) 202 (18–1,040) < 0.001*
 ≥ 500 27/872 (2.5) 2/279 (0.7) 25/589 (4.2) < 0.001
 200–499 258/872 (29.6) 64/279 (22.9) 194/589 (32.9) -
Systolic blood pressure, mmHg
 Median (range) 124 (82–205) 123 (82–173) 125 (90–205) 0.102*
 > 160 21/742 (2.8) 8/251 (3.2) 13/491 (2.6) 0.191
 140–159 97/742 (11.5) 22/251 (8.8) 65/491 (13.2) -
Smoking history 649/1,044 (62.2) 238/366 (64.9) 410/676 (60.4) 0.239
 Current smoking 466/1,044 (44.6) 191/366 (52.2) 274/676 (40.5)
Underlying disease
 Hypertension 112/1,087 (10.3) 37/383 (9.7) 75/690 (10.9) 0.535
  On antihypertensive treatment 97/1,087 (8.9) 33/383 (8.6) 64/690 (9.3)
 Dyslipidemia 96/1,081 (8.9) 10/382 (2.6) 86/686 (12.4) < 0.001
  On dyslipidemia treatment 80/1,081 (7.4) 8/382 (2.1) 72/686 (10.5)
 Diabetes mellitus 71/1,088 (6.5) 23/383 (6.0) 48/691 (6.9) 0.552
  On diabetes treatment 68/1,088 (6.2) 23/383 (6.0) 45/691 (6.5)
 Lipodystrophy 28/1,089 (2.6) 0/385 (0) 28/693 (4.0) < 0.001
 CVD
  Angina pectoris 3/1,064 (0.3) 0/381 (0) 3/678 (0.4) 0.299
  Myocardial infarction 3/1,064 (0.3) 0/381 (0) 3/678 (0.4) 0.165
  Stroke 12/1,064 (1.1) 5/381 (1.3) 8/678 (1.2) 0.295
Family history
 Hypertension 262/1,093 (23.9) 87/386 (22.5) 175/704 (24.9) 0.525
 Diabetes mellitus 213/1,093 (19.5) 67/386 (17.4) 146/704 (20.7) 0.308
 Dyslipidemia 12/1,093 (1.1) 2/386 (0.5) 10/704 (1.4) 0.223
 Ischemic heart disease 43/1,093 (3.9) 10/386 (2.6) 33/704(4.7) 0.167
FRS
 Median 7.13 (0–31) 6.61 (0–31) 7.4 (0–31) 0.194*
 Low risk 409/558 (87.3) 147/192 (76.6) 262/366 (71.6) 0.419
 Moderate risk 122/588 (11.1) 36/192 (18.8) 86/366 (23.5) -
 High risk 27/558 (2.5) 9/192 (4.7) 18/366 (4.9) -
The data were expressed as median (interquartile range) or number (percentage).
BMI = body mass index, WC = waist circumference, HDL = high-density lipoprotein, LDL = low-density lipoprotein, CVD = cardiovascular disease, FRS = Framingham risk score.
*Mann-Whitney U-test, median (interquartile range); Pearson's χ2-test.
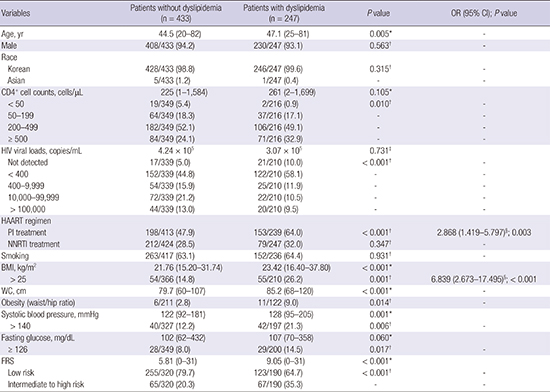
To analyze the risk factors for dyslipidemia in HIV-infected patients, univariate and multivariate analyses were performed. Comparison of the patient group without dyslipidemia and the patient group with dyslipidemia showed that the dyslipidemia group had older age (47.1 vs. 44.5 years; P = 0.005), higher proportion of high CD4+ T-cell counts (P = 0.010) and low HIV viral loads (P < 0.001); higher proportion of PI-based regimen (64.0% vs. 47.9%; P < 0.001); higher BMI (23.42 vs. 21.76 kg/m2; P = 0.001); larger WC (85.2 vs. 79.7 cm; P < 0.001); and higher rate of obesity (9.0% vs. 2.8%; P = 0.014) and high systolic blood pressure (21.3% vs. 12.2%; P = 0.006) than the group without dyslipidemia. However, high BMI (odds ratio [OR], 6.839; 95% confidence interval [CI], 2.673–17.495; P < 0.001) and the use of PI-based regimen (OR, 2.868; 95% CI, 1.419–5.797; P = 0.003) were significant risk factors for dyslipidemia in multivariate analysis (Table 3).
Table 3

Comparison and multivariate analysis of risk factors for dyslipidemia in HIV-infected patients

jkms-32-1268-i003
Variables Patients without dyslipidemia (n = 433) Patients with dyslipidemia (n = 247) P value OR (95% CI); P value
Age, yr 44.5 (20–82) 47.1 (25–81) 0.005* -
Male 408/433 (94.2) 230/247 (93.1) 0.563 -
Race
 Korean 428/433 (98.8) 246/247 (99.6) 0.315 -
 Asian 5/433 (1.2) 1/247 (0.4) - -
CD4+ cell counts, cells/µL 225 (1–1,584) 261 (2–1,699) 0.105*
 < 50 19/349 (5.4) 2/216 (0.9) 0.010 -
 50–199 64/349 (18.3) 37/216 (17.1) - -
 200–499 182/349 (52.1) 106/216 (49.1) - -
 ≥ 500 84/349 (24.1) 71/216 (32.9) - -
HIV viral loads, copies/mL 4.24 × 10⁵ 3.07 × 10⁵ 0.731
 Not detected 17/339 (5.0) 21/210 (10.0) < 0.001 -
 < 400 152/339 (44.8) 122/210 (58.1) - -
 400–9,999 54/339 (15.9) 25/210 (11.9) - -
 10,000–99,999 72/339 (21.2) 22/210 (10.5) - -
 > 100,000 44/339 (13.0) 20/210 (9.5) - -
HAART regimen
 PI treatment 198/413 (47.9) 153/239 (64.0) < 0.001 2.868 (1.419–5.797)§; 0.003
 NNRTI treatment 212/424 (28.5) 79/247 (32.0) 0.347 -
Smoking 263/417 (63.1) 152/236 (64.4) 0.931 -
BMI, kg/m2 21.76 (15.20–31.74) 23.42 (16.40–37.80) < 0.001*
 > 25 54/366 (14.8) 55/210 (26.2) 0.001 6.839 (2.673–17.495)§; < 0.001
WC, cm 79.7 (60–107) 85.2 (68–120) < 0.001* -
Obesity (waist/hip ratio) 6/211 (2.8) 11/122 (9.0) 0.014 -
Systolic blood pressure, mmHg 122 (92–181) 128 (95–205) 0.001*
 > 140 40/327 (12.2) 42/197 (21.3) 0.006 -
Fasting glucose, mg/dL 102 (62–432) 107 (70–358) 0.060*
 ≥ 126 28/349 (8.0) 29/200 (14.5) 0.017 -
FRS 5.81 (0–31) 9.05 (0–31) < 0.001*
 Low risk 255/320 (79.7) 123/190 (64.7) < 0.001 -
 Intermediate to high risk 65/320 (20.3) 67/190 (35.3) - -
The data were expressed as median (interquartile range) or number (percentage) or mean.
HIV = human immunodeficiency virus, OR = odds ratio, CI = confidence interval, HAART = highly active antiretroviral therapy, PI = protease inhibitor, NNRTI = non-nucleoside reverse transcriptase inhibitor, BMI = body mass index, WC = waist circumference, FRS = Framingham risk score.
*Mann-Whitney U-test, median (interquartile range); Pearson's χ2-test; Student's t-test; §Logistic regression analysis.

DISCUSSION

As the life expectancy of HIV-infected patients is increasing, metabolic complications are emerging as an issue of concern in managing HIV infections. This study evaluated the prevalence and characteristics of metabolic complications in HIV-infected Koreans.
As mentioned above, the prevalence of obesity based on BMI, obesity based on waist/hip ratio, hyperglycemia, hypercholesterolemia, hypoalphalipoproteinemia, hyper LDL-cholesterolemia, and hypertriglyceridemia were 16.4%, 19.0%, 10.4%, 6.0%, 44.2%, 5.5%, and 32.1%, respectively. These results are similar to the findings of a recent study conducted in an Asian population (19), but, compared to a previous Korean study (6), the prevalence of metabolic complications was relatively high. This difference seems to be the result of the difference in the study period between our study and the former study. Over a decade, there have been many changes in treatment trends; therefore, characteristics of HIV-infected patients have changed. When comparing the metabolic parameters between patient groups depending on the presence or absence of antiretroviral treatment, median total cholesterol, HDL-cholesterol, and triglyceride levels were high among patients who received antiretroviral therapy. Furthermore, the prevalence of dyslipidemia and lipodystrophy among comorbidities were also significantly high in the patients receiving antiretroviral treatment. This result is similar to previous study findings. Jantarapakde et al. (19) reported a higher prevalence of lipodystrophy and median total cholesterol, HDL-cholesterol, and triglycerides in patients who had received antiretroviral therapy. Moreover, increases in mean total cholesterol, HDL-cholesterol, and triglyceride levels were observed as the duration of antiretroviral therapy increased in previous studies in Asian patients (2021). Therefore, in consideration of these studies, it can be presumed that antiretroviral therapy influenced the prevalence of metabolic complications.
This is thought to be the result of the combination of the catabolic characteristics of HIV infection, lipodystrophy due to antiretroviral treatment, and the effects on metabolic profiles of antiretroviral therapy. In this cohort, 38.4% of the patients were not undergoing treatment for HIV infection at entry into the cohort, but some antiretroviral regimens such as PIs could cause dyslipidemia.
In comparison of the patient groups depending on the presence or absence of dyslipidemia, high BMI and the use of a PI-based regimen as antiretroviral therapy were significant risk factors for dyslipidemia on multivariate analysis. BMI is associated with the prevalence of dyslipidemia; and a Japanese study conducted by Ishikawa-Takata et al. (22) showed Japanese had a higher prevalence of dyslipidemia than Caucasian, even with low BMI. Since this study was also conducted on Asian, the results can also be referred to the Japanese study. The association between metabolic syndrome and PI exposure was frequently mentioned in previous studies (2324). In addition, dyslipidemia might be associated with lipodystrophy in HIV-infected patients. Fat accumulation, a type of lipodystrophy, can be induced by PI treatment (25). However, the results of a recently reported randomized controlled study indicated that there was no difference in the appearance of fat accumulation between treatment with PIs and other classes of antiretroviral drugs (26). In our cohort, other classes of antiretroviral drug such as non-nucleoside reverse transcriptase inhibitors (NNRTIs) did not show a significant correlation with the appearance of dyslipidemia. However, because about 40% of HIV-infected patients were receiving PI-based regimens, and the percentage of those receiving ritonavir-boosted lopinavir (22.1%), which is well known to induce dyslipidemia, was relatively high, the difference between the previous study and this study can be explained through this factor (data not shown).
CVD is an important predictor of mortality in the general population, and dyslipidemia is an important risk factor for the occurrence of CVD (27). In a previous cohort study of 4,061 patients, dyslipidemia in HIV-infected patients was found to be a major risk factor for CVD (28). Therefore, dyslipidemia caused by HIV infection and antiretroviral agents increases long-term mortality by increasing the risk of CVD. Additionally, HIV infection itself is a risk factor for the development of CVD (3).
This study has some limitations. First, the number of patients was small, and it limits our study results. Second, because of the cross-sectional design of this study, we could not evaluate the incidence of and associated factors for metabolic complications. Third, the distribution of antiretroviral regimens was not even because of the observational study design. Additionally, because we analyzed data from 2006 to 2013, this study could not reflect the current situation of Korea. Especially, single tablet regimens with integrase strand transfer inhibitor are introduced into Korea in 2014, and HAART regimens including integrase strand transfer inhibitor are more commonly used. That might change the prevalence of metabolic complications in Korea since 2014. Finally, there were significant missing values for some important variables such as FRS, smoking history, and so on.
In conclusion, HIV-infected Koreans had higher serum triglyceride levels compared to the general population; however, the prevalence of other metabolic abnormalities was not high. Analysis of patient groups based on the presence or absence of dyslipidemia revealed that antiretroviral therapy contributed to abnormality of lipid profiles; in particular, high BMI and the use of a PI-based regimen were statistically significant risk factor in multivariate analysis. To improve long-term cardiovascular outcomes in HIV-infected Koreans, clinicians should be vigilant regarding the proper management of metabolic abnormalities in these patients.

ACKNOWLEDGMENT

All authors thank the related practitioners involved in the Korea HIV/AIDS Cohort Study.

Notes

Funding This work was supported by the Research Program funded by the Korea Centers for Disease Control and Prevention (4800-4859-304, 2016-E51003-00).

DISCLOSURE The authors have no potential conflicts of interest to disclose.

Author Contributions

  • Conceptualization: Oh DH, Ahn JY, Kim JM, Choi JY.

  • Data curation: Kim SI, Kim MJ, Woo JH, Kim WJ, Baek JH, Kim SW, Choi JY, Han MG, Kang C, Kim JM, Choi JY.

  • Investigation: Choi BY, Lee MH.

  • Writing - original draft: Oh DH, Ahn JY, Choi JY.

References

1. Casalino E, Wolff M, Ravaud P, Choquet C, Bruneel F, Regnier B. Impact of HAART advent on admission patterns and survival in HIV-infected patients admitted to an intensive care unit. AIDS. 2004; 18:1429–1433.
2. Pau AK, Boyd SD. Recognition and management of significant drug interactions in HIV patients: challenges in using available data to guide therapy. Clin Pharmacol Ther. 2010; 88:712–719.
3. Triant VA, Lee H, Hadigan C, Grinspoon SK. Increased acute myocardial infarction rates and cardiovascular risk factors among patients with human immunodeficiency virus disease. J Clin Endocrinol Metab. 2007; 92:2506–2512.
4. Sobieszczyk ME, Hoover DR, Anastos K, Mulligan K, Tan T, Shi Q, Gao W, Hyman C, Cohen MH, Cole SR, et al. Prevalence and predictors of metabolic syndrome among HIV-infected and HIV-uninfected women in the Women’s Interagency HIV Study. J Acquir Immune Defic Syndr. 2008; 48:272–280.
5. Nguyen KA, Peer N, Mills EJ, Kengne AP. A meta-analysis of the metabolic syndrome prevalence in the global HIV-infected population. PLoS One. 2016; 11:e0150970.
6. Choe YJ, Park SW, Kim HB, Park WB, Lee KD, Oh MD, Choe KW. Metabolic complications in Korean HIV/AIDS patients receiving highly active anti-retroviral therapy. Infect Chemother. 2004; 36:197–206.
7. Choi H, Jeong SJ, Lee HS, Chin BS, Choi SH, Han SH, Kim MS, Kim CO, Choi JY, Song YG, et al. Clinical manifestations for diabetes mellitus in HIV-infected Koreans on highly active antiretroviral therapy. Korean J Med. 2008; 74:506–514.
8. Han SH, Chin BS, Choi HK, Shin SY, Chae YT, Baek JH, Kim CO, Choi JY, Song YG, Lee HC, et al. Prevalence of and clinical factors associated with lipoatrophy in HIV-infected Koreans receiving highly active antiretroviral therapy. Tohoku J Exp Med. 2009; 219:145–153.
9. Han SH, Chin BS, Lee HS, Jeong SJ, Choi HK, Kim CO, Choi JY, Song YG, Lee HC, Kim JM. Serum retinol-binding protein 4 correlates with obesity, insulin resistance, and dyslipidemia in HIV-infected subjects receiving highly active antiretroviral therapy. Metabolism. 2009; 58:1523–1529.
10. Jeong SJ, Chin BS, Chae YT, Jin SJ, Ku NS, Baek JH, Han SH, Kim CO, Choi JY, Song YG, et al. Serum retinol-binding protein-4 levels are increased in HIV-infected subjects with metabolic syndrome receiving highly active antiretroviral therapy. Yonsei Med J. 2012; 53:1211–1215.
11. Kim SB, Kim YC, Kim MH, Song JE, Oh DH, Ahn JY, Ku NS, Kim HW, Jeong SJ, Han SH, et al. A comparison of the predicted risk for cardiovascular disease between HIV-infected and uninfected persons in Korea. Scand J Infect Dis. 2013; 45:855–862.
12. Chobanian AV, Bakris GL, Black HR, Cushman WC, Green LA, Izzo JL Jr, Jones DW, Materson BJ, Oparil S, Wright JT Jr, et al. The seventh report of the joint national committee on prevention, detection, evaluation, and treatment of high blood pressure: the JNC 7 report. JAMA. 2003; 289:2560–2572.
13. American Diabetes Association. Diagnosis and classification of diabetes mellitus. Diabetes Care. 2010; 33:Suppl 1. S62–S69.
14. National Cholesterol Education Program (NCEP) Expert Panel on Detection, Evaluation, and Treatment of High Blood Cholesterol in Adults (Adult Treatment Panel III). Third Report of the National Cholesterol Education Program (NCEP) Expert Panel on Detection, Evaluation, and Treatment of High Blood Cholesterol in Adults (Adult Treatment Panel III) final report. Circulation. 2002; 106:3143–3421.
15. Clinical guidelines on the identification, evaluation, and treatment of overweight and obesity in adults--the evidence report. National Institutes of Health. Obes Res. 1998; 6:Suppl 2. 51S–209S.
16. Screening for lipid disorders in children and adolescents: recommendation statement. Am Fam Physician. 2016; 94:Online.
17. Carr A, Samaras K, Burton S, Law M, Freund J, Chisholm DJ, Cooper DA. A syndrome of peripheral lipodystrophy, hyperlipidaemia and insulin resistance in patients receiving HIV protease inhibitors. AIDS. 1998; 12:F51–F58.
18. D'Agostino RB Sr, Vasan RS, Pencina MJ, Wolf PA, Cobain M, Massaro JM, Kannel WB. General cardiovascular risk profile for use in primary care: the Framingham Heart Study. Circulation. 2008; 117:743–753.
19. Jantarapakde J, Phanuphak N, Chaturawit C, Pengnonyang S, Mathajittiphan P, Takamtha P, Dungjun N, Pinyakorn S, Pima W, Prasithsirikul W, et al. Prevalence of metabolic syndrome among antiretroviral-naive and antiretroviral-experienced HIV-1 infected Thai adults. AIDS Patient Care STDS. 2014; 28:331–340.
20. Gupta V, Biswas A, Sharma SK. Metabolic and body composition changes after six months of highly active antiretroviral therapy in northern Indian patients. Int J STD AIDS. 2011; 22:46–49.
21. Wu PY, Hung CC, Liu WC, Hsieh CY, Sun HY, Lu CL, Wu H, Chien KL. Metabolic syndrome among HIV-infected Taiwanese patients in the era of highly active antiretroviral therapy: prevalence and associated factors. J Antimicrob Chemother. 2012; 67:1001–1009.
22. Ishikawa-Takata K, Ohta T, Moritaki K, Gotou T, Inoue S. Obesity, weight change and risks for hypertension, diabetes and hypercholesterolemia in Japanese men. Eur J Clin Nutr. 2002; 56:601–607.
23. Gazzaruso C, Sacchi P, Garzaniti A, Fratino P, Bruno R, Filice G. Prevalence of metabolic syndrome among HIV patients. Diabetes Care. 2002; 25:1253–1254.
24. Samaras K, Wand H, Law M, Emery S, Cooper D, Carr A. Prevalence of metabolic syndrome in HIV-infected patients receiving highly active antiretroviral therapy using International Diabetes Foundation and Adult Treatment Panel III criteria: associations with insulin resistance, disturbed body fat compartmentalization, elevated C-reactive protein, and [corrected] hypoadiponectinemia. Diabetes Care. 2007; 30:113–119.
25. Wohl D, Scherzer R, Heymsfield S, Simberkoff M, Sidney S, Bacchetti P, Grunfeld C; FRAM Study Investigators. The associations of regional adipose tissue with lipid and lipoprotein levels in HIV-infected men. J Acquir Immune Defic Syndr. 2008; 48:44–52.
26. McComsey GA, Moser C, Currier J, Ribaudo HJ, Paczuski P, Dubé MP, Kelesidis T, Rothenberg J, Stein JH, Brown TT. Body composition changes after initiation of raltegravir or protease inhibitors: ACTG A5260s. Clin Infect Dis. 2016; 62:853–862.
27. Feeney ER, Mallon PW. HIV and HAART-associated dyslipidemia. Open Cardiovasc Med J. 2011; 5:49–63.
28. Kaplan RC, Kingsley LA, Sharrett AR, Li X, Lazar J, Tien PC, Mack WJ, Cohen MH, Jacobson L, Gange SJ. Ten-year predicted coronary heart disease risk in HIV-infected men and women. Clin Infect Dis. 2007; 45:1074–1081.
TOOLS
ORCID iDs

Dong Hyun Oh
https://orcid.org/0000-0002-9990-6042

Jin Young Ahn
https://orcid.org/0000-0002-3740-2826

Sang Il Kim
https://orcid.org/0000-0001-9361-7381

Min Ja Kim
https://orcid.org/0000-0002-2125-7521

Jun Hee Woo
https://orcid.org/0000-0003-4512-5352

Woo Joo Kim
https://orcid.org/0000-0002-4546-3880

Ji Hyeon Baek
https://orcid.org/0000-0002-1783-6950

Shin-Woo Kim
https://orcid.org/0000-0002-3755-8249

Bo Youl Choi
https://orcid.org/0000-0003-0115-5736

Mi Hwa Lee
https://orcid.org/0000-0002-9048-5552

Ju-yeon Choi
https://orcid.org/0000-0003-3477-8569

Myung Guk Han
https://orcid.org/0000-0002-3543-1826

Chun Kang
https://orcid.org/0000-0003-4318-5247

June Myung Kim
https://orcid.org/0000-0002-0337-8573

Jun Yong Choi
https://orcid.org/0000-0002-2775-3315

Similar articles