Journal List > J Korean Med Sci > v.32(9) > 1108429

Ahn, Kim, Lee, and Park: Carbohydrate Intake Exhibited a Positive Association with the Risk of Metabolic Syndrome in Both Semi-Quantitative Food Frequency Questionnaires and 24-Hour Recall in Women

Abstract

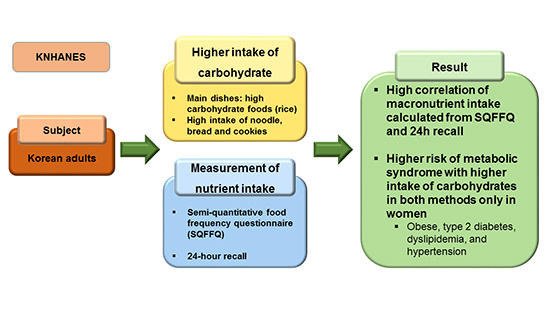
We compared the usual nutrient intake in both the semi-quantitative food frequency questionnaire (SQFFQ) and 24-hour recall methods and determined the association between metabolic syndrome (MetS) risk and nutrient intake calculated by both methods in Korea National Health and Nutrition Examination Survey (KNHANES; 2012–2014) data. Adjusted odds ratios for MetS were calculated according to the intake of macronutrients, measured by the 2 methods in 10,286 adults, while controlling for covariates associated with MetS. Fat and carbohydrate intake (energy percent) calculated by 24-hour recall and SQFFQ was significantly different between the MetS and non-MetS groups, particularly in women. The differences in other nutrient intakes determined by both methods were mainly non-significant. The correlation coefficients between the 2 methods were about 0.4 for most nutrients except total vitamin A and iron (Fe). Energy intake according to gender and MetS presence was similar between the 2 methods. Carbohydrate intake exhibited a positive association with the MetS risk, while fat intake showed a negative association in both methods. The association exhibited a gender interaction with carbohydrate and fat intake calculated by 24-hour recall: women exhibited a significant association. However, for the SQFFQ a gender interaction was evident only for carbohydrate intake. In diet quality index of SQFFQ the adequacy of vegetables and total fat intake was higher in the non-MetS than the MetS. In conclusion, the MetS prevalence exhibited a positive association with carbohydrate intake only in women, as assessed by 24-hour recall and SQFFQ. The SQFFQ can be used to assess the association between usual food intake and MetS risk in large population studies.

Graphical Abstract

jkms-32-1474-ab001

Introduction

Metabolic syndrome (MetS) represents a cluster of symptoms including abdominal obesity, dyslipidemia, and elevated blood pressure and glucose. MetS can contribute to pro-inflammatory and pro-thrombotic states (1). Although MetS results from a disturbance in energy, glucose and lipid metabolism, the interrelation of these factors is not completely understood, although they are known to increase insulin resistance. Caucasians with MetS have a twofold higher risk of cardiovascular disease in comparison to those without MetS (2); in Asian populations, MetS is associated with even greater risks of cardiovascular diseases (3). The known risk factors of MetS are dietary fat, calcium (Ca), physical activity, smoking, and stress (45). Reducing the intake of saturated fat has long been recommended but this advice has been modified somewhat (6). A systematic review reported that, when fat intake represents 35%–45% of total energy intake, it is unlikely to be associated with cardiovascular disease outcomes (7). In addition, replacement of saturated fat by carbohydrates, particularly refined carbohydrates, elevates serum triglyceride (TG) and low-density lipoprotein (LDL) cholesterol and reduces high-density lipoprotein (HDL) cholesterol (8). In a previous study, low fat intake (< 15% of total energy intake) was associated with an increased risk of MetS, and especially with serum TG and HDL levels (9). Thus, it would be interesting to determine whether fat intake is associated with the risk of MetS.
This association between nutrient intake and the risk of MetS should be assessed according to usual nutrient intake data. However, the optimum method for determining usual intake of nutrients is unclear. Food intake can be assessed using several methods, such as 24-hour recall, 3-day food records, and semi-quantitative food frequency questionnaires (SQFFQs); each of these methods has advantages and disadvantages (10). Korean dishes also comprise various foods, cooking oils, and seasonings. Accurate estimation of the dietary intake of nutrients is difficult in Koreans. Daily food and nutrient intake can be measured relatively accurately through the 24-hour recall method by a skilled dietician, and by using 3-day food records, in conjunction with education regarding portion sizes (10). However, an individual's usual intake of nutrients cannot be determined unless multiple measurements are conducted during all 4 seasons of the year. In large-scale population surveys, such as the Korea National Health and Nutrition Examination Survey (KNHANES), multiple dietary measurements are not feasible. SQFFQs are an alternative method for measuring usual food intake over long periods (11), although SQFFQs may not measure correct nutrient intake since it does not include some dishes in the SQFFQ list. In 2012, the SQFFQ used in the KNHANES changed from a 63- to 112-item instrument, to more accurately reflect Korean-style dishes. The list of foods in SQFFQ are selected for the common foods consumed from Koreans during a year on a daily basis. Kim et al. (12) demonstrated that the updated KNHANES SQFFQ had good reproducibility, in terms of estimating nutrient intake (r2 = 0.54) and intake by food group (r2 = 0.54), as shown by the similarity between the data of 2 SQFFQs completed about 9 months apart by 126 adults aged 20–65 years. In addition, the validity of SQFFQ was acceptable since correlation coefficients were about 0.4 for all nutrients between the new SQFFQ and 3-day dietary records completed 4 times (once in each season of the year) (12). Thus, the SQFFQ used in the KNHANES from 2012 onward exhibited acceptable reproducibility and modest validity in the study of Kim et al. (12). However, that study had several limitations. First, the subjects were drawn from metropolitan areas only; among rural populations, the validity of the SQFFQ may be higher. Furthermore, the study did not measure other factors that influence food intake, such as socioeconomic, biochemical and anthropometric variables. The 3-day food records are not used for measuring nutrient intakes in large population studies, including KNHANES; rather, 24-hour recall is applied to determine food intake. If the nutrient intakes from both SQFFQs and 24-hour recall show similar associations to the risk of MetS, the newly developed SQFFQ list can be validated for studying the association between nutrient intake and the risk of diseases in the Korean population.
It would be instructive to determine the validity of the newly developed KNHANES SQFFQ based on 24-hour recall data, and to compare the association between risk of MetS and nutrient intake using the 24-hour recall vs. SQFFQ method. We hypothesized that the new SQFFQ would show acceptable validity, and that the association between macronutrient intake and risk of MetS in Korean adults would be similar using the 24-hour recall vs. new SQFFQ method. We tested this hypothesis in adults aged 19–65 years using KNHANES data from 2012–2014, which constitutes a representative sample of the non-institutionalized civilian population.

MATERIALS AND METHODS

Design and data collection

This study utilized the 3-year KNHANES data from 2012 to 2014. KNHANES is annually conducted using a rolling sampling design that involves a complex, stratified, multistage, probability-cluster survey of a representative sample of the civilian Korean population. The survey is performed by the Korean Centers for Disease Control and Prevention and Korean Ministry of Health and Welfare, and it has 3 components: health interview, health examination, and nutrition surveys (13).
The present cross-sectional analysis was restricted to adults aged 19–65 years who completed both the health examination survey and nutrition survey of the KNHANES (n = 10,286). Detailed descriptions of the survey designs have been reported previously (14). Briefly, anthropometric parameters—such as height, weight, and body fat—were determined. The height and weight of the participants were measured while they were wearing light clothing and no shoes. Body mass index (BMI) was calculated as the weight in kilograms divided by the square of the height in meters (kg/m2). Obesity was categorized into 3 groups according to the Asian obesity definition recommended by the International Obesity Task Force and the World Health Organization Regional Office for the Western Pacific Region (15): lean (BMI < 18.5), normal (18.5 ≤ BMI < 25), and obese (BMI ≥ 25). Participants were classified into 5 groups according to age at the time of the health interview.
The age, area of residence, education level, occupation, income, physical activity, smoking history, and alcohol intake of the participants were obtained during the health-related interview. These parameters were categorized on the basis of the previous reports (1014). Area of residence was divided into urban (defined according to the administrative divisions of a city) and rural areas. Income level was categorized into 4 quartiles and education level was categorized into 3 groups: below high school, high school, and college or higher. Occupation was categorized into 4 groups: clerical, manual, technical, and unemployed. Smoking status was defined based on self-reported cigarette use: never-smokers had smoked fewer than 100 cigarettes in their lifetime, while participants who had smoked 100 or more cigarettes were considered as past or current smokers, according to current tobacco use status. Alcohol consumption was assessed by asking the participants about their drinking behavior during the month prior to the interview, including the average frequency (days per month) and amount (in mL) of alcohol consumed on a single occasion. The data were converted to give the amount of pure alcohol consumed per day (g/day). Alcohol consumption status was categorized into 4 groups according to average daily consumption: nondrinkers, light drinkers (1–15 g), moderate drinkers (16–30 g), and heavy drinkers (> 30 g). Regular exercise was defined as ≥ 30 minutes moderate-intensity exercise at least 5 times per week, or ≥ 20 minutes vigorous exercise at least 3 times per week.

Definition of MetS

MetS was defined as the presence of 3 or more of the following 5 categories: 1) elevated blood pressure (average systolic blood pressure ≥ 130 mmHg or diastolic blood pressure ≥ 85 mmHg) or current blood pressure medication use; 2) low HDL-cholesterol level (< 40 mg/dL); 3) elevated serum TG level (≥ 150 mg/dL) or current anti-dyslipidemic medication use; 4) elevated fasting blood glucose level (≥ 100 mg/dL) or current anti-diabetic medication use; and 5) abdominal obesity (waist circumference ≥ 90 cm) (14).

Laboratory testing

Blood samples were collected from the participants in the morning who had an overnight fast. Serum was separated from blood by centrifugation and the serum concentrations of glucose, HDL, and TG were measured using a Hitachi automatic analyzer 7600 (Hitachi, Tokyo, Japan). LDL was calculated using the Friedewald equation:
LDL = total cholesterol − HDL − (TG/5.0)
if the TG concentration was not above 400 mg/dL. When the TG concentration was above 400 mg/dL, LDL concentration was measured directly using a Hitachi automatic analyzer 7600. All clinical analyses were conducted by the Neodin Medical Institute, a laboratory certified by the Korean Ministry of Health and Welfare.

Assessment of nutrient intake

All participants were instructed to maintain their usual dietary habits prior to the nutrition survey. Daily food intake was measured using the 24-hour recall and SQFFQ methods. The 24-hour dietary recalls were supervised by a trained dietician during in-person interviews conducted in mobile examination centers. The participants provided data on their intake of foods, including type and amount, during the past 24 hours (midnight to midnight). Daily intake of calories and nutrients was calculated using Can-Pro nutrient intake assessment software ver. 2.0, developed by the Korean Nutrition Society (Seoul, Korea), and the data of the nutrient intake from 24-hour recall and SQFFQ were provided in KNHANES.

Dietary assessment using SQFFQs

Since the lists of food intakes in each subject were not provided from 24-hour recall assessment, DQI was calculated from SQFFQ. Food intake data were collected using a validated SQFFQ. The SQFFQ, which covered 112 food groups derived from the KNHANES (2012–2014 data), was developed by the Ministry of Health and Welfare (12). The validity and reproducibility of the SQFFQ were acceptable for calculation of participants' average consumption of food items during the previous year (12). Food intake frequency was divided into the following 9 categories for all 112 items: never or seldom, once per month, 2 to 3 times per month, once or twice per week, 3 to 4 times per week, 5 to 6 times per week, once per day, twice per day, and 3 or more times per day. The participants indicated the frequency of intake of each food based on the portion size definitions provided. Respondents indicated whether the amount of a given food that they consumed in one sitting was more than, equal to, or less than 1 portion, based on pictures of the foods. Daily intake was computed based on the midpoint of the assigned frequencies of each category for each food item. Food intake was calculated by multiplying the midpoints of frequencies for each food category by the number of times each food. Using the SQFFQ food intake data, intakes of energy and nutrients (such as protein, carbohydrates, fat, fiber, total vitamin A, vitamin B-1, vitamin C, Ca, and Fe) were calculated using the Can-Pro 2.0 software.

Dietary quality index (DQI) using SQFFQ

DQI is schemed to evaluate person's quality of food intake by the variety, adequacy, and moderation of foods (16). Food variety in the diet was examined in 2 aspects such as overall variety and variety within protein sources. At least one serving of food per day from each of the 5 food groups such as meat/poultry/fish/egg, dairy products, grains, fruits, and vegetables was given the maximum overall variety score, 15. If the intake of any 1 food group was missing, the score was reduced from the maximum score of 15 by 3 points. Variety intake within protein sources including meat, poultry, fish, dairy, beans, and eggs was estimated. In variety intake of protein sources, more than half the serving size per day was considered to be meaningful consumption. When a person had ≥ 3 different protein sources per day, the highest score of 5 points was given. As the number of different protein sources decreased to 2, 1, and 0, the scores were also reduced as 3, 1, and 0 points, respectively.
Adequate intake of each food group (grain, vegetable, and fruit) and some nutrients (protein, fiber, Ca, Fe, and vitamin C) was scored. The scores for the 8 components in each category were assigned on the basis of the percentage of the recommended intakes (RIs) on a continuous scale, ranging from 0 points for 0% to 5 points for 100%. The RI of fruits, vegetables, grains, and fiber was dependent on energy intake. Daily consumption of ≥ 2 to 4 servings of fruits and ≥ 3 to 5 servings of vegetables was given as the highest score of 5 points, depending on 3 levels of energy intake (1,700, 2,200, and 2,700 kcal). The highest score for the grain and fiber groups was given in daily intakes of > 6, 9, and 11 servings from the grain group and > 20, 25, and 30 g of fiber for the 3 energy intake categories, respectively. Protein intake was considered as adequate (highest score, 5) when the protein proportion of total energy intake was > 10%. When the intake of Fe, Ca, and vitamin C met the dietary reference intakes (DRIs) according to age and gender, the highest score for their adequacy was given. The individual intake was lower every 10% from the DRI, the score was reduced by point 1. Fat intake was divided into ≤ 20, 20–30, > 30 energy % of total energy intake and they were given score 6, 3, or 0, respectively.

Statistical analysis

Statistical analyses were performed using SAS (ver. 9.4; SAS Institute, Cary, NC, USA) and SUDAAN software (release 11.0; Research Triangle Institute, Research Triangle Park, NC, USA). These software packages incorporate sample weights and adjust analyses to take account of complex sample designs. Survey sample weights were used in all analyses to obtain intake estimates representative of the non-institutionalized civilian Korean population.
Frequency distributions of categorical demographic and personal behavior related variables were obtained according to the presence of MetS, and statistical significance was determined by the χ2 test.
The mean (± standard deviation) intake of each nutrient, as determined by the 24-hour recall and SQFFQ methods, was calculated according to gender. Statistical significance was determined by 2-way analysis of variance (ANOVA) and multiple comparisons were conducted using Tukey's test.
Next, Pearson's correlation was used to assess the association between 24-hour recall and SQFFQ data, using the “Proc vargen” function of SUDAAN, which computes point estimates and their associated variances for correlations in survey populations.
Finally, adjusted odds ratios (ORs) and 95% confidence intervals (CIs) for MetS risk were calculated using logistic regression analysis as a continuous variable of macronutrient intake by 5% decrease or as categorical variables of macronutrient intake divided by tertiles after covariate adjustment in daily intake of carbohydrate, fat, and protein calculated using the 24-hour recall and SQFFQ methods. Covariates included sex, age, area of residence, occupation, income, education level, drinking status, obesity, and physical activity.

Ethics statement

The Institutional Review Board of the Korean Centers for Disease Control and Prevention approved the survey (approval No. 2008-04EXP-01-C, 2009-01CON-03-2C, 2010-02CON-21-C, and 2015-01-HR-05-01). Informed consent was replaced by the questionnaire submission.

Results

Characteristics of subjects in the MetS and non-MetS groups

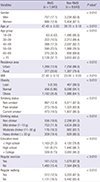
The general characteristics of subjects, according to the presence of MetS, are listed in Table 1. The prevalence of MetS differed according to gender and age. The prevalence of MetS was 17.1% and 12.8% in 19–65-year-old Korean men and women, respectively (KNHANES 2012–2014 data). The prevalence of MetS increased with older age. Subjects residing in rural areas had a higher prevalence of MetS. BMI was markedly higher in the MetS group compared to the non-MetS group (27.4 ± 0.12 vs. 23.0 ± 0.05). Smoking and drinking status were significantly associated with the prevalence of MetS: current smokers had a higher prevalence of MetS, whereas mild drinkers had a lower prevalence of MetS than moderate or severe drinkers. Education level was also associated with the prevalence of MetS, while regular exercise and regular walking were associated with a lower prevalence of MetS.
Table 1

General characteristics by MetS of adult population (age of 19–64) according to KNHANES 2012–2014

jkms-32-1474-i001
Variables MetS (n = 1,643) Non-MetS (n = 8,643) P value*
Gender < 0.010
 Men 757 (17.1) 3,239 (82.8)
 Women 886 (12.8) 5,404 (87.1)
Age, yr 47.40 ± 0.33 39.70 ± 0.18 < 0.010
Age group < 0.010
 19–29 63 (4.42) 1,490 (95.5)
 30–39 222 (10.5) 2,212 (89.4)
 40–49 398 (17.2) 2,097 (82.7)
 50–59 590 (23.5) 1,988 (76.5)
 60–69 370 (30.3) 856 (69.6)
 ≥ 70 2,128 (37.7) 3,653 (62.2)
Residence area < 0.010
 Urban 1,266 (13.9) 7,256 (86.0)
 Rural 377 (20.6) 1,387 (79.4)
BMI 27.40 ± 0.12 23.00 ± 0.05 < 0.010
Obesity < 0.010
 Lean 3 (0.50) 467 (99.5)
 Normal 456 (5.86) 6,096 (94.1)
 Obese 1,182 (35.8) 1,986 (64.1)
Smoking status < 0.010
 Non-smoker 897 (12.4) 5,511 (87.5)
 Past-smoker 273 (16.0) 1,325 (83.9)
 Current smoker 473 (19.5) 1,807 (80.5)
Drinking status < 0.010
 Non-drinker 556 (18.6) 2,299 (81.3)
 Mild drinker (1–10 g) 702 (11.9) 4,634 (88.0)
 Moderate drinker (11–30 g) 176 (16.2) 882 (83.7)
 Heavy drinker (≥ 30 g) 209 (19.4) 828 (80.5)
Education level < 0.010
 < High school 1,163 (21.2) 4,120 (78.8)
 High school 141 (9.21) 1,440 (90.7)
 ≥ College 339 (9.73) 3,083 (90.2)
Regular exercise < 0.010
 Yes 161 (12.0) 1,079 (87.9)
 No 1,482 (15.4) 7,564 (84.5)
Regular walking < 0.010
 Yes 512 (12.5) 3,203 (87.5)
 No 1,131 (16.5) 5,440 (83.4)
Data are shown as mean ± standard error or number (%).
MetS = metabolic syndrome, KNHANES = Korea National Health and Nutrition Examination Survey, Non-MetS = no metabolic syndrome, BMI = body mass index.
*Chi-square test for categorical variables and t-test for continuous variables.

Daily nutrient intake of subjects in the MetS and non-MetS groups

Table 2 shows the daily intake of energy, fat, Ca, Fe, vitamin A, vitamin B-1, and vitamin C, according to MetS status and gender, according to the 24-hour recall and SQFFQ methods. With the 24-hour recall method, the intake of all nutrients was markedly higher in men than in women, whereas the absolute intake of energy and nutrients in the MetS group was not significantly different from the non-MetS group after adjusting for age group, residence, smoking status, drinking status, education level, physical activities, and BMI. The proportion of energy intake attributable to fat was lower in the MetS vs. non-MetS group for both genders, whereas the proportion of energy intake attributable to carbohydrate was higher in the MetS group, only in women (Table 2). Intake of minerals (Ca and Fe) and vitamins (vitamin A and vitamin B-1) was higher in men than in women, likely due to the higher overall energy intake of the former group, whereas there was no difference between the MetS and non-MetS groups. Vitamin C intake was significantly higher in non-MetS group than MetS group only in women.
Table 2

Major nutrient intake according to genders and MetS calculated from 24-hour recall and SQFFQs methods

jkms-32-1474-i002
Variables Men Women
MetS (n = 757) Non-MetS (n = 3,239) MetS (n = 886) Non-MetS (n = 5,404)
24-hour recall
 Energy, kcal 2,458 (2,363–2,554) 2,533 (2,489–2,577) 1,789 (1,726–1,853) 1,797 (1,772–1,822)
 Protein, g 91.7 (87.2–96.2) 90.8 (88.9–92.7) 63.6 (60.6–66.5) 64.6 (63.5–65.7)
 Carbohydrate, g 350.7 (339.3–362.1) 361.2 (355.5–366.9) 288.8 (278.1–299.5) 282.6 (278.6–286.6)
 Total fat, g 56.6 (52.9–60.3) 59.4 (57.7–61.0) 39.8 (37.4–42.1) 42.1 (41.2–43.1)
 Protein, En% 14.6 (14.2–14.9) 14.3 (14.1–14.4) 14.1 (13.7–14.5) 14.3 (14.1–14.4)
 Carbohydrate, En% 60.0 (58.8–61.1) 59.3 (58.8–59.8) 65.5 (64.4–66.6) 64.1 (63.7–64.5)*
 Total fat, En% 19.3 (18.6–20.0) 20.2 (19.9–20.5)* 19.4 (18.6–20.2) 20.2 (20.0–20.5)
 Ca, mg 547.3 (518.4–576.2) 577.4 (564.0–590.9) 461.3 (430.7–491.9) 478.0 (467.5–488.5)
 Fe, mg 19.0 (17.8–20.2) 20.1 (19.1–21.1) 14.8 (13.9–15.6) 15.2 (14.9–15.5)
 Na, mg 5,194 (4,902–5,487) 5,444 (5,297–5,591) 3,758 (3,513–4,003) 3,814 (3,728–3,899)
 Vitamin A, μg RE 891.5 (797.9–985.0) 923.5 (875.1–971.8) 761.1 (673.5–848.8) 788.8 (735.8–841.9)
 Vitamin B1, mg 2.19 (2.07–2.32) 2.23 (2.18–2.29) 1.58 (1.49–1.67) 1.65 (1.62–1.68)
 Vitamin C, mg 105.1 (91.50–118.7) 106.7 (102.0–111.5) 99.60 (89.02–110.1) 112.1 (107.0–117.3)*
SQFFQs
 Energy, kcal 2,512 (2,436–2,588) 2,497 (2,462–2,531) 1,925 (1,868–1,982) 1,892 (1,869–1,915)
 Protein, g 81.0 (77.8–84.3) 80.0 (78.6–81.5) 64.1 (61.8–66.4) 64.2 (63.2–65.2)
 Carbohydrate, g 382.8 (372.5–393.2) 376.9 (372.2–381.6) 316.7 (307.8–325.7) 306.6 (303.1–310.1)*
 Total fat, g 50.6 (48.2–52.9) 50.0 (48.9–51.1) 38.3 (36.6–40.1) 39.6 (38.8–40.3)
 Protein, En% 12.6 (12.4–12.8) 12.6 (12.5–12.7) 13.1 (12.9–13.3) 13.3 (13.3–13.4)
 Carbohydrate, En% 62.1 (61.4–62.8) 61.7 (61.4–62.0) 66.9 (66.3–67.5) 65.7 (65.5–66.0)*
 Total fat, En% 17.2 (16.8–17.7) 17.3 (17.1–17.5) 17.2 (16.7–17.6) 18.1 (18.0–18.3)*
 Ca, mg 547.7 (525.9–569.6) 550.7 (540.3–561.0) 473.7 (452.1–495.3) 494.9 (487.1–502.8)
 Fe, mg 16.0 (15.4–16.6) 15.8 (15.5–16.1) 13.6 (13.2–14.1) 13.6 (13.4–13.8)
 Na, mg 4,013 (3,838–4,188) 3,944 (3,865–4,023) 3,195 (3,064–3,326) 3,208 (3,157–3,259)
 Vitamin A, μg RE 681.1 (649.2–713.1) 675.1 (660.8–689.3) 625.6 (597.2–654.0) 645.7 (633.9–657.6)
 Vitamin B-1, mg 2.20 (2.12–2.27) 2.18 (2.14–2.21) 1.82 (1.76–1.88) 1.81 (1.78–1.83)
 Vitamin C, mg 106.9 (100.5–113.4) 109.0 (105.8–112.3) 121.8 (114.3–129.3) 127.5 (124.2–130.8)
Values represented mean (95% CIs) after adjusting for age group, residence, smoking status, drinking status, education level, physical activities, and BMI.
MetS = metabolic syndrome, SQFFQs = semi-quantitative food frequency questionnaires, Non-MetS = no metabolic syndrome, Ca = calcium, Fe = iron, Na = natrium, CI = confidence interval, BMI = body mass index.
*Significantly different between MetS and Non-MetS groups at P < 0.05.
There were significant differences between the MetS and non-MetS groups in carbohydrate energy percent calculated by SQFFQ only in women after adjusting for age group, residence, smoking status, drinking status, education level, physical activities, and BMI (Table 2). These results indicated that carbohydrate intake exhibited the similar trend in 24-hour recall and SQFFQ. Overall, intake of energy and macronutrient measured by SQFFQ showed a similar trend with that by 24-hour recall in both genders. However, the intake of Fe, natrium (Na), vitamin A, and vitamin C was somewhat different between the 24-hour recall and SQFFQ methods (Table 2) although the micronutrient intake except vitamin C did not show significant differences between the MetS and non-MetS groups.

Diet quality index measured by SQFFQ

Intake of variety foods in overall food groups was not significantly different between the MetS and non-MetS groups in both genders after adjusting for age group, residence, smoking status, drinking status, education level, physical activities, and BMI (Table 3). Variety intake within the protein sources was not also significantly different between the MetS and non-MetS groups in both genders. In the aspect of adequacy in food groups, vegetable intake was significantly higher in non-MetS group than MetS group in women, not men. Intake of other food groups was not significantly different between the MetS and non-MetS (Table 3). In addition, the adequacy of protein, fiber, Ca, Fe, and vitamin C intake showed no significant differences between the non-MetS and the MetS groups (Table 3). These results of protein, fiber, Ca, and Fe adequacy intake from SQFFQ was consistent with their intake from 24-hour recall in Table 2. Although vitamin C was significantly lower in the MetS group than the non-MetS group in 24-hour recall results but not SQFFQ results, the adequacy intake of vegetable intake was significantly higher in the non-MetS group than the MetS group in SQFFQ. These results indicated that the usual food intake could be determined by both 24-hour recall and SQFFQ. Scores for the moderation of total fat intake was lower in the non-MetS group than MetS group, in women and it was consistent with 24-hour recall group since the lower score means lower fat intake (Table 3). The moderation of Na intake was not significantly different between the MetS and the non-MetS groups (Table 3). Thus, adequacy of food intake and usual nutrient intake, not variety of food intake, should be meaningful to use SQFFQ in KNHANES.
Table 3

Diet quality index (mean and 95% CI) according to genders and MetS calculated from SQFFQs

jkms-32-1474-i003
Variables Men Women
MetS (n = 757) Non-MetS (n = 3,239) MetS (n = 886) Non-MetS (n = 5,404)
Variety
 Overall food group* 7.46 (7.17–7.75) 7.49 (7.34–7.64) 8.35 (8.04–8.66) 8.65 (8.52–8.77)
 Variety for protein source 0.51 (0.43–0.60) 0.52 (0.48–0.56) 0.56 (0.47–0.65) 0.62 (0.59–0.66)
Adequacy
 Grain group 3.73 (3.65–3.81) 3.65 (3.61–3.69) 3.65 (3.57–3.73) 3.59 (3.56–3.63)
 Vegetable group 4.77 (4.71–4.83) 4.77 (4.75–4.80) 4.85 (4.80–4.89) 4.91 (4.90–4.92)§§
 Fruit group 4.18 (4.09–4.26) 4.12 (4.08–4.17) 4.04 (3.95–4.13) 4.07 (4.03–4.10)
 Protein§ 2.89 (2.83–2.95) 2.92 (2.90–2.95) 3.08 (3.02–3.14) 3.08 (3.06–3.10)
 Fiber 0.52 (0.42–0.62) 0.49 (0.44–0.54) 0.51 (0.40–0.61) 0.47 (0.44–0.51)
 Ca 2.43 (2.33–2.53) 2.43 (2.39–2.48) 2.35 (2.27–2.44) 2.40 (2.37–2.44)
 Fe 3.78 (3.73–3.82) 3.76 (3.74–3.78) 3.05 (2.98–3.13) 3.03 (2.99–3.06)
 Vitamin C** 2.60 (2.45–2.75) 2.72 (2.65–2.79) 2.70 (2.58–2.82) 2.77 (2.72–2.82)
Moderation
 Total fat†† 5.07 (4.95–5.18) 5.00 (4.95–5.05) 4.92 (4.80–5.04) 4.79 (4.74–4.83)‖‖
 Sodium‡‡ 1.93 (1.73–2.13) 1.98 (1.88–2.07) 2.90 (2.70–3.11) 2.89 (2.81–2.97)
Values represented mean (95%CIs) after adjusting for age group, residence, smoking status, drinking status, education level, physical activities, and BMI.
MetS = metabolic syndrome, Non-MetS = no metabolic syndrome, SQFFQs = semi-quantitative food frequency questionnaires, CI = confidence interval, BMI = body mass index, RI = recommended intake.
*≥ 1 serving from each food group/day was 15 and scores were lower by 3 from 15 by missing every 1 any food group; ≥ 3, 2–3, < 2, and 0 servings from different protein food sources (meat, poultry, fish, dairy, beans, eggs) per day was 5, 3, 1, and 0, respectively; Vegetable intake (≥ 3–5, < 3, and 0 serving/day), fruit (≥ 2–4, < 2, and 0 serving/day), and grain (≥ 2, < 2, and 0 serving/day) was scored as 5, 3, and 0, respectively, on the basis of energy intake; §Protein intake, ≥ 10, 5–10, and < 5 energy %, was scored as 5, 3, and 0, respectively; Fiber intake, 20–30, 10–20, and < 10 g/day, was scored as 5, 3, and 0, respectively; Intake of Ca and Fe, ≥ 100, 80–100, 60–80, 40–60, and < 40% of RI, was scored as 5, 4, 3, 2, and 1, respectively; **Vitamin C intake, ≥ 100, 90–100, 80–90, 70–80, 60–70, and < 60% of RI, was scored as 5, 4, 3, 2, and 1, respectively; ††Total fat intake, ≤ 20, 20–30, and > 30% of total energy, was scored as 6, 3, and 0, respectively; ‡‡Na intake, ≤ 2,400, 2,400–3,400, and > 3,400 mg per day was scored as 6, 3, and 0, respectively; §§Significantly different between MetS and Non-MetS groups at P < 0.010; ‖‖Significantly different between MetS and Non-MetS groups at P < 0.050.

Correlation of nutrient intake between the 24-hour recall and SQFFQ methods

The correlation between the 24-hour recall and SQFFQ data, with respect to intake of the different nutrients, are shown in Table 4. Energy, carbohydrate, and fat intakes on the SQFFQ were moderately correlated with 24-hour recall intakes (r2 = 0.418, 0.417, and 0.337, respectively). However, the correlation coefficients for the intake of other foods, between the 24-hour recall and SQFFQ data, were < 0.30; the differences between 24-hour recall and SQFFQ intakes for all foods were statistically significant (Table 4).
Table 4

Pearson correlation coefficients* of nutrient intake between 24-hour recall and SQFFQs

jkms-32-1474-i004
Nutrient intake En_fq Prop_fq Fatp_fq CHOp_fq Ca_fq Fe_fq VA_fq VB1_fq VC_fq
En24 0.418 −0.024 0.051 −0.205 0.250 0.310 0.210 0.349 0.085
< 0.001 0.017 < 0.001 < 0.001 < 0.001 < 0.001 < 0.001 < 0.001 < 0.001
Prop24 0.044 0.148 0.110 −0.091 0.077 0.071 0.084 0.076 0.059
< 0.001 < 0.001 < 0.001 < 0.001 < 0.001 < 0.001 < 0.001 < 0.001 < 0.001
Fatp24 0.104 0.182 0.337 −0.215 0.143 0.050 0.094 0.108 0.041
< 0.001 < 0.001 < 0.001 < 0.001 < 0.001 < 0.001 < 0.001 < 0.001 < 0.001
CHOp24 −0.207 −0.070 −0.210 0.417 −0.125 −0.082 −0.079 −0.134 0.040
< 0.001 < 0.001 < 0.001 < 0.001 < 0.001 < 0.001 < 0.001 < 0.001 < 0.001
Ca24 0.218 0.078 0.069 −0.074 0.289 0.240 0.226 0.235 0.158
< 0.001 < 0.001 < 0.001 < 0.001 < 0.001 < 0.001 < 0.001 < 0.001 < 0.001
Fe24 0.108 0.016 −0.005 −0.028 0.090 0.123 0.115 0.115 0.078
< 0.001 0.095 0.593 0.005 < 0.001 < 0.001 < 0.001 < 0.001 < 0.001
VA_24 0.094 0.057 0.027 −0.029 0.096 0.123 0.127 0.114 0.088
< 0.001 < 0.001 0.006 0.003 < 0.001 < 0.001 < 0.001 < 0.001 < 0.001
VB1_24 0.298 0.017 0.043 −0.126 0.198 0.257 0.195 0.284 0.111
< 0.001 0.085 < 0.001 < 0.001 < 0.001 < 0.001 < 0.001 < 0.001 < 0.001
VC_24 0.049 0.040 −0.031 0.093 0.096 0.144 0.151 0.103 0.267
< 0.001 < 0.001 0.001 < 0.001 < 0.001 < 0.001 < 0.001 < 0.001 < 0.001
Daily intake of energy (En24), protein (Prop24), fat (Fatp24), carbohydrate (CHOp24), Ca (Ca24), Fe (Fe24), vitamin A (VA_24), vitamin B-1 (VB1_24), and vitamin C (VC_24) were calculated from 24 recall data. Daily intake of energy (En_fq), protein (Prop_fq), fat (Fatp_fq), carbohydrate (CHOp_fq), Ca (Ca_fq), Fe (Fe_fq), vitamin A (VA_fq), vitamin B-1 (VB1_fq), and vitamin C (VC_fq) were calculated from SQFFQ data using 112 food items.
SQFFQs = semi-quantitative food frequency questionnaires.
*Adjusted for survey design weighting using VARGEN which estimates the population covariance and Pearson correlation between 2 variables.

Adjusted ORs for having MetS by nutrient intake using the 24-hour recall and SQFFQ

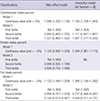
The association between macronutrient intake on the SQFFQ and the presence of MetS is shown in Table 5. Log-transformed carbohydrate intake (En%) showed a linear and positive relationship with the prevalence of MetS after adjusting for covariates (Table 5). The covariates were sex, age, area of residence, occupation, income, education level, drinking, smoking, obesity, and physical activity status. The prevalence of MetS increased 1.089-fold for each 5% increase in carbohydrate intake (Table 5). Moreover, there was a significant gender difference: in women, the prevalence of MetS increased 1.183-fold for each 5% increase in carbohydrate intake. In a categorical analysis, the OR for MetS was significantly higher in the highest (≥ 69.9 En% for women and ≥ 65.9 En% for men) vs. lowest carbohydrate intake tertile (< 62.6 En% for women, < 58.2 En% for men), for women only (Table 5). However, protein intake did not have any significant association with the presence of MetS, and there was no significant gender interaction with protein intake in the MetS risk (Table 5).
Table 5

Adjusted ORs (95% CI)* for having MetS by carbohydrates, protein, and fat intake according to SQFFQs

jkms-32-1474-i005
Classifications Main effect model Interaction model (ref [women = 0])
Carbohydrate intake percent
 Model 1
  Continuous value (unit = 5%) 1.089 (1.032–1.148) 1.183 (1.108–1.264)
 Model 2
  First tertile Ref (1.000) Ref (1.000)
  Second tertile 0.993 (0.805–1.225) 1.171 (0.857–1.601)
  Third tertile 1.227 (0.983–1.532) 1.697 (1.277–2.255)
Protein intake percent
 Model 1
  Continuous value (unit = −5%) 1.123 (0.950–1.329) 1.349 (1.061–1.715)
 Model 2 NA
  First tertile Ref (1.000)
  Second tertile 0.990 (0.825–1.189)
  Third tertile 0.906 (0.755–1.088)
Fat intake percent
 Model 1
  Continuous value (unit = −5%) 1.122 (1.040–1.209) 1.268 (1.156–1.392)
 Model 2
  First tertile Ref (1.000) Ref (1.000)
  Second tertile 0.900 (0.751–1.079) 0.727 (0.568–0.931)
  Third tertile 0.745 (0.613–0.907) 0.548 (0.411–0.731)
OR = odds ratio, CI = confidence interval, MetS = metabolic syndrome, SQFFQs = semi-quantitative food frequency questionnaires, NA = not applicable, BMI = body mass index.
*Adjusted for gender, age, BMI, residence area, education level, smoking and drinking status, physical activities, and obesity. Carbohydrate intake tertiles: first tertile; < 62.6 for women, < 58.2 for men, second tertile; 62.7 ≤ and < 69.9 for women, 58.2 ≤ and < 65.9 for men, third tertile; ≥ 69.9 for women and ≥ 65.9 for men. Protein intake tertiles: first tertile; < 12.3 for women, < 11.6 for men, second tertile; 12.3 ≤ and < 14.2 for women, 11.6 ≤ and < 13.4 for men, third tertile; ≥ 14.2 for women and ≥ 13.4 for men. Fat percent tertiles: first tertile; < 15.2 for women, < 14.7 for men, second tertile; 15.2 ≤ and < 20.8 for women, 14.7 ≤ and < 19.7 for men, third tertile; ≥ 20.8 for women and ≥ 19.7 for men.
In contrast to carbohydrate intake, log-transformed fat intake (En%) was negatively associated with the prevalence of MetS, and this association was stronger in women (OR, 1.268, Table 5). The categorical analysis also showed that the ORs for MetS for moderate (≤ 15.2 En% and < 20.8 En% for women, ≤ 14.7 En% and < 19.7 En% for men) and high fat intakes (≥ 20.8 En% for women and ≥ 19.7 En% for men) were lower than those for low fat intake (< 15.2 En% for women, < 14.7 En% for men). In women, the prevalence of MetS in the high fat intake group was 0.548-fold lower than that in the low-fat intake group (Table 5).
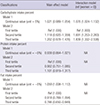
The adjusted ORs determined using the 24-hour recall method exhibited similar trends to those determined by the SQFFQ (Table 6). Adjusted ORs and 95% CIs for MetS risk exhibited a gender by carbohydrate intake interaction: in women only, log-transformed carbohydrate intake showed a positive association with the risk of MetS (OR, 1.076), and moderate (OR, 1.691; 95% CI, 1.253–2.283) and high intake (OR, 1.839; 95% CI, 1.332–2.538) of carbohydrates showed a positive association with the prevalence of MetS (Table 6). Log-transformed fat intake was negatively associated with the prevalence of MetS; moreover, moderate (OR, 0.918; 95% CI, 0.769–1.094) and high (OR, 0.786; 95% CI, 0.650–0.949) fat intakes were associated with lower incidence (Table 6). There was no gender difference in the association between fat intake and MetS incidence.
Table 6

Adjusted ORs (95% CI)* for having MetS by carbohydrates, protein, and fat intake according to 24-hour recall data

jkms-32-1474-i006
Classifications Main effect model Interaction model (ref [women = 0])
Carbohydrate intake percent
 Model 1
  Continuous value (unit = 5%) 1.021 (0.989–1.054) 1.076 (1.024–1.132)
 Model 2
  First tertile Ref (1.000) Ref (1.000)
  Second tertile 1.118 (0.920–1.359) 1.691 (1.253–2.283)
  Third tertile 1.202 (0.978–1.476) 1.839 (1.332–2.538)
Protein intake percent
 Model 1 NA
  Continuous value (unit = −5%) 0.939 (0.864–1.021)
 Model 2 NA
  First tertile Ref (1.000)
  Second tertile 0.902 (0.751–1.085)
  Third tertile 1.101 (0.919–1.317)
Fat intake percent
 Model 1 NA
  Continuous value (unit = −5%) 1.059 (1.008–1.112)
 Model 2 NA
  First tertile Ref (1.000)
  Second tertile 0.918 (0.769–1.094)
  Third tertile 0.786 (0.650–0.949)
OR = odds ratio, CI = confidence interval, MetS = metabolic syndrome, NA = not applicable, BMI = body mass index.
*Adjusted for sex, age, BMI, residence area, education level, smoking and drinking status, physical activities, and obesity. Carbohydrate intake tertile: first tertile; < 60.1 for women, < 54.7 for men, second tertile; 60.1 ≤ and < 70.6 for women, 54.7 ≤ and < 67.1 for men, third tertile; ≥ 70.6 for women and ≥ 67.1 for men. Protein intake tertile: first tertile; < 12.2 for women, < 12.4 for men, second tertile; 12.2 ≤ and < 15.2 for women, 12.4 ≤ and < 15.3 for men, third tertile; ≥ 15.2 for women and ≥ 15.3 for men. Fat percent tertile: first tertile; < 15.4 for women, < 15.5 for men, second tertile; 15.4 ≤ and < 23.4 for women, 15.5 ≤ and < 23.1 for men, third tertile; ≥ 23.4 for women and ≥ 23.1 for men.

Discussion

Although the fundamental causes of MetS remain unclear, its prevalence is associated with personal behaviors including dietary intake and physical activity (17). The association between the prevalence of MetS and energy and carbohydrate intake was similar between the 24-hour recall and SQFFQ methods, but the association between fat intake and prevalence of MetS showed a gender difference only in the 24-hour recall data. Overall, data calculated by the 24-hour recall and SQFFQ methods can be used for evaluation of the association between nutrient intake and MetS incidence. This novel study, which included a large population, validated 24-hour recall and SQFFQ nutrient intake data.
The SQFFQ can be validated in comparison to 3 to 4 3-day food records, or 3 to 4 24-hour recall datasets (18); and the reproducibility of SQFFQ results have been determined by comparing data across 2 or 3 separate SQFFQ datasets in various studies (181920). Most of these studies were conducted prior to the SQFFQ being applied in studies including large populations (1920). Correlations between nutrient intakes determined by the 24-hour recall and SQFFQ methods have also been investigated: most such validation studies reported moderate correlations between nutrient intakes determined by the 2 methods as shown in the present study. Prior to its inclusion in the KNHANES, the SQFFQ comprised 112 items and was validated in a study including 126 Korean subjects, aged 20–65 years, by using 3-day food record four times;; its reproducibility was also evaluated in the same study, which reported correlation coefficients for macro- and micro-nutrients similar to those obtained in the present work (12).
The number of items in different SQFFQs ranges from 5–350 according to variability in food consumption and availability for a given population (181920). The median number of SQFFQ items is 79 in a Spanish population study (19). The 112 items used in the present study was deemed sufficient to cover most foods consumed by Koreans (12). Meals consumed in Korea do not tend to vary geographically or with age. In the KNHANES SQFFQ, 112, rather than 109, items were included. The major problem associated with SQFFQs is difficulty in evaluating the consumption of dishes instead of individual foods, and so the new SQFFQ included some dishes related to the food category. For example, the tofu category included tofu, fried tofu, and hard-boiled tofu in soy sauce. People checked the frequencies of food and dishes as one food group although the nutrients in each food and dish in the food group differed. Thus, nutrient intake data in the context of the food group included some errors. However, in real life, people consume meals rather than individual foods, and the SQFFQ used in the KNHANES includes several meals frequently consumed by Koreans. In the present study, vitamin A intake differed between the 24-hour recall and SQFFQ methods. Vitamin A intake, calculated as the sum of retinol and carotenoid intake, may vary according to daily and seasonal differences in consumption. Thus, the SQFFQ may be more useful for determining the usual intake of vitamin A. The intake of other nutrients can also be measured by SQFFQ food intake data.
The prevalence of MetS is associated with personal behavior related factors, including nutrient intake and dietary behaviors. Many studies have assessed this association, but nutrient intake has most frequently been determined by the 24-hour recall method. Dietary patterns and/or intake of items in different food groups, indexed by the SQFFQ, have been used to determine the association between usual food intake and prevalence of MetS (921). However, the SQFFQ has not previously been applied to investigate the association between nutrient intake and MetS prevalence, although SQFFQ and 24-hour recall data exhibited moderate-to-high correlations for nutrient intake. However, a few studies have calculated nutrient intake using the SQFFQ (22). In the present study, the association between macronutrient intake, calculated using the SQFFQ and 24-hour recall methods, and the risk of MetS was examined. In addition, the variety and adequacy of food intake and the moderation of food and nutrient intake calculated by SQFFQ results demonstrated that the moderation of total fat intake had lower scores in the non-MetS group than the MetS group, indicating the non-MetS groups had higher fat intake than the MetS group. Thus, the fat intake (energy %) showed consistent results from 24-hour recall and SQFFQ. In addition, the risk of MetS showed a similar association with carbohydrate intake in both methods. The prevalence of MetS was positively associated with carbohydrate intake using both the SQFFQ and 24-hour recall methods; moreover, a gender difference was detected. This association between carbohydrate intake and MetS prevalence may reflect the high intake of refined grains among Koreans, as reported previously (23). In summary, the association between usual intake of nutrients and MetS risk can be determined using SQFFQ nutrient intake data.
The present study showed that the carbohydrate intake had a gender interaction with the risk of MetS. Women had a higher risk of MetS when carbohydrate intake was higher. However, a few studies have demonstrated the gender interaction of carbohydrate intake and MetS risk. (2425) Koreans and East Asians consume high carbohydrate diets, about 60%–70% of daily energy intake, and the high carbohydrate diet has been shown to increase hypertriglyceridemia and lower serum HDL concentration (2627). Since the subjects included in the present study ranged from 20–75 years old, the gender interaction could not be explained by sex hormones including estrogen and progesterone. However, gender interaction might be associated with the amount of daily carbohydrate intake: women (average 64.3%) consumed much higher carbohydrate than men (average 59.4%) in the present study. These results suggested that exceeding 60% dietary energy intake from carbohydrate might be a crucial risk factor for the MetS.
There were several limitations to the present study. First, the results cannot be interpreted in cause-and-effect terms because a cross-sectional design was used. Second, as some meals prepared according to different recipes are included within the same food group in the SQFFQ, nutrient intakes extrapolated from such food group data might represent under- or over-estimations due to variations in the seasonings used by the different recipes. Finally, the results could be biased due to omitted or residual confounding variables, which is a weakness inherent to all association studies.
In conclusion, the association between macronutrient intake and the MetS risk was similar in 24-hour recall and SQFFQ methods although the energy percentage of fat intake in the adult population was different by 2% between both methods. The prevalence of MetS was positively associated with carbohydrate intake and negatively associated with fat intake in an adult population who consumed about 14%–20% fat diet, as assessed by both the 24-hour recall and SQFFQ methods; these associations were mainly seen in women. Diet quality index also demonstrated that the adequate intake of vegetables in SQFFQ was positively associated with reducing the risk of MetS. The SQFFQ can be used to assess usual food and nutrient intake in studies that include large populations.

Notes

Funding This work was financially supported by the Soonchunhyang University Research Fund.

DISCLOSURE The authors have no potential conflicts of interest to disclose.

Author Contributions

  • Conceptualization: Lee BK, Park S.

  • Data curation: Ahn J, Kim NS, Lee BK.

  • Investigation: Ahn J, Kim NS, Lee BK.

  • Writing - original draft: Park S.

  • Writing - review & editing: Lee BK, Park S.

References

1. Rhee SY, Park SY, Hwang JK, Son JI, Chin SO, Kim YS, Woo JT. Metabolic syndrome as an indicator of high cardiovascular risk in patients with diabetes: analyses based on Korea National Health and Nutrition Examination Survey (KNHANES) 2008. Diabetol Metab Syndr. 2014; 6:98.
2. Gami AS, Witt BJ, Howard DE, Erwin PJ, Gami LA, Somers VK, Montori VM. Metabolic syndrome and risk of incident cardiovascular events and death: a systematic review and meta-analysis of longitudinal studies. J Am Coll Cardiol. 2007; 49:403–414.
3. Nestel P, Lyu R, Low LP, Sheu WH, Nitiyanant W, Saito I, Tan CE. Metabolic syndrome: recent prevalence in East and Southeast Asian populations. Asia Pac J Clin Nutr. 2007; 16:362–367.
4. Calton EK, James AP, Pannu PK, Soares MJ. Certain dietary patterns are beneficial for the metabolic syndrome: reviewing the evidence. Nutr Res. 2014; 34:559–568.
5. Shin H, Yoon YS, Lee Y, Kim CI, Oh SW. Dairy product intake is inversely associated with metabolic syndrome in Korean adults: Anseong and Ansan cohort of the Korean Genome and Epidemiology Study. J Korean Med Sci. 2013; 28:1482–1488.
6. Griel AE, Kris-Etherton PM. Beyond saturated fat: the importance of the dietary fatty acid profile on cardiovascular disease. Nutr Rev. 2006; 64:257–262.
7. Schwab U, Lauritzen L, Tholstrup T, Haldorssoni T, Riserus U, Uusitupa M, Becker W. Effect of the amount and type of dietary fat on cardiometabolic risk factors and risk of developing type 2 diabetes, cardiovascular diseases, and cancer: a systematic review. Food Nutr Res. 2014; 58:25145.
8. Siri-Tarino PW, Sun Q, Hu FB, Krauss RM. Saturated fatty acids and risk of coronary heart disease: modulation by replacement nutrients. Curr Atheroscler Rep. 2010; 12:384–390.
9. Park S, Ahn J, Lee BK. Very-low-fat diets may be associated with increased risk of metabolic syndrome in the adult population. Clin Nutr. 2016; 35:1159–1167.
10. Willett WC. Nutritional Epidemiology. 2nd ed. New York, NY: Oxford University Press;1998.
11. Maruyama K, Kokubo Y, Yamanaka T, Watanabe M, Iso H, Okamura T, Miyamoto Y. The reasonable reliability of a self-administered food frequency questionnaire for an urban, Japanese, middle-aged population: the Suita study. Nutr Res. 2015; 35:14–22.
12. Kim DW, Song S, Lee JE, Oh K, Shim J, Kweon S, Paik HY, Joung H. Reproducibility and validity of an FFQ developed for the Korea National Health and Nutrition Examination Survey (KNHANES). Public Health Nutr. 2015; 18:1369–1377.
13. Korea Centers for Disease Control and Prevention. Guideline for the Evaluation of the Fourth Korea National Health and Nutrition Survey. Cheongwon: Korea Centers for Disease Control and Prevention;2014.
14. Park S, Ham JO, Lee BK. Effects of total vitamin A, vitamin C, and fruit intake on risk for metabolic syndrome in Korean women and men. Nutrition. 2015; 31:111–118.
15. WHO Expert Consultation. Appropriate body-mass index for Asian populations and its implications for policy and intervention strategies. Lancet. 2004; 363:157–163.
16. Kim S, Haines PS, Siega-Riz AM, Popkin BM. The Diet Quality Index-International (DQI-I) provides an effective tool for cross-national comparison of diet quality as illustrated by China and the United States. J Nutr. 2003; 133:3476–3484.
17. Takahara M, Shimomura I. Metabolic syndrome and lifestyle modification. Rev Endocr Metab Disord. 2014; 15:317–327.
18. Macedo-Ojeda G, Vizmanos-Lamotte B, Márquez-Sandoval YF, Rodríguez-Rocha NP, López-Uriarte PJ, Fernández-Ballart JD. Validation of a semi-quantitative food frequency questionnaire to assess food groups and nutrient intake. Nutr Hosp. 2013; 28:2212–2220.
19. Dehghan M, del Cerro S, Zhang X, Cuneo JM, Linetzky B, Diaz R, Merchant AT. Validation of a semi-quantitative Food Frequency Questionnaire for Argentinean adults. PLoS One. 2012; 7:e37958.
20. Ahn Y, Kwon E, Shim JE, Park MK, Joo Y, Kimm K, Park C, Kim DH. Validation and reproducibility of food frequency questionnaire for Korean genome epidemiologic study. Eur J Clin Nutr. 2007; 61:1435–1441.
21. Schröder H, Covas MI, Marrugat J, Vila J, Pena A, Alcántara M, Masiá R. Use of a three-day estimated food record, a 72-hour recall and a food-frequency questionnaire for dietary assessment in a Mediterranean Spanish population. Clin Nutr. 2001; 20:429–437.
22. Cade J, Thompson R, Burley V, Warm D. Development, validation and utilisation of food-frequency questionnaires - a review. Public Health Nutr. 2002; 5:567–587.
23. Brunner E, Stallone D, Juneja M, Bingham S, Marmot M. Dietary assessment in Whitehall II: comparison of 7 d diet diary and food-frequency questionnaire and validity against biomarkers. Br J Nutr. 2001; 86:405–414.
24. Shirani F, Esmaillzadeh A, Keshteli AH, Adibi P, Azadbakht L. Low-carbohydrate-diet score and metabolic syndrome: an epidemiologic study among Iranian women. Nutrition. 2015; 31:1124–1130.
25. Choi H, Song S, Kim J, Chung J, Yoon J, Paik HY, Song Y. High carbohydrate intake was inversely associated with high-density lipoprotein cholesterol among Korean adults. Nutr Res. 2012; 32(9):–. 100–106.
26. Kim K, Yun SH, Choi BY, Kim MK. Cross-sectional relationship between dietary carbohydrate, glycaemic index, glycaemic load and risk of the metabolic syndrome in a Korean population. Br J Nutr. 2008; 100:576–584.
27. Aekplakorn W, Satheannoppakao W, Putwatana P, Taneepanichskul S, Kessomboon P, Chongsuvivatwong V, Chariyalertsak S. Dietary pattern and metabolic syndrome in Thai adults. J Nutr Metab. 2015; 2015:468759.
TOOLS
ORCID iDs

Jaeouk Ahn
https://orcid.org/0000-0002-8870-1527

Nam-Soo Kim
https://orcid.org/0000-0002-2534-012X

Byung-Kook Lee
https://orcid.org/0000-0001-9162-3390

Sunmin Park
https://orcid.org/0000-0002-6092-8340

Similar articles