

 PDF
PDF ePub
ePub Citation
 Print
Print


INTRODUCTION
Uric acid is the final product of purine metabolism. Serum uric acid (SUA) levels are determined by the balance between uric acid production and excretion (1). Hyperuricemia occurs when purine intake through food or the formation of endogenous purine due to cell turnover increases blood uric acid concentrations or when the amount of uric acid excreted through the kidney diminishes. Genetic factors are thought to contribute to the occurrence of hyperuricemia and recently, attention to the renal urate transporter that regulates the reabsorption and excretion of uric acid has been increased (23). In addition, through genome-wide association studies (GWASs), replication studies, functional studies, pathway analysis, and meta-analysis, multiple studies of common variants of the renal urate transporter along with other genetic factors that are associated with gout or hyperuricemia have been published. From these studies, new genes seem to play important roles in the renal urate transporter related pathogenesis of hyperuricemia or gout (345).
As the results of GWASs on western populations have been published, urate transporter related single nucleotide polymorphisms (SNPs) have been reported in Japan and China through replication studies and GWASs (67). However, few studies have examined the association between SNPs and gout/serum urate in Koreans. A representative study analyzed 8,834 subjects based on self-reported gout diagnoses using GWAS data of the Korean Association Resource (KARE) cohort as part of the Korean genome and epidemiology study (KoGES) of the Korea Centers for Disease Control and Prevention (8). This study genotyped 352,228 SNPs using the Affymetrix 5.0 platform (Affymetrix, Santa Clara, CA, USA). However, this study could not find any SNPs associated with gout susceptibility or SUA.
Recently, we have come to be able to use large volumes of data on genotyping of 748,585 SNPs from 3,667 patients in a rural community-based cohort (cardio vascular disease association study [CAVAS]), which was one of other cohorts of KoGES using Illumina Omni1-Quad Platform (9). The purpose of the present study was to find hyperuricemia related SNPs using data from GWAS conducted on healthy Koreans.
MATERIALS AND METHODS
Study populations
Study populations were recruited from a new cohort of KoGES (CAVAS) of the Korea Centers for Disease Control and Prevention, Korea (4845-301, 4851-302, and -307). KoGES has constructed 7 large-scale cohorts with general population groups aged ≥ 40 years to collect epidemiologic data, and samples from living bodies such as blood, urine, and genomes through examinations along with health and living habit related questionnaire surveys (10). Among the 7 cohorts, CAVAS was established in 2004 and designed for longitudinal prospective studies. The subjects have been followed up every 2 years and the third follow-ups are in progress in 6 regions. This study selected a total of 3,667 participants from CAVAS to construct a genomic cohort and investigate the risk factors for cardiovascular disease in rural communities (9). The study areas included 3 rural regions: Yangpyeong (located in the eastern part of Seoul), Namwon (located in the southwestern part of Korea), and Goryeong (located in the southeastern part of Korea). CAVAS is a cohort of normal individuals (aged 40–89 years) who were recruited from 2004 to 2008. None of the subjects had self-reported metabolic diseases (type 2 diabetes, hypertension or hyperlipidemia), cardiovascular diseases (myocardial infarction or stroke) or cancers. In addition, they had a normal range of blood pressure (systolic blood pressure [SBP] < 130 mmHg and diastolic blood pressure [DBP] < 90 mmHg) and fasting glucose levels (< 126 mg/dL), as measured during the survey.
General characteristics, anthropometrics, and biochemical variables
Each research center used standardized protocols with regard to survey questionnaires and physical examinations in order to collect data in the same format. All the staff that conducted the surveys or physical examinations had received the same training at the main office which was in charge of research coordination. Epidemiologic information included 249 traits including epidemiological surveys, physical examinations, and laboratory tests. Standardized questions were related to demographic characteristics (i.e., age, gender), drug history, and physician-diagnosed disease history (e.g., hypertension, hyperlipidemia, diabetes, heart disease, cerebrovascular disease, and cancer) along with lifestyle habits such as smoking and drinking. Fully trained staff conducted the survey interviews. Alcohol drinking was defined as drinking of alcoholic beverage at least once a month. Current drinkers were asked about the types of alcoholic beverage they drank over the last year, drinking frequency and average quantity consumed per occasion. Total alcohol intake referred to the sum of the consumption measured for each type of alcoholic beverage measured by a defined volume in number of glasses (13.27 g for makkolli, 9.875 g for soju, 6.952 g for beer, 8.532 g for wine, and 9.480 g for whisky). The value for each type of alcohol beverage was based the average concentrations of alcohol published by the Government Alcohol Agency in Korea (11).
Various anthropometric indices such as height, weight, SBP, and DBP were directly measured according to defined protocols by the staff. The height and weight of a subject were measured with light clothes and without shoes. Height was measured to the nearest 0.1 cm using a standard height scale and weight was measured to the nearest 0.1 kg using a standard scale. Body mass index (BMI) was calculated as weight in kilograms divided by the square of the height in meters. Blood pressure was measured in a sitting posture with standard mercury sphygmomanometer. As for a blood test, the subjects fasted for at least 8 hours in the previous night prior to the test, and blood volume of 20 mL was drawn from the antecubital vein in the following morning. All the biochemical markers in the blood were examined on the day of the blood test. Serum total cholesterol, high-density lipoprotein (HDL) cholesterol, triglycerides, fasting blood glucose (FBG), blood urea nitrogen (BUN), creatinine, and uric acid levels were analyzed, using an ADVIA1650 Automatic Analyzer (Siemens, New York, NY, USA). All subjects were examined by the same standard operating protocol and by similarly standardized ADVIA machines.
Power calculations
Power calculations were performed a priori for this study, using genetic power calculator (http://pngu.mgh.harvard.edu/~purcell/gpc/). The statistical power to significantly detect the genotype relative risk of 1.5 and 2 for the heterozygous and homozygous of a target allele, respectively, were 84.4%, when 234 cases were compared to 3,413 controls under the additive genetic model. The prevalence of gout was calculated as 1%, and the type 1 error rate was set to 0.05, and power to 0.8.
Genotyping and quality control
Illumina Omni 1 Quad bead microarrays (Illumina Inc., San Diego, CA, USA) were used to genotype genomic DNA samples, isolated from peripheral blood drawn from CAVAS subjects. We identified the genotypes of 748,585 SNPs from 3,647 subjects. GWAS genotype data were subjected to quality control filtering based on SNP genotype call rates with > 95% completeness, individual call rate > 95%, minor allele frequencies > 1%, and Hardy-Weinberg equilibria of P > 1 × 10⁻⁵. The data was given position on National Center for Biotechnology Information (NCBI) Build 36.
Statistical analysis
Out of the epidemiologic information being provided, data that seemed to affect hyperuricemia were taken. The variables were age, gender, BMI, whether the subject currently smoked and/or drank, volume of drinks, SBP, DBP, FBG, total cholesterol, triglyceride, HDL, low-density lipoprotein (LDL), BUN, creatinine, and SUA level. The concentration of LDL was calculated using Friedewald's formula:
Missing values were assigned for the individuals with triglyceride > 400 mg/dL.
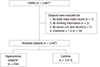
Cases missing one data without BMI, 2 data without drinking information, or one data without SUA were excluded. Also, excluded were those with high creatinine levels that directly affects SUA rising, and 16 subjects with creatinine > 1.4 mg/dL were excluded. Therefore, data from a total of 3,647 subjects were analyzed (Fig. 1).
Fig. 1
Flowchart illustrating inclusion and exclusion criteria for the study subjects.
SUA = serum uric acid, CAVAS = cardio vascular disease association study, KoGES = Korean genome and epidemiology study.
*The subjects were selected from CAVAS of the KoGES Project from 2004 to 2008; †Hyperuricemia was defined as SUA level ≥ 7 mg/dL (12).
Hyperuricemia was defined as cases in which the SUA level was 7 mg/dL or higher (12). The subjects were divided into 2 groups for analysis: a hyperuricemia group (SUA ≥ 7 mg/dL) and a control group (SUA < 7 mg/dL). Data were expressed as mean (with standard deviation) or median (with interquartile range [IQR]) for continuous variables and frequency and percentage for categorical variables in comparison with baseline characteristics. The continuous variables were compared between hyperuricemia group and controls through t-tests or Mann-Whitney tests. Chi-square tests were used to compare the differences in proportions between the 2 groups. In the univariate regression analysis, the determinant was the hyperuricemia group (SUA ≥ 7 mg/dL), and covariates were age, gender, BMI, whether the subject currently smoked and/or drank, volume of drinks, SBP, DBP, FBG, total cholesterol, triglyceride, HDL, LDL, BUN, and creatinine. Univariate logistic regressions were conducted to check the co-linearity of significant variables thereby selecting independent variables to conduct multivariate logistic regressions. In the multivariate regression analysis, the determinant was the hyperuricemia group (SUA ≥ 7 mg/dL), and covariates were SBP with DBP, total cholesterol with LDL, and BUN with creatinine.
Data were managed and analyzed using PLINK (version 1.06, http://pngu.mgh.harvard.edu/purecell/plink/) and SPSS (version 20.0; SPSS Inc., Chicago, IL, USA) (13). For quality control, the 6 clinical variables of age, gender, current alcohol intake, BMI, serum glucose, serum creatinine, and 10 principal components were compensated and gene analyses were conducted through logistic regressions. Associations were considered genome-wide significant at a P value of < 5 × 10⁻⁸, corresponding to a Bonferonni correction (14). Quantile-quantile plots and Manhattan plots were performed using the WGA Viewer (Duke University, Durham, NC, USA) (15). Regional association results of significant SNP were plotted using LocusZoom (University of Michigan, Ann Arbor, MI, USA) (16).
RESULTS
Clinical characteristics of the participants
Among the 3,647 participants, the median age of the study was 60.0 years (IQR, 51.0–68.0), and median SUA was 4.5 mg/dL (IQR, 3.8–5.5). The prevalence of hyperuricemia among all the subjects was 6.4% (234/3,647). Among 234 subjects with hyperuricemia, 90.2% (n = 211) were males, and 9.8% (n = 23) were females. The prevalence of hyperuricemia was 15.5% (211/1,361) in male subjects, whereas it was 1.0% (23/2,286) in female subjects.
Association of hyperuricemia with characteristics or risk factors by univariate and multivariate logistic regression analysis
In the univariate regression analysis, hyperuricemia was positively associated with male gender (odds ratio [OR], 18.053; P = 1.2 × 10−38), high BMI (OR, 1.101; P = 6.2 × 10⁻⁶), current smoking (OR, 3.224; P = 3.1 × 10⁻¹⁶), current drinking (OR, 4.006; P = 2.6 × 10⁻¹⁹), high alcohol intake (OR, 1.005; P = 1.3 × 10⁻⁸), high SBP (OR, 1.028; P = 4.2 × 10⁻⁶), high DBP (OR, 1.032; P = 8.6 × 10⁻⁴), high triglyceride (OR, 1.005; P = 1.2 × 10⁻¹⁵), high BUN (OR, 1.060; P = 7.4 × 10⁻⁵), and high creatinine (OR, 2.236; P = 9.2 × 10−57). We detected multicollinearity between the following pairs of variable: SBP with DBP, total cholesterol with LDL, and BUN with creatinine. Therefore, SBP, LDL, and creatinine measures were used in the multivariate regression analysis. From the multivariate regression analysis, hyperuricemia was positively associated with old age (OR, 1.017; P = 0.040), male gender (OR, 5.526; P = 3.2 × 10⁻¹⁰), high BMI (OR, 1.147; P = 5.4 × 10⁻⁷), current drinking (OR, 2.413; P = 4.7 × 10⁻⁷), and high creatinine (OR, 1.647; P = 1.6 × 10⁻¹³). No significant interactions were observed between hyperuricemia and current smoking, high SBP, hyperglycemia, high LDL, and high BUN (P = 0.270, P = 0.214, P = 0.113, P = 0.656, and P = 0.546, respectively).
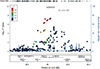
Genome-wide association of hyperuricemia in a Korean population
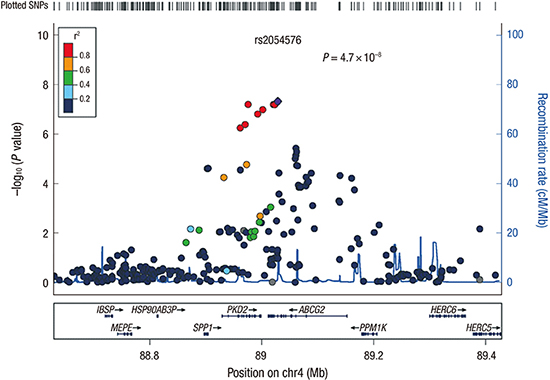
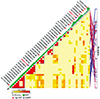
Several SNP showed probable associations with hyperuricemia; results shown by the quantile-quantile plots suggest the presence of multiple loci with modest effects (Fig. 2). The Manhattan plots using Haploview are shown in Fig. 3. Top 12 SNP for hyperuricemia identified in CAVAS by clinical significant variables (male, age, BMI, current alcohol, and creatinine) in multivariate regression are listed in Table 1. From the analyses, the chromosome 4 regions exhibited the strongest association with hyperuricemia, and 1 SNP (rs2054576) showed genome-wide significance (P = 4.7 × 10⁻⁸) (Fig. 4). In linear regression model, the rs2054576 SNP showed a significant association with high SUA (P = 7.4 × 10⁻¹⁸). We found the most significant rs2054576 SNP associated with risk of hyperuricemia, surpassing the genome-wide P threshold in both multivariate and linear regression analysis. The rs2054576 SNP is located in the intronic region of ABCG2 (ATP-binding cassette subfamily G member 2). SNP rs2231142, having missense functional consequence, is well known for associating with hyperuricemia and gout. According to the web-based SNP analysis tool SNPinfo (http://snpinfo.niehs.nih.gov/snpinfo/snptag.htm), there was tight linkage: r2 = 0.90 between rs2054576 and rs2231142. Genotype data was used as the data of the Asian population in dsSNP, consisted by Chinese and Japanese. Fig. 5 shows linkage disequilibrium in ABCG2, based on SNPinfo.
Fig. 2
QQ plot showing the expected and observed distributions of log10 (P) values in hyperuricemia. An obvious deviation from the expectation (straight red line) represents the presence of true-positive association signals.
QQ = quantile-quantile.
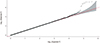
Fig. 3
Manhattan plots of the genome-wide association signals with hyperuricemia. The strength of association (−log10 [P] values) on y-axis was plotted against the chromosomal base-pair positions on the x-axis. The red line indicates the genome wide significance threshold (5 × 10⁻⁸), while the blue line indicates a threshold of 10−5.
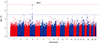
Table 1
Association results for the top 12 genotyped SNP identified in a Korean population for their association to hyperuricemia
Fig. 4
Regional association plots at the most significant loci associated with hyperuricemia. The plots of genetic loci on chromosome 4 are shown as they were created using LocusZoom. Each point represents a SNP plotted with their −log10 (P) values as a function of genomic position (NCBI Build 36). The lead SNP (rs2054576) is represented by purple diamond. The color coding of all other SNPs (circles) indicates LD with rs2054576 (red r2 ≥ 0.8, gold 0.6 ≤ r2 < 0.8, green 0.4 ≤ r2 < 0.6, cyan 0.2 ≤ r2 < 0.4, blue r2 < 0.2, grey r2 unknown).
SNP = single nucleotide polymorphism, NCBI = National Center for Biotechnology Information, LD = linkage disequilibrium.
DISCUSSION
In the current study, we attempted to identify variants having genome-wide significance with hyperuricemia in Korean population. The top signal was with SNP (rs2054576) that is located in the intron of ABCG2. Several GWASs have reported that ABCG2 has a major influence on hyperuricemia and gout. In 2008, Dehghan et al. (17) announced for the first time that ABCG2's SNP rs2231142 was associated with SUA levels and risk of gout among western populations. This announcement was proved thereafter through many GWAS meta-analyses and functional studies.
SNP rs2231142 has been found to be associated with hyperuricemia or gout conducted in different countries (3617181920212223242526). Japanese population studies respectively reported the OR of 1.85 and 2.06, for hyperuricemia, and the OR of 2.0 and 2.23, for gout (61819). In addition, the genetic impact on gout has been investigated in other ethnic groups as well, including African American, Chinese, European American, German, Icelandic, Mexican American, and Pacific Islander. These studies were recently compiled for 3 separate meta-analyses, and the findings provided strong support for the association between SNP rs2231142 and gout (272829).
Several ABCG2 variants, in addition to rs2231142, are known to influence SUA concentrations (346171830313233) (Table 2). The SNP rs2199936 is well known among western populations (34) and in a GWAS conducted with 961 European-Americans composed of obesity cases and controls, it was reported that ABCG2's 2 SNP, rs2622605 and rs1481017, were associated with SUA levels (35). In Japan, rs4148155 in ABCG2 (P = 1.14 × 10⁻¹³) was identified in a GWAS conducted with approximately 14,700 subjects and rs2231137 was also identified through a functional-based genetic analysis (32). In addition, in a GWAS meta-analysis conducted with 33,074 Asians, it was reported that rs2725220 (P = 4.2 × 10⁻³⁰) was strongly associated with SUA levels (30) and this was additionally shown in another study conducted with 991 Koreans (31).
Table 2
Characteristics of studies of the ABCG2 gene polymorphism and SUA level

| Ethnicity | References | Variant | Subjects | Cohort | MAF | Platform/method |
|---|---|---|---|---|---|---|
| African American | ||||||
| USA | Dehghan et al. (17) | rs2231142 | 3,843 | ARIC (black participants) | 0.03 | TaqMan |
| Asian | ||||||
| Meta-analysis | Okada et al. (30) | rs2725220 | 33,074 | NA | ||
| Chinese | Yang et al. (7) | rs2231142 | 3,451 | DFTJ, FAMHES | 0.29 | Affiymetrix 6.0, Illunina Omni-Express |
| Li et al. (35) | rs2622605 | 961 | NA | Illumina HumanHap550 | ||
| Korean | Sull et al. (31) | rs2725220 | 991 | NA | Affymetrix 5.0 | |
| Japanese | Yamagishi et al. (18) | rs2231142 | 3,923 | CIRCS | 0.31 | rTaq |
| Takeuchi et al. (6) | 17,091 | Amagasaki study, Fukuoka cohort | 0.29 | TaqMan | ||
| Kamatani et al. (32) | rs4148155 | 8,868 | BioBank Japan project | 0.3 | Illumina Human610-Quad Beadchip | |
| Caucasian | ||||||
| Meta-analysis | Yang et al. (7) | rs2199936 | 28,283 | 0.11 | ||
| Kolz et al. (4) | rs2231142 | 28,141 | 0.11 | |||
| Köttgen et al. (3) | 110,347 | 0.11 | ||||
| Croatia | Karns et al. (33) | rs2199936 | 1,300 | 0.08 | Affymetrix 5.0 | |
| Karns et al. (33) | rs2231142 | 1,300 | 0.08 | Affymetrix 5.0 | ||
| Icelandic | Sulem et al. (24) | rs2231142 | 15,506 | 0.1 | Illumina Human Hap300 | |
| The Netherlands | Dehghan et al. (17) | rs2231142 | 5,974 | Rotterdam | 0.12 | Illumina 550K |
| USA | Dehghan et al. (17) | rs2231142 | 7,699 | Framingham | 0.11 | Affymetrix 500K |
| Woodward et al. (23) | 8,861 | ARIC | 0.11 | Affymetrix 6.0 |
ABCG2 variants, which are known to affect SUA levels, are classified by race and country.
SUA = serum uric acid, MAF = minor allele frequency, ARIC = atherosclerosis risk in communities study, NA = not available, DFTJ = Dongfeng-Tongji cohort, FAMHES = Fangchenggang area male health and examination survey, CIRCS = Circulatory Risk in Communities Study.
ABCG2 is a urate transporter that regulates uric acid excretion in the kidney, intestine, and liver (236). ABCG2 gene is a transporter with many additional functions and encodes ABCG2 that was named for the gene. The ABCG2 protein, also known as breast cancer resistance protein, is a multidrug transport protein with the ability to transport various molecules such as chemotherapy drugs (37). Functional assay studies revealed that ABCG2 is located in the apical border membrane of renal proximal tubule cells and plays a role for uric acid secretion (23). A recent study interestingly claims that a risk allele of rs2231142 boosts urinary excretion of uric acid in the urine (38). Also, in a model of ABCG2 knockout mice, uric acid excretion showed an increase in kidney and a subsequent decrease in the intestines (39). This allele was found to be associated with the changes in uric acid levels during fructose challenge and fractional excretion of uric acid. Based on these studies, a risk allele of ABCG2 is likely to increase SUA levels by regulating excretion in the intestines, meaning that the allele is not directly involved in the transport of renal uric acid.
The minor allele frequency (MAF) of ABCG2 is known to vary with different races and the relevant differences among races were revealed in our previous study (40). The MAFs of ABCG2 were 11% among westerners, 29% among Japanese, and 28% among Koreans. Therefore, the MAF of ABCG2 among Koreans was similar to that among Japanese but different from that among westerners. Given that the genetic signals are shared by Korea and surrounding countries, this result seems to have been affected by geographical proximity.
The clinical utility of ABCG2 gene's common variants is still unclear because the effects of genetic variants on changes in SUA levels are relatively insignificant as environmental factors and conditions such as BMI, alcohol intake, hypertension, renal insufficiency, and metabolic syndrome are the major risk factors for hyperuricemia or gout (34). ABCG2 variants are estimated to influence uric acid levels, increasing the levels by as much as 3%–4% or 0.217 mg on average (3). Also, the genetic effects of ABCG2's minor alleles are known to be larger in men than in women (622).
Multiple studies have revealed that lifestyles affect SUA levels. In addition, it has been reported that SUA levels are related to cardiovascular related diseases such as hypertension, metabolic syndrome, coronary artery disease, cerebrovascular disease, and kidney disease. For our study, we planned to organize groups without any disease known to be associated with uric acid as such to find out risk factors for hyperuricemia excluding confounding factors. The fact that women's SUA concentrations are lower than those of men is well known and it seems to be attributable to the uricosuric effect of estrogen.
The present study has some limitations. First, the adjusted variables for finding the risk allele of hyperuricemia may have been insufficient. SUA may not be only affected by clinical information, but also by dietary information. These data were missing from the cohort clinical information. However, compared to other studies, we considered sufficient number of clinical variables. Second, SUA level of each patient was measured only once, and there may be a question of whether it is a representative value. Retest was difficult for our cohort since the re-measurements were conducted in 2–3 year intervals and in only in 20% of the cohort. Other studies also used uric acid values measured once and used as representative values. Third, it would be helpful if studies can be conducted in gout patients, but large-scale GWAS data for gout patients is nonexistent in Korea. In the future, studies with gout patients will be necessary. Fourth, the study has the lack of demonstration of further functional implication of the SNP with respect to hyperuricemia.
In summary, it was identified that the SNP rs2054576 in ABCG2 was associated with hyperuricemia among Koreans. This is the first GWAS conducted with the Korean population that found an SNP associated with increased serum levels of uric acid. Later, our results should be validated through repeat studies.
 XML Download