Journal List > J Korean Med Sci > v.32(9) > 1108420

Hwang, Ahn, Han, and Lee: The Prevalence of “Drinking and Biking” and Associated Risk Factors: The Korea National Health and Nutrition Examination Survey

Abstract

With the steady rise of health and environmental awareness, the number of bicyclists is increasing. However, there are few epidemiologic studies on bicycling under the influence (BUI). The aim of this study was to determine the prevalence of BUI and the associated risk factors in a representative Korean population. The data of 4,833 adult bicyclists who participated in the Korean National Health and Nutrition Examination Survey (2010–2012) were analyzed. Among the 4,833 participants investigated in this study, 586 (12.1%) had experienced BUI. As participants’ age increased, so did the prevalence of BUI (P < 0.001), with the participants who were aged 60–69 showing the highest prevalence of BUI (19.6%). With regard to BUI and drinking habits, the likelihood of being a heavy or high-risk drinker increased with the frequency of BUI (P < 0.001). In addition, there was a positive relationship between the frequency of BUI and alcohol use disorder identification score level. Finally, those who had previous experiences of BUI were significantly more likely to drive and ride motorcycles under the influence (P < 0.001). In conclusion, the prevalence of BUI was 12.1% and several associated risk factors for BUI were elucidated in this study. The development of specific preventive strategies and educational programs aimed at deterring individuals at a high risk of engaging in BUI is expected to reduce the number of alcohol-related bicycle injuries.

Graphical Abstract

jkms-32-1396-abf001

INTRODUCTION

Alongside the steady rise in awareness of health and environmental issues, the number of bicyclists is increasing. In Korea, the number of bicyclists has doubled over the past 5 years, and is currently estimated at more than 12 million. Meanwhile, the number of injuries as a result of bicycling is also increasing annually. According to the Korea Transportation Safety Authority, 11,259 bicycle-related injuries occurred in 2010, increasing to 13,316 in 2013. Bicyclists are more vulnerable to injury in traffic collisions than are motor vehicle users because they are less protected and visible. Well-known factors associated with the risk of bicycle accidents are rider age, rider experience, whether a helmet is used, and time of day or day of the week (1).
Besides these well-known factors, alcohol has been documented as a factor contributing to bicycling injuries. It is particularly prevalent in fatal cases: indeed, one study found that, for serious bicycling injuries, intoxication at the time of injury was associated with a significantly higher likelihood of fatality (with an adjusted odds ratio [OR] of 2.8) (2). In another study, elevated blood alcohol levels were found among approximately 8% of those treated in emergency departments for bicycling injuries, 16% of those admitted to hospitals, and 32% who died of bicycling injuries (23).
Despite these studies, there are relatively few epidemiologic studies on bicycling under the influence (BUI). Thus, in this study, we evaluated the prevalence of BUI and the risk factors associated with it. In doing so, we sought to aid in the development of effective strategies for decreasing BUI and the prevalence of bicycle-related injuries.

MATERIALS AND METHODS

Study population and data collection

This study used data collected from the 2010–2012 Korea National Health and Nutrition Examination Survey (KNHANES). The KNHANES is a nationwide survey that has been conducted by the Division of Chronic Disease Surveillance of the Korea Centers for Disease Control and Prevention since 1998. It is designed to accurately assess national health and nutrition levels. The survey comprised four parts: a health interview survey, a health behavior survey, a health examination survey, and a nutrition survey. Trained staff carried out the standard physical examinations for all participants. All participants also completed questionnaires assessing their lifestyle behaviors, including cigarette smoking, alcohol drinking, physical activities, and dietary patterns. The KNHANES methodology has been described in detail elsewhere (456).
Among the 19,599 KNHANES participants who were aged ≥ 19 years, 6,373 were bicyclists. After exclusion of 1,540 participants whose data could not be used for this study, we analyzed the data of a total of 4,833 participants.

Lifestyle habits

Data on medical history and lifestyle habits were collected using self-reported questionnaires. Residence was classified as staying either in an urban area or not (e.g., living in a town or in the countryside). Participants who reported having a life partner were classified as “having a spouse.” Low income was defined as the lowest quartile of income level, while education level was classified according to whether or not participants had attained an upper-secondary education or higher.
Participants were defined as “smokers” if they had smoked ≥ 100 cigarettes over a lifetime. Based on the amount of alcohol consumed per day in the month before the interview, participants were classified into three groups: non-drinkers, mild to moderate drinkers (< 30 g of pure alcohol/day), and heavy drinkers (≥ 30 g of pure alcohol/day). High-risk drinking was defined as drinking > 60 g of pure alcohol/occasion for men and > 40 g of pure alcohol/occasion for women with more than 2 occasions per week. Additionally, the Alcohol Use Disorders Identification Test (AUDIT), an instrument developed by the World Health Organization, was used to screen for problem drinking. Participants were categorized into four groups according to their AUDIT scores: low score (AUDIT-L), 0–7 points; intermediate score (AUDIT-I), 8–14 points; high score (AUDIT-H), 15–19 points; and very high score (AUDIT-VH), ≥ 20 points. Regarding physical activity levels, a regular exerciser was defined as an individual who incorporated ≥ 20 minutes of vigorous-intensity physical activity ≥ 3 days a week or ≥ 30 minutes of light-/moderate-intensity physical activity ≥ 5 days a week.
To evaluate safety awareness, participants were asked about their driving experiences. A “yes” or “no” response was required for the following 2 items: “Within the past year, did you drive a car, bicycle, or motorcycle under the influence of alcohol?” and “Within the past year, did you wear a seat belt when driving a vehicle?”

Statistical analysis

Statistical analyses were performed using the SAS survey procedure (version 9.3; SAS Institute, Cary, NC, USA) to account for the complex sampling design and sampling weights of the KNHANES as well as provide nationally representative prevalence estimates. This procedure includes unequal probabilities of selection, oversampling, and non-response to enable inferences regarding adolescent participants. The 95% confidence intervals (CIs) of all individual variables were calculated. Furthermore, descriptive statistics (means and standard errors for continuous variables and numbers and percentages for categorical variables) were also calculated, and then compared between those who had experienced BUI and those who had not using a t-test and the Rao-Scott χ2 test, respectively. A multivariate logistic regression analysis was then performed to further delineate the factors associated with BUI experience; only those variables yielding a P-value of < 0.25 in the univariate analysis were included. Additionally, the problem of multicollinearity was considered for variables related to drinking. All P-values were 2-tailed and P < 0.05 was considered significant.

Ethics statement

The study protocol was reviewed and approved by the Institutional Review Board of the Catholic Medical Center (IRB No. HC17EESI0031). Written informed consent was obtained from all participants prior to the survey.

RESULTS

Prevalence of BUI and general characteristics of those engaging in it

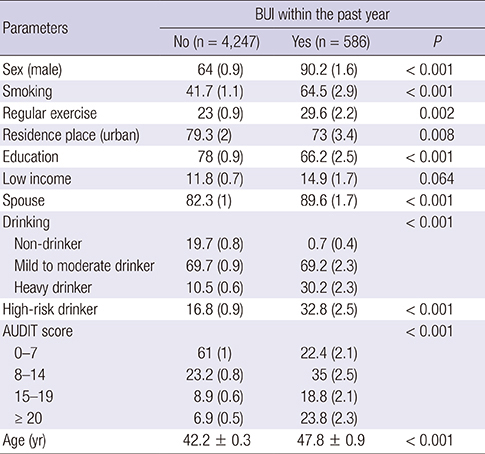
Among the 4,833 study participants investigated in this study, 586 (12.1%) had experience of BUI. The baseline characteristics of all study subjects are shown in Table 1. Subjects with BUI experience were more likely to be male, smokers, regular exercisers, suburbanites, alcohol drinkers, less educated, and married. In the multivariate logistic regression analyses, gender, residence, AUDIT score, and age were found to be significantly associated with a higher odds of BUI experience (Table 2).
Table 1

Characteristics of the study population

jkms-32-1396-i001
Parameters BUI within the past year
No (n = 4,247) Yes (n = 586) P
Sex (male) 64 (0.9) 90.2 (1.6) < 0.001
Smoking 41.7 (1.1) 64.5 (2.9) < 0.001
Regular exercise 23 (0.9) 29.6 (2.2) 0.002
Residence place (urban) 79.3 (2) 73 (3.4) 0.008
Education 78 (0.9) 66.2 (2.5) < 0.001
Low income 11.8 (0.7) 14.9 (1.7) 0.064
Spouse 82.3 (1) 89.6 (1.7) < 0.001
Drinking < 0.001
 Non-drinker 19.7 (0.8) 0.7 (0.4)
 Mild to moderate drinker 69.7 (0.9) 69.2 (2.3)
 Heavy drinker 10.5 (0.6) 30.2 (2.3)
High-risk drinker 16.8 (0.9) 32.8 (2.5) < 0.001
AUDIT score < 0.001
 0–7 61 (1) 22.4 (2.1)
 8–14 23.2 (0.8) 35 (2.5)
 15–19 8.9 (0.6) 18.8 (2.1)
 ≥ 20 6.9 (0.5) 23.8 (2.3)
Age (yr) 42.2 ± 0.3 47.8 ± 0.9 < 0.001
Data presented as percent (standard error) or mean ± standard deviation.
BUI = bicycling under the influence, AUDIT = Alcohol Use Disorder Identification Test.
Table 2

Adjusted ORs of the risk factors of BUI

jkms-32-1396-i002
Parameters Adjusted OR
OR 95% CI P
Sex (male) 4.008 2.355–6.821 < 0.001
Smoking 0.762 0.534–1.086 0.133
Regular exercise 1.369 0.994–1.887 0.055
Residence place (urban) 0.694 0.494–0.974 0.035
Education 0.711 0.499–1.014 0.059
Low income 0.920 0.585–1.446 0.718
Spouse 1.226 0.758–1.985 0.406
AUDIT score < 0.001
 0–7 1.000
 8–14 4.033 2.774–5.864
 15–19 5.724 3.598–9.107
 ≥20 7.585 4.837–11.892
Age (years) 1.027 1.013–1.041 < 0.001
OR = odds ratio, BUI = bicycling under the influence, CI = confidence interval, AUDIT = Alcohol Use Disorder Identification Test.

Associations between BUI and age

Fig. 1 shows the relationship between BUI prevalence and age. We divided participants into six age groups, as follows: group I (19–29 years old), group II (30–39 years old), group III (40–49 years old), group IV (50–59 years old), group V (60–69 years old), and group VI (≥70 years). The prevalence of BUI for each group was as follows: 8.6% (group I), 8.0% (group II), 9.8% (group III), 16.1% (group IV), 19.6% (group V), and 18.2% (group IV). Thus, there was a generally positive association between BUI prevalence and age (P for trend < 0.001). In particular, participants aged 60 to 69 years showed the highest prevalence of BUI experience.
Fig. 1
The prevalence of BUI according to age group. The prevalence of BUI increases with participants' age.
BUI = bicycling under the influence.
jkms-32-1396-g001

Associations between BUI and drinking habits

Fig. 2 shows the relationship between drinking habits and frequency of BUI within the past year. Participants were initially classified into four groups according to their frequency of BUI in the past year: group I (never), group II (1 or 2 times), group III (3–9 times), and group IV (≥ 10 times). The results indicated that more often participants engaged in heavy drinking, the more frequently they experienced BUI (P for trend < 0.001; Fig. 2A). The percentage of heavy drinkers in each group was as follows: 10.5% (group I), 21.2% (group II), 33.5% (group III), and 37.0% (group IV). The percentage of high-risk drinkers also increased with BUI frequency (P for trend < 0.001; Fig. 2B). The percentage of high-risk drinkers in each BUI frequency group was as follows: 16.8% (group I), 20.9% (group II), 41.3% (group III), and 38.2% (group IV).
Fig. 2
The percentages of heavy and high-risk drinkers according to frequency of BUI. There were positive relationships of the prevalence of heavy drinking (A) and high-risk drinking (B) with the frequency of BUI.
BUI = bicycling under the influence.
jkms-32-1396-g002
Finally, we evaluated the risk of BUI according to AUDIT level (Fig. 3). Participants with a higher AUDIT level had a greater tendency of experiencing BUI (P for trend < 0.001). The percentage of AUDIT-VH participants in each BUI frequency group was as follows: 6.9% (group I), 15.5% (group II), 28.6% (group III), and 28.6% (group IV). Furthermore, the percentage of AUDIT-L participants in each group was as follows: 61.0% (group I), 31.7% (group II), 19.1% (group III), and 15.2% (group IV).
Fig. 3
Composition of AUDIT level according to the frequency of BUI. The results show that participants with a higher AUDIT level tend to engage in BUI more frequently.
AUDIT = Alcohol Use Disorder Identification Test, BUI = bicycling under the influence.
jkms-32-1396-g003

Associations between BUI and safety awareness

Compared to those without the experience of BUI, the prevalence of riding a motorcycle and driving a car in a drunken state was significantly higher among participants with the experience of BUI (8.7% vs. 1.6%, P < 0.001; 27.2% vs. 8.4%, P < 0.001, respectively). Additionally, the participants with the experience of BUI were less likely to wear a seat belt while driving. (59.5% vs. 66.0%, P = 0.031; Table 3).
Table 3

Association of safety awareness with BUI

jkms-32-1396-i003
Safety parameters BUI
No Yes P
No. of total subjects 4,247 586
Drunken driving of a motorcycle 1.6 (0.3) 8.7 (1.8) < 0.001
Drunken driving of a car 8.4 (0.5) 27.2 (2.3) < 0.001
Use of a seat belt 66 (1.2) 59.5 (3) 0.031
Data presented as percent (standard error).
BUI = bicycling under the influence.

DISCUSSION

Although alcohol is commonly cited in many types of injuries, including bicycle injuries, there are few epidemiologic studies regarding BUI prevalence and the risk factors associated with it. In fact, compared to driving under the influence (DUI), there is less cultural awareness of BUI and many people think that it is safer than DUI. Furthermore, in some countries, there is no legislation banning drunk cycling, and those with such legislation tend to give light penalties for BUI. However, head injuries are common in BUI cases (7), and the risk of fatal or serious injuries is about 20 times higher when an individual’s blood alcohol level is 0.08 g/dL or higher (3). Hence, there is a need for an epidemiologic analysis of the current prevalence and associated risk factors of BUI. This would help in efforts to prevent BUI and decrease BUI-related injuries.
In this study, males were more likely than females to experience BUI. This result is somewhat similar to those of previous studies, which revealed an association between gender and alcohol consumption among bicyclists who were involved in collisions (28). This might be due to gender differences in drinking behavior. In other words, compared to female bicyclists, male bicyclists are more prone to taking risks and are less sensitive to the social disapproval attached to certain behaviors, such as drinking and riding (9).
Regarding age and BUI, this study showed that as participants' age increased, so too did the prevalence of BUI experience. In a previous Korean study, the risk factors for high alcohol consumption were old age and residence in medium-sized cities. In particular, the adjusted ORs for high alcohol consumption among male participants in their 30s, 40s, 50s, and ≥ 60s were 1.84, 2.85, 3.34, and 3.57, respectively (10). These results suggest a positive association between age and alcohol consumption, which would indirectly explain the increasing prevalence of BUI with age observed in this study.
We included AUDIT data in this study because it seems to be highly sensitive and specific screening test for current alcohol problems. Furthermore, the AUDIT is brief and easy to administer, focuses on current behavior, and is relatively free of cultural bias (11). In this study, participants with higher AUDIT scores more frequently experienced BUI compared to participants with lower AUDIT scores. This result implies that AUDIT can be used as a screening tool to determine which bicyclists would be at a high risk of BUI. Furthermore, more specific education or campaigns should be directed at bicyclists with high AUDIT scores.
Additionally, this study showed that heavy and high-risk drinkers had more experiences of BUI. This could be partially explained by the effect of heavy drinking on cognitive function. Previous research has shown that individuals with a pattern of heavy drinking exhibit a number of cognitive deficits, including impaired judgment, response disinhibition, poor insight, reduced motivation, and attentional deficits, all of which may be related to a decrease in focused attention and a greater disregard for future consequences (e.g., risk perception) (12). Based on this past study, we also compared general safety awareness in relation to vehicles among participants with BUI experience and those without such experience. These results showed that participants with BUI experience, compared to those without such experience, were more likely to have driven a car or ridden a motorcycle under the influence, and were less likely to wear a seat belt while driving. This result implies that people who are at a high risk of BUI might be at a high risk of other types of vehicle-related accidents.
The present study also has some limitations. First, there may have been some response bias in the reporting of several parameters, such as safety awareness and the frequency of alcohol intake, because the KNHANES used self-administered questionnaires. However, since the questionnaires were administered by trained officials and, standardized measures such as the AUDIT, had high internal consistency, participants' evaluation of their alcohol consumption levels and associated factors might be clinically relevant. Second, because the present study was cross-sectional, causal inferences regarding the relationships between BUI and its risk factors may be inconclusive. Third, the presence or absence of certain diseases might have influenced our results concerning BUI experience, but we did not consider this factor in the present study. In spite of these shortcomings, the present study is the first nationwide population-based study to identify the prevalence of BUI and associated risk factors in the general Korean population. In future studies, a longitudinal design is needed to improve our understanding of the complex relationships between drinking and cycling.
In conclusion, the prevalence of BUI was 12.1% in Korea. Despite the fact that BUI poses a considerable risk of fatal injury, its danger is often underestimated. To decrease bicycle-related injuries, there should be continuous efforts to raise awareness of the hazardous effects of BUI. In addition, to increase effectiveness, preventive measures targeting high-risk groups should be developed.

Notes

DISCLOSURE The authors have no potential conflicts of interest to disclose.

Author Contributions

  • Conceptualization: Lee JH.

  • Data curation: Hwang SH, Ahn MR.

  • Investigation: Hwang SH, Han KD.

  • Writing - original draft: Hwang SH, Ahn MR, Han KD.

  • Writing - review & editing: Han KD, Lee JH.

References

1. Orsi C, Ferraro OE, Montomoli C, Otte D, Morandi A. Alcohol consumption, helmet use and head trauma in cycling collisions in Germany. Accid Anal Prev. 2014; 65:97–104.
2. Li G, Baker SP, Sterling S, Smialek JE, Dischinger PC, Soderstrom CA. A comparative analysis of alcohol in fatal and nonfatal bicycling injuries. Alcohol Clin Exp Res. 1996; 20:1553–1559.
3. Li G, Baker SP, Smialek JE, Soderstrom CA. Use of alcohol as a risk factor for bicycling injury. JAMA. 2001; 285:893–896.
4. Park HA. The Korea national health and nutrition examination survey as a primary data source. Korean J Fam Med. 2013; 34:79.
5. Kim Y, Park S, Kim NS, Lee BK. Inappropriate survey design analysis of the Korean National Health and Nutrition Examination Survey may produce biased results. J Prev Med Public Health. 2013; 46:96–104.
6. Park SH, Lee KS, Park HY. Dietary carbohydrate intake is associated with cardiovascular disease risk in Korean: analysis of the third Korea National Health and Nutrition Examination Survey (KNHANES III). Int J Cardiol. 2010; 139:234–240.
7. Andersson AL, Bunketorp O. Cycling and alcohol. Injury. 2002; 33:467–471.
8. Airaksinen N, Lüthje P, Nurmi-Lüthje I. Cyclist injuries treated in emergency department (ED): consequences and costs in south-eastern Finland in an area of 100 000 inhabitants. Ann Adv Automot Med. 2010; 54:267–274.
9. Martínez-Ruiz V, Lardelli-Claret P, Jiménez-Mejías E, Amezcua-Prieto C, Jiménez-Moleón JJ, Luna del Castillo JD. Risk factors for causing road crashes involving cyclists: an application of a quasi-induced exposure method. Accid Anal Prev. 2013; 51:228–237.
10. Park JT, Kim BG, Jhun HJ. Alcohol consumption and the CAGE questionnaire in Korean adults: results from the Second Korea National Health and Nutrition Examination Survey. J Korean Med Sci. 2008; 23:199–206.
11. Reinert DF, Allen JP. The Alcohol Use Disorders Identification Test (AUDIT): a review of recent research. Alcohol Clin Exp Res. 2002; 26:272–279.
12. Zhao G, Wu C, Houston RJ, Creager W. The effects of binge drinking and socio-economic status on sober driving behavior. Traffic Inj Prev. 2010; 11:342–352.
TOOLS
ORCID iDs

Se Hwan Hwang
https://orcid.org/0000-0002-2838-7820

Ma Rhip Ahn
https://orcid.org/0000-0001-6222-8842

Kyung Do Han
https://orcid.org/0000-0002-6096-1263

Jung Ho Lee
https://orcid.org/0000-0002-3800-5494

Similar articles