

 PDF
PDF ePub
ePub Citation
 Print
Print


INTRODUCTION
Depressive disorder is a common mental illness and is considered a leading cause of major health problems worldwide (1). Depression results in an increase of the health-seeking behavior, decreased quality of life and high risk of suicidal tendencies (2). Nevertheless, patients with depressive disorder are often undertreated (3). An epidemiological study on depression may collect basic data to identify a mental health program that can classify the high-risk group and provide an appropriate treatment for the patients. Therefore, large-scale epidemiological studies on mental disorders have been conducted for decades (4567). Studies using the Composite International Diagnostic Interview (CIDI) to diagnose major depressive disorder (MDD) reported that the lifetime prevalence in the Western countries ranged from 12.8% to 16.2%, while the 1-year prevalence ranged from 3.9% to 6.6% (46). In Asian countries, the prevalence of depression was relatively lower than that of the western countries (8). For instance, a Taiwanese nationwide survey estimated that the lifetime prevalence of MDD using the CIDI was 1.2%, while the 1-year prevalence was 0.6% (7).
Recently, several epidemiological studies have reported the prevalence of depressive symptoms in the Korean population. In 1998, Cho et al. (9) reported the nationwide prevalence of depression in SouthKorea (hereafter referred to as “Korea”) by using the Center for Epidemiologic Studies Depression Scale, which is a self-reporting instrument. Since 2001, epidemiological surveys on mental disorders in Korea are conducted every 5 years, and reported a gradually increasing lifetime prevalence of MDD (2001, 4.0%; 2006, 5.6%; 2011, 6.7%) (1011). These surveillances primarily investigate the prevalence of mental disorders, based on demographic and clinical data. Recently, the public health authority in Korea focused on mental health, particularly depression, due to the high suicidal rate in the Organization for Economic Cooperation and Development (OECD) member countries for years. The quinquennial surveillance program failed to meet the required observation and utilization of mental health data in a timely manner.
The Korea National Health and Nutrition Examination Survey (KNHANES) is a cross-sectional, nationwide, and population-based analysis that monitors the health and nutritional status of the Korean population. Prior to the 2014 KNHANES, only simple questions about depression/anxiety symptom (i.e., I am not anxious or depressed, I am somewhat anxious or depressed, I am very anxious or depressed) as part of the European Quality of Life-5 Dimensions, and feeling of sadness or hopelessness as part of mental health were administered to detect symptoms of depression. However, a well-validated instrument to detect depression was assumed capable of deriving significant epidemiological information. The Patient Health Questionnaire (PHQ)-9 was introduced into the KNHANES to detect the prevalence of depression in the general population of Korea.
This study aimed to determine the current prevalence of depression in Korea using an annual nationwide surveillance program. We also presented the associated factors of depression that were diagnosed using the PHQ-9.
MATERIALS AND METHODS
Study population
The data used in this study was taken from the 2014 KNHANES, which used PHQ-9 for the first time as a screening instrument for depression. The KNHANES is a nationwide cross-sectional analysis that is conducted every year by the Korea Centers for Disease Control and Prevention. The target population is representative of the non-institutionalized civilians in Korea. The sampling plan follows a multi-stage clustered probability design. Each survey year includes a new sample of approximately 10,000 individuals aged ≥ 1 year. Trained interviewers and medical technicians conducted health interviews, health examinations, and nutritional surveys. The PHQ-9 was administered to adults aged ≥ 19 years by a trained interviewer.
Socio-demographic and health-related variables
We assessed the socio-demographic characteristics, health-related behaviors, and diagnose of chronic diseases in adults aged ≥ 19 years via health interviews and examinations. The educational level was categorized as ≤ 6 years, 7–12 years, and ≥ 13 years. The living arrangement was classified as living alone, with partner, and with other family members. The household income level was calculated by dividing the total household monthly income to the square root of the household size; the obtained levels then grouped into quartiles. The presence of chronic health conditions such as hypertension, diabetes, stroke, thyroid disease, arthritis, and cancer was diagnosed by a medical doctor, which was dichotomized into present (at least one of six) and none. Health interviewers assessed the lifetime diagnosis and current treatment of depression. Perceived health status (very good, good/fair, poor, or very poor), perceived stress (very much, much/mild, or no), current cigarette smoker (yes/no), high-risk drinker (yes/no), and participating aerobic physical activity (yes/no) were dichotomized. Current cigarette smoker was defined as adults who reportedly smoked at least 100 cigarettes in their lifetime and are currently smoking every day or occasionally. High-risk drinker was defined as adults who had seven glasses (five for women) or more of alcohol per occasion for two or more times a week. Aerobic physical activity was measured using the Global Physical Activity Questionnaire, which considered the following criteria: participating in at least 150 minutes a week of moderate-intensity, 75 minutes a week of vigorous-intensity, or an equal combination of moderate- and vigorous-intensity aerobic physical activity. Body mass index (BMI) was calculated as the body weight divided by the height squared, and categorized into underweight (< 18.5 kg/m2), normal (18.5–24.9 kg/m2), and obese (≥ 25.0 kg/m2).
PHQ-9
The PHQ-9 is a multipurpose instrument for screening, diagnosing, monitoring, and measuring the severity of depression (1213). The Korean version of PHQ-9 was administered in this survey that verified the validity and reliability of the largest study population of the community (14), and was translated from the original PHQ-9 with an authorized permission. The PHQ-9 contains nine symptom items that measure the frequency of depressive symptoms over the past 2 weeks. The response options for each item are “not at all,” “on several days,” “on more than half of the days,” and “nearly every day,” which are scored 0–3. The sum of the scores can range from 0–27, with the higher scores indicating more severe depression.
The PHQ-9 has two algorithms: one algorithm for depressive disorder diagnoses and another for grading the depressive symptom severity. The former algorithm based on the Diagnostic and Statistical Manual of Mental Disorder, Fourth Edition (DSM-IV) categorizes depressed respondents as either having a MDD or other types of depression. The latter algorithm categorizes respondents based on the severity of their depressive symptoms (none, 0; minimal, 1–4; mild, 5–9; moderate, 10–14; moderately severe, 15–19; or severe, 20–27) (12). Depression was classified as either major depression or other depression (using the PHQ-9 diagnostic algorithm) or PHQ-9 scores of ≥ 10.
Prior to the introduction of the PHQ-9 to the health questionnaire, a pilot survey was conducted on 537 participants from August 7, 2013 to September 13, 2013 (data not shown). The purpose is to gather the preliminary data to prove the efficiency of the PHQ-9 as part of the health questionnaire of KNHANES. The experts from the mental health or senior advisory committee discussed several relevant issues. First, a face-to-face interview method was used to administer the PHQ-9. The PHQ-9 was developed as a self-administered module; however, an interviewer (with minimal support) to clearly explain the purpose of the questionnaires administered the pilot survey. Second, in the United States, the Behavioral Risk Factor Surveillance System (BRFSS) used the PHQ-8, which omitted the ninth item regarding suicidal or self-injurious thoughts because administrators might not have been able to offer appropriate follow-up interventions. Moreover, some studies in the Western countries reported that the ninth question had a minor effect on the scoring of the PHQ-9 because suicidal thoughts are relatively rare in the general population, and the PHQ-8 almost has the same cutoff point for depression as the PHQ-9 (1516). However, owing to the high prevalence of suicide in Korea, suicidal thought measurement in the general population was deemed both necessary and significant. In Korea, reports on the minor effects of the ninth question of the PHQ-9 on the scoring system did not exist. Therefore, the PHQ-9 was selected, instead of the PHQ-8, to investigate depression in this pilot study.
In 2014, a primary survey for depression was conducted as part of the KNHANES. The matters discussed in the pilot survey were reflected. Although the ninth PHQ-9 question was included in this surveillance system, it was not possible to provide intervention exclusively to all respondents who answered the ninth question with “several days” or more. Therefore, a leaflet was distributed providing information on how to cope with depression and how to contact a consultant or professional mental health institution.
Statistical analysis
All statistical analyses were performed using the SAS PROC SURVEY procedure (SAS version 9.4; SAS Institute Inc., Cary, NC, USA). To represent the Korean population, the sampling weights assigned to participants were applied to all analyses and were generated by considering the complex sample design, non-response rate of the target population, and post-stratification. Data were presented as weighted percentage, unweighted frequency, and 95% confidence interval (CI) for categorical variables. The Rao-Scott χ2 test was used to evaluate the differences of baseline characteristics based on gender for categorical variables. A single logistic regression analysis was used to identify the association between gender, age, educational level, living arrangement, household income, presence of chronic disease, lifetime diagnosis of depression, perceived health status, perceived stress, smoking, high-risk drinking, and BMI, respectively with depression. A multiple logistic regression analysis was used to determine the associated factors of depression after adjusting for gender, age, educational level, living arrangement, and household income. A probability value of P < 0.05 was considered statistically significant.
RESULTS
Participants' characteristics
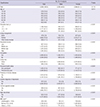
Of the 5,976 participants aged ≥ 19 years, 1,027 did not complete the PHQ-9 were excluded; thus, only 4,949 subjects were finally included in the analyses. The socio-demographic characteristics of the participants are presented in Table 1. The mean age was 42.6 years (range, 19–95 years). The participants were 51.1% women and 43.9% men. Majority of the participants lived with a spouse (75.0%) and in urban areas (84.1%).
Table 1
Sociodemographic characteristics and health status of the study population
![]()
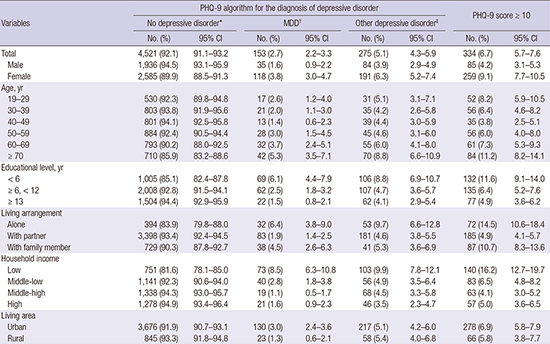
Prevalence of depression
The prevalence of depression was 6.7% (95% CI, 5.7%–7.6%) (Table 2). Approximately 4.2% (95% CI, 3.1%–5.3%) of men and 9.1% (95% CI, 7.7%–10.5%) of women had depression. Based on age, adults aged ≥ 70 years had the highest prevalence of 11.2%, followed by 8.2% in adults aged 19–29 years. The results revealed that depression was more prevalent in participants who lived alone (14.5%), compared to those who lived with their spouses (4.9%) or other family members (10.7%). The lowest household income group had the highest prevalence of depression (16.2%), while the middle-low, middle-high, and highest groups had the prevalence of 6.5%, 4.1%, and 5.0%, respectively.
Table 2
Prevalence of depression
PHQ-9 = Patient Health Questionnaire-9, MDD = major depressive disorder, No. = unweighted frequency, % = weighted percentage, CI = confidence interval, BMI = body mass index.
*No depressive disorder was defined as not major and other of depressive disorder. †MDD: if question 1 or question 2 and five or more of question 1–9 are at least “more than half the days” (count question 9 if present at all). ‡Other depressive disorder: if question 1 or question 2 and two, three, four of question 1–9 are at least “more than half the days” (count question 9 if present at all).
![]()
A higher prevalence of depression was observed in respondents with a history of one or more diagnoses for chronic disease than in those without (9.0% vs. 5.8%).
The prevalence of major and other depressive disorders using the PHQ-9 algorithm were 2.7% (95% CI, 2.2%–3.3%) and 5.1% (95% CI, 4.3%–5.9%), respectively.
The rate of seeking doctors for depression
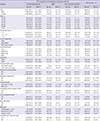
Among the participants with a PHQ score of ≥ 10, 25.2% had already been diagnosed and 11.2% were currently being treated for depression (Table 3). The rates of adults who are currently receiving treatment for depression were 10.6%, 14.7%, and 7.6% for the moderate (PHQ score, 10–14), moderately severe (PHQ score, 15–19), and severe groups (PHQ score, ≥ 20), respectively.
Table 3
Lifetime diagnosis and current treatment of depression based on the level of depressive symptom severity

Values are presented as unweighted frequency (weighted percentage).
PHQ = Patient Health Questionnaire.
*Depressive symptom severity was categorized by Kroenke et al. (12).
![]()
Factors associated with depression
The univariate and multivariate logistic regression analyses revealed several factors associated with depression (Table 4). Socio-demographic factors, such as women (odds ratio [OR], 2.28), old age (aged 40–59; OR, 0.65), group educated ≤ 6 years (OR, 2.52), living alone or with other family members apart from spouses (OR, 2.65), and low or middle-low household income (OR, 2.33), were associated with an increased risk for depression. In the multivariate regression model adjusted for socio-demographic factors, smoking, high-risk drinking, and presence of chronic diseases were not associated with depression. However, in the same model, lifetime diagnosis of depression (adjusted odds ratio [aOR], 5.71), perceived health status (aOR, 3.83), perceived stress (aOR, 9.77), and underweight (aOR, 1.99) were significantly associated with depression.
Table 4
Factors associated with depression
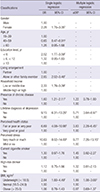
OR = odds ratio, CI = confidence interval, aOR = adjusted odds ratio, BMI = body mass index.
*Adjusted for gender, age (categorical), educational level, living arrangement, and household income; †P < 0.001; ‡P < 0.05.
![]()
DISCUSSION
This is the first study to determine the point prevalence of depression and associated factors using the PHQ-9 in the general population of Korea. The point prevalence of depression of Korean adults was 6.7%. The prevalence rate of depression was relatively high in women, group who lived alone, lowest quartile of household income, and the poorly educated group. The significantly associated factors with depression after adjusting the socio-demographic variables were lifetime diagnosis of depression, underweight, perceived stress, and perceived health status.
This study showed that the point prevalence investigated using the PHQ-9 was similar to the results from the United States or Germany. The US National Health and Nutrition Examination Survey (measured using the PHQ-9) that collected data from 2005 to 2008 reported a 6.8% prevalence of depression among the US adults (17). The 2006 and 2008 BRFSS (measured using the PHQ-8) findings showed 8.7% and 8.2% prevalence of depression, respectively (18). In Germany, the national representative household surveys conducted in 2003 and 2008 (n = 5,018) reported a 5.6% prevalence rate of moderate-to-high depressive symptom severity (German version of PHQ-9 score, ≥ 10) (19). In this survey, the prevalence of mild depressive symptom (PHQ-9 score, 5–9) was 18.1%. Maske et al. (20) reported a study based on the data of two nationwide surveys, which are cross-sectional data of the mental health module of the German Health Interview and Examination Survey for Adults (data collection: 2009–2012). This study collected the data from 4,483 community-dwelling German residents, aged 18–79 years, using the diagnostic algorithm of the PHQ-9, and reported that the prevalence of current major depressive symptom was 2.7%, which is similar to the results of our study (2.7%). In Asian countries, the PHQ-9 was also used to determine the prevalence of depressive symptoms in the general population. To standardize the PHQ-9, Wang et al. (21) administered it to 1,115 community-dwelling residents aged > 16 years in Shanghai. This study proposed the cutoff score of depression with an optimal sensitivity and specificity of seven. The prevalence of depression was 16.3% and 7.0% with the cutoff score of 7 and 10, respectively. Based on the data from 6,028 participants who were recruited from the households in Hong Kong, Yu et al. (22) presented a 1.7% prevalence of MDD that was diagnosed using the PHQ-9 algorithm. They reported that the prevalence of mild depressive (PHQ score, 5–9) and moderate-to-severe depressive symptoms (PHQ score, ≥ 10) were 13.7% and 4.3%, respectively. In 2012, an epidemiological study conducted by the Department of Statistics in Malaysia revealed a depression prevalence of 10.3% in a community in Selangor, Malaysia (23). Although this study did not represent all parts of Malaysia, it was performed on the general population to investigate the prevalence of depression and 593 participants were diagnosed with depression using the Malaysian version of PHQ-9 cutoff point of ≥ 10.
With regard to the socio-demographic and health-related factors, risk factors associated with depression were middle age, women, low household income, and low educational level. Our results were similar to those of previous studies on Korean cohorts that reported that young or old age, low educational level, divorce or separation, being unmarried, chronic disease, and smoking were risk factors for depression (911). However, in our study, only the middle-aged group demonstrated significantly reduced risk of depression, whereas the previous studies reported increased risk of depression in their younger or old aged cohorts. Also, after adjustment for socio-demographic, presence of chronic disease did not significantly increase the risk of depression in our study. In general, chronic diseases are consistently found in epidemiological studies that are associated with depression (24). This result may be due to the inclusion of diseases that are not morbid enough to be categorized as chronic diseases.
Perceived health status and stress more likely increase the risk of depression. Self-rated health was known to significantly elevate the prevalence of depression in previous Korean studies (25), and is strongly correlated with studies of elderly adults in other countries (2627). Perceived stress was strongly associated with depression in this study that was consistent with the results of previous studies (28). However, the limitation of this study was that perceived stress was not measured using a validated scale such as the Perceived Stress Scale.
BMI is known to have a U-shaped correlation with the risk of depression (29). Assessment of the correlation between BMI and depression in Korean studies have been consistently reported that higher risk of depression in underweight individuals than their normal body weight counterparts (2530). Similarly, this study showed that the risk of depression increased in underweight individuals, but not in individuals who were obese.
We assessed depression with PHQ-9 to find which of the algorithm scoring method and summed item scoring method would be more efficient to screen depression. Our results showed that the prevalence of major depression (2.7%), diagnosed using the algorithm scoring method, was lower than that of the summed item scoring method (6.7%). A recent meta-analysis reported that the summed-item scoring method of the PHQ-9 has a better diagnostic performance than the algorithm scoring method (31). In particular, the algorithm scoring method showed low sensitivity, and the cutoff point of ≥ 10 of the summed item scoring method could be more affordable in demonstrating the prevalence. This is in line with our results. Therefore, the summed item scoring method may be more affordable to use the PHQ-9 as a surveillance tool for depression in general population of Korea.
Our results revealed that individuals who had a PHQ-9 score of ≥ 10 needed low medical support for depression. Only 11.2% of the individuals (PHQ score, ≥ 10) answered that they were receiving treatment for depression. Similar to western countries (32), depression in Korea was also underdiagnosed and undertreated. Regarding the 2011 epidemiological survey of mental disorders among Korean adults, only 20.7% of mood disorder patients have visited a psychiatrist more than once. Ohayon and Hong (25) reported that only 7.4% of patients with MDD take their prescribed antidepressants. The Korean government and healthcare providers conducted campaigns and implemented policies in a nationwide effort to improve the treatment of depression, a strategy that was shown to be successful in other countries (3334). KNHANES with the PHQ-9 was expected to attribute the surveillance program to the policy outcome and prevalence of depression.
The most frequently responded item in the PHQ-9 was “fatigue.” The second most frequently responded question was item number three (“Trouble falling or staying asleep, or sleeping too much?”). Approximately 7.2% of the respondents rated more than one point to the ninth item of the PHQ-9 (data not shown) that was somewhat higher when compared to other studies in general population. This result may be a reflection of the high suicidal rate in Korea. The response to the ninth item of the PHQ-9 can be an indication of the increased risk of suicidal attempt in the outpatient setting (35). Further study is deemed necessary with regard to the importance of the response to the ninth item in the general population.
Our study had several limitations. First, the cutoff point of PHQ-9 for depression was not validated in the general population of Korea via the gold standard of diagnosis (14). However, it was widely used in the primary care setting of the psychiatric field (36). Several studies have proven its validity as a screening tool in the general population (1937). A PHQ-9 score of ≥ 10 was proven to have sensitivity (88%) and specificity (88%) of depressive symptoms among the general populations in various ethnic groups (12). A recent meta-analysis, including 36 studies (21,292 patients), reported that the pooled sensitivity for the 10 cutoff point was 0.78 and the pooled specificity was 0.87 in various settings (38). Although the 10 cutoff point is well-established in several ethnic groups (223940), further validation studies in the general population of Korea are deemed necessary. Second, as KNHANES did not include institutionalized individuals, hence individuals with severe depression could have been excluded from this survey.
These nationally representative data provide useful epidemiological information on depression in Korea, including overall prevalence, prevalence according to socio-demographic factors, factors associated with depression, and treatment rate of depression. The results of this study may serve as a basis for developing an effective nationwide program to manage depression. PHQ-9 will be used in Korea as an instrument of nationwide surveillance for depression every 2 years. In the future, we expect a meaningful follow-up study with accumulated data of PHQ-9.
 XML Download