

 PDF
PDF ePub
ePub Citation
 Print
Print


INTRODUCTION
In colorectal carcinomas (CRCs), research has highlighted that dedifferentiated tumor cells at the advancing edges have important prognostic significance (12345). The dedifferentiated tumor cells take the form of either single cells or clusters and do not have a well-formed glandular lumen. According to the number of cells, a cluster is defined as a “tumor bud (TB)” when consisting of < 5 cancer cells or as a “poorly differentiated cluster (PDC)” when consisting of ≥ 5 cells (67). PDCs are therefore more easily recognizable by hematoxylin and eosin (H & E) staining than TBs, and they are less likely to be mistaken for peritumoral desmoplastic tissue or inflammatory cells (8). However, it is clear that PDCs show a histological similarity to TBs regarding the loss of gland formation, and PDCs and TB are occasionally observed synchronously in the same tumor (Fig. 1). These morphological similarities and simultaneous occurrence suggest that PDCs and TBs could represent sequential steps in tumor growth and that epithelial-mesenchymal transition (EMT) may play a role in the development of both PDCs and TBs. β-catenin, located at the cell membrane, forms a complex with E-cadherin and is crucial for maintaining cell-cell adhesion and epithelial cell polarity (9). Mutations in the APC gene lead to the nuclear translocation of β-catenin, where it binds to T-cell factor/lymphoid enhancer-binding factor (TCF/LEF) family members, functioning as an oncogenic transcription factor (9). Therefore, the preservation of membranous β-catenin and E-cadherin is indicative of an epithelial phenotype, whereas the nuclear expression of β-catenin and loss of membranous E-cadherin are considered hallmarks of EMT (9).
Fig. 1
Histopathological findings of PDCs. (A) PDCs in CRC are usually identified with TBs at the invasive front. (B) PDCs surrounded by clear, artifactual retraction spaces display a morphological overlap with micropapillary clusters (H & E staining; original magnification, × 200).
PDC = poorly differentiated cluster, CRC = colorectal carcinoma, H & E = hematoxylin and eosin.

According to the images and definition in the original study, PDCs with artifactual retraction clefts also show morphological similarities to micropapillary clusters; although, PDCs are observed as more variable-sized clusters without any glandular differentiation in a background of desmoplastic stroma (10). By contrast, lumens within classic micropapillary clusters are not uncommon, and more prominent cystic lacunar spaces are displayed. In micropapillary clusters, the reversed cell polarity of tumor cells may contribute to the development of cystic lacunar spaces, which is demonstrated by the inside-out (I/O) pattern of MUC1/epithelial membrane antigen (EMA) immunohistochemical staining. MUC1/EMA is a glycoprotein typically expressed in the apical cell surface (i.e., the central part of the cell membrane) of normal glandular epithelium, plays an important role in glandular lumen formation, and has an inhibitory role in cancer-stromal interactions and E-cadherin-mediated intercellular interactions. Due to the reversal of cell orientation in micropapillary clusters, MUC1/EMA is located in the membrane toward the stroma (i.e., the peripheral part of the cell membrane) and disrupts cell adhesion to the stroma, resulting in characteristic lacunar spaces (1112).
Apart from a morphological resemblance, it is well documented that PDCs, TBs, and micropapillary patterns (MPPs) are all significantly correlated with aggressive tumor behavior, such as a lower survival rate and frequent lymph node metastasis and lymphovascular tumor emboli (LVE) (1213). Based on these morphological continuity and behavioral similarities, it is reasonable to assume that there is a pathogenetic overlap among PDCs, TBs, and MPPs and that they are sequential manifestations in the process of the same pathogenetic events associated with infiltrative growth. However, there are only a few studies focused on this topic (14).
In the present study, to ascertain the biological nature of PDCs, we examined ancillary immunohistochemical markers associated with the morphogenesis of TBs and MPPs, such as β-catenin, Ki-67, E-cadherin, epithelial cell adhesion molecule (EpCAM), MUC1, and EMA, and compared their expression in TBs and PDCs, as well as in differentiated neoplastic glands from the tumor center (TC).
MATERIALS AND METHODS
Patient selection and histopathological analysis
Two-hundred eleven patients who had previously received standard radical colorectal surgery and regional lymphadenectomy for primary colorectal non-mucinous adenocarcinoma without classic micropapillary clusters at Kangnam Sacred Heart Hospital in Seoul between August 2008 and December 2012 were retrospectively enrolled. Their demographic, clinical, and follow-up data were collected from the patients' medical records.
H & E stained slides from all tumor samples were reviewed by two pathologists (J.W.K. and M.H.) who were blinded to each patient's clinical information. The tumors were staged according to the seventh edition of the American Joint Commission on Cancer (AJCC) staging system (15). For each case, PDCs were graded based on the number of PDCs in accordance with previously described criteria (61016). Briefly, we identified the area with the highest number of PDCs. Under a 20 × objective lens (0.785 mm2), tumors with < 5, 5–9, and ≥ 10 counts of PDCs were classified as PDC grade 1 (G1), grade 2 (G2), and grade 3 (G3), respectively. Similarly, according to the new criteria suggested at the International Tumor Budding Consensus Conference (2016) and presented at the 28th European Congress of Pathology (2016), TBs were graded as follows: 1) budding 1 (BD1, low), 0–4 buds/0.785 mm2; 2) budding 2 (BD2, intermediate), 5–9 buds/0.785 mm2; and 3) budding 3 (BD3, high), ≥ 10 buds/0.785 mm2. Other histopathological findings including LVE and perineural invasion (PNI) were also assessed. According to their location, the tumors were subdivided into three groups: CRCs located in the right colon, including the cecum, ascending colon, and transverse colon; CRCs located in the left colon, including the descending and sigmoid colon; and CRCs located in the rectum.
Tissue microarray and immunohistochemistry
Formalin-fixed paraffin-embedded tissue blocks containing the highest number of PDCs and TBs were selected for analysis. Tissue microarrays (TMAs) were constructed from the paraffin-embedded blocks with a manual tissue arrayer (Quick-Ray; Unitma, Seoul, Korea). Cases with PDC G2 and G3 (117 cases) were considered as the study group because they included PDCs and TBs sufficient to evaluate the results of immunohistochemical staining. Four tissue cores (3 mm in diameter) from different tumor areas with high PDCs and TBs and 3 cores from the TC with differentiated neoplastic glands were obtained for TMA. Cases with PDC G1 (94 cases) were defined as the control group and three cores from the TC were also collected. Immunohistochemical assays were performed using the BenchMark ULTRA automated stainer (Ventana Medical Systems, Tucson, AZ, USA) with monoclonal/polyclonal primary antibodies to β-catenin (ready to use, clone 14; Cell Marque, Rocklin, CA, USA), E-cadherin (ready to use, clone 36; Ventana Medical Systems), EpCAM (ready to use, clone Ber-EP4; Cell Marque), Ki-67 (dilution, 1:100, code M7240; Dako, Glostrup, Denmark), EMA (ready to use, clone E29; Ventana Medical Systems), and MUC1 (ready to use, clone H23; Ventana Medical Systems), as well as the XT ultraView DAB Kit and CC1 solution (Ventana Medical Systems). Normal breast, liver, and kidney tissues were used as positive controls for EMA and MUC1, EpCAM, and E-cadherin, respectively.
Interpretation of immunohistochemical staining patterns
Two pathologists (J.W.K. and M.H.) independently evaluated the immunoreactivity and expression patterns for the different tissue zones: the TC, TB, and PDC regions. For analysis of the Ki-67 labeling index and nuclear staining of β-catenin, ten high-power fields (40×) were evaluated in each zone. After direct counting of tumor cells with nuclear staining under the microscope, the average of the 10 high-power fields was taken and rounded to the nearest 5% (1718). The results from both observers were compared and in cases with conflicting results (deviation > 5%), the final result was determined as a joint decision. In addition, the cytoplasmic and membranous staining patterns of β-catenin were also evaluated (19). The MUC1 and EMA staining patterns were assessed according to the predominant pattern as apicoluminal, I/O, or diffusely cytoplasmic. The I/O pattern was recorded when staining at the outer aspect facing the stroma of the cell clusters (20). E-cadherin and EpCAM expression patterns were analyzed as membranous, lost (decrease in membranous staining), or cytoplasmic, where cytoplasmic expression was considered aberrant (142122).
Statistical analysis
Analysis of the data was performed using the Statistical Package for the Social Sciences version 24.0 (SPSS Inc., Chicago, IL, USA). To compare parametric distributions, one-way analysis of variance and the Kruskal-Wallis test were used, and χ2 test and logistic regression were performed for categorical data. Disease-free survival was defined as the time from the first surgery until a documented relapse, including locoregional recurrence and distant metastasis. Disease-specific survival was defined as the time from the first day of surgery until death from the disease. Survival curves were calculated using the Kaplan-Meier method, and differences between curves were evaluated using the log-rank test. A P value less than 0.05 was defined as statistically significant.
RESULTS
Patient characteristics
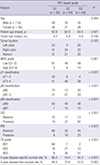
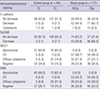
The mean age of the participants was 62.8 years, and 116 (54.9%) were men (Table 1). The median follow-up period was 39.5 months. Tumors were mainly localized in the colon (65.9%). T-stage categories were pT1 in 32 cases (15.2%), pT2 in 23 cases (10.1%), pT3 in 138 cases (65.4%), and pT4 in 18 cases (8.5%). LVE was observed in 50.2% of tumors, and PNI in 23.7%. Mucinous adenocarcinoma with more than 50% extracellular mucin was not included in the study; however, 24 cases (11.4%) showed more than 10% and less than 50% extracellular mucin. Seventy-seven (36.5%) tumors were BD1 grade, 49 (23.2%) were BD2, and 85 (40.3%) were BD3. A total of 94, 54, and 63 tumors were classified as PDC G1 (44.5%), G2 (25.6%), and G3 (29.9%), respectively. PDC-based grades were significantly associated with conventional histological grade, LVE, PNI, TB grade, and pT, pN, and pM stages (all with P < 0.001) and could predict poor outcomes for both 5-year disease-specific survival and disease-free survival (P < 0.001 and P = 0.002, respectively).
Table 1
Patient characteristics (n = 211)
Expression of β-catenin and Ki-67
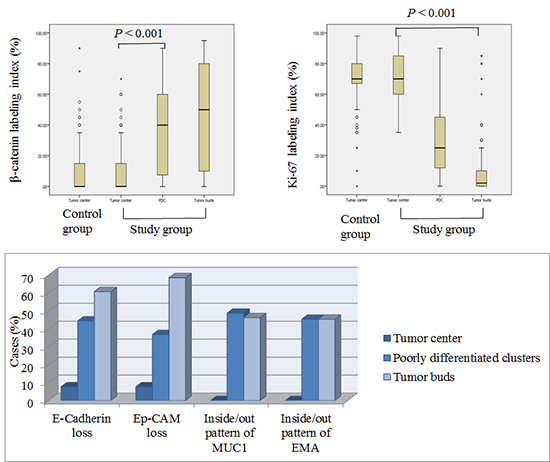
In the study group, the mean indices of nuclear β-catenin were higher values in the PDCs (37.3%, mean) and TBs (43.3%) but were lower values in the neoplastic glands from TC (8.9%, Figs. 2 and 3). By contrast, the Ki-67 labeling index was highest in the neoplastic glands from TC (71.5%, mean) compared with the PDCs (31.2%) and TBs (10.2%, P < 0.001). In the control group, the mean indices for β-catenin and Ki-67 nuclear staining were 10.4% and 69.9%, respectively. Regarding the expression patterns, loss of cytoplasmic/membranous β-catenin was observed in 26.5% of PDC and 27.4% of TB samples but was observed in only 0.8% of TC samples.
Fig. 2
Indices of nuclear β-catenin and Ki-67. (A) Indices of nuclear β-catenin are higher in PDCs and TBs than in differentiated glands in the TC. (B) Ki-67 labeling indices are higher in differentiated glands than in PDCs and TBs.
PDC = poorly differentiated cluster, TB = tumor bud, TC = tumor center.
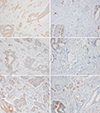
Fig. 3
Expression patterns of β-catenin, Ki-67, E-cadherin, EpCAM, MUC1, and EMA. (A) Nuclear β-catenin expression is more frequently identified in PDCs and TBs than in differentiated glands from the TC (inset). Differentiated glands show membranous β-catenin expression. (B) Ki-67 labeling indices are lower in the TBs and PDCs than in the differentiated glands (inset). (C) Membranous expression of E-cadherin is decreased in PDCs and TBs, whereas it is preserved in the differentiated glands. (D) Loss of EpCAM staining is observed in PDCs and TBs but not in the differentiated glands. (E) The I/O pattern of MUC1 is seen in the PDCs and TBs, while the apicoluminal pattern is observed in the neoplastic glands from the TC (inset). (F) The apicoluminal pattern is noted in the differentiated glands (inset), and the I/O pattern of EMA is observed in the PDCs and TBs (original magnification, × 200).
EpCAM = epithelial cell adhesion molecule, EMA = epithelial membrane antigen, PDC = poorly differentiated cluster, TB = tumor bud, TC = tumor center, I/O = inside-out.
Expression patterns of E-cadherin and EpCAM
In the study group, E-cadherin was preserved along the cell membrane in the TC in most cases (107/117, 91.5%), whereas PDCs and TBs displayed altered protein expression (Table 2). In detail, PDC (52/117, 44.4%) and TB (71/117, 60.7%) samples displayed less E-cadherin expression than TC samples (9/117, 7.7%, both P < 0.001). Regarding the aberrant (cytoplasmic) staining pattern for E-cadherin, it was more common in PDC (7/117, 6%) and TB (10/117, 8.5%) samples than in TC samples (1/117, 0.8%, P = 0.004 and 0.001, respectively). Loss of EpCAM staining was observed in 36.8% of PDC and 68.4% of TB samples but in only 7.7% of TC samples (both P < 0.001). In the control group, 88 (93.6%) and 92 (97.9%) cases of 94 CRCs had intact membranous expression patterns for E-cadherin and EpCAM, respectively.
Table 2
Expression pattern of immunohistochemical staining in the study and control groups
Expression patterns of MUC1 and EMA
In the study group, 83.8% of tumors were stained for MUC1 and EMA. Expression in the apicoluminal membrane for MUC1 and EMA was frequently identified in TC samples (65.0% and 62.2%, respectively) but not in PDC and TB samples. By contrast, no I/O pattern for MUC1 and EMA staining was observed in the TC samples, but it was observed in the PDC (48.7% and 45.3%, respectively) and TB samples (46.2% and 45.3%, respectively). In the control group, 65.9% and 75.6% of tumors were stained positive for MUC1 and EMA, respectively, and an I/O pattern was not observed.
DISCUSSION
In 2008, Ueno et al. (7) defined dedifferentiated tumor clusters at advancing edges according to the number of cells, as TBs or PDCs, and various grading systems based on the number of cells have been verified as reproducible (21623). Because PDCs are more easily recognized than TBs in routine H & E sections without using additional immunohistochemical staining, objectivity, and simplicity are the advantages of the PDC-based grading system. Additionally, it has been reported that the PDC-based grading system strongly indicates poor prognosis (11024). Consistent with results from previous reports, our data showed that PDC-based grading was a robust prognostic indicator and was significantly correlated with clinicopathological parameters, including primary tumor (T), regional lymph nodes (N), and distant metastasis (M) stages, LVE, and PNI. However, the grading system has not been universally used for several reasons. First, because the grading system is based on quantitative methodology, there may be resistance to the increased workload in routine diagnosis. Second, PDC is a newly introduced concept, and there is no conclusive evidence about its pathogenesis. Finally, the morphological continuity and similarity of PDCs and other histological findings such as TBs and MPPs can confuse pathologists. Ultimately, if PDCs, TBs and MPPs are histological patterns that are associated with the same carcinogenetic event, then the grading systems based on the counts of these components could be integrated. Thus, we conducted this study to demonstrate the biological characteristics of PDCs.
In our study, similar results regarding the expression of β-catenin and E-cadherin in PDCs and TBs clearly indicate that the morphogenesis of PDCs is also associated with EMT, considering the well-described interaction between β-catenin and E-cadherin in cell-cell adhesion. However, other factors must also play a role in the pathogenesis of PDCs because, although up to 90% of CRCs display dysregulated Wnt signaling and 60% harbor APC mutations, PDCs are only seen in a minority of cases (9). Regarding the staining patterns, it has been reported that the loss of cytoplasmic/membranous expression of β-catenin is associated with a poor survival rate (19). Consistent with this observation, we found that tumors from the control group (PDC G1) did not show cytoplasmic/membranous loss of β-catenin whereas tumors from patients in the study group (PDC G2 and G3) showed cytoplasmic/membranous loss (32/117, 27.4%). Previously, the loss or aberrant expression of E-cadherin was correlated with dedifferentiation (25). We observed the loss or aberrant expression of E-cadherin in differentiated tumor cells from the TC of the minor cases (8.5% in the study group and 6.3% in the control group), suggesting that the “budding immunophenotype” may not be restricted to dedifferentiated tumor cells (26).
EpCAM mediates the cell-cell adhesion of epithelial cells and is an additional marker for cancer-initiating stem cells (27). Gosens et al. (22) reported that the loss of membranous EpCAM is associated with TBs and nuclear β-catenin localization. Interestingly, we showed that the frequency of EpCAM expression was sequentially decreased in the TC, PDC, and TB samples, respectively. Moreover, we found that PDCs have a lower rate of proliferation than the neoplastic glands of TC and that TBs have the lowest proliferative activity. Therefore, it might be proposed that PDCs are an intergrade between differentiated neoplastic glands and dedifferentiated TBs. Our results also support previous results suggesting that the loss of the epithelial phenotype in tumor cells is accompanied by a loss of proliferative capacity, where the driving force for tumor infiltration can be attributed to factors such as stromal remodeling rather than proliferation (171828).
According to the definition reported by the World Health Organization, micropapillary CRC has small clusters of tumor cells within stromal spaces mimicking vascular channels (3). Despite their name, micropapillary clusters are devoid of fibrovascular cores, and PDCs are surrounded by clear, artifactual retraction spaces that display a morphological overlap with MPPs (16). As such, with only moderate interobserver reproducibility, even among expert pathologists, it has been a diagnostic challenge to differentiate nonclassical micropapillary clusters from extensive retraction artifacts (29). Moreover, a retraction artifact is not always an artifact that can be ignored, considering that extensive retraction artifacts are also strongly associated with poor outcomes (30). Recently, Barresi et al. (14) reported that the reversed pattern of MUC1 expression and loss of E-cadherin expression were also observed in all PDCs and TBs in their study cohort and that reversed cell polarity may reflect EMT. They proposed that the term “micropapillary” be replaced by PDC because PDC indicates the underlying biological phenomenon and is linked with a more objective grading system. In our study, a reversed pattern of MUC1 and EMA expression was not always identified, but was present in 48.7% and 45.3% of the PDC samples, respectively, while it was absent in the TC samples. Thus, we agree that PDCs have biological properties similar to micropapillary clusters. Compared with the study by Barresi et al. (14), the lower frequency of reversed expression patterns may have arisen from differences between the study cohorts (i.e., PDC G3 in Barresi et al. (14) vs. PDC G2 and G3 in the present study) and tissue blocks used for immunohistochemical staining (whole-tissue block in Barresi et al. (14) vs. TMA block in the present study).
The limitation of our study is that immunohistochemistry was performed on TMAs. As immunohistochemical staining can show heterogeneity, evaluation on TMAs may miss some positive cases. We evaluated four cores with a relatively large size (3 mm) for each case and tried to overcome the limitation of TMA usage. Another limitation is that we evaluated immunoreactivity in only PDCs and TBs. Future studies are needed to compare immunohistochemical results in micropapillary clusters.
We demonstrated that PDCs, TBs, and MPPs share immunohistochemically common results with morphological and behavioral similarities. They may represent sequential or similar growth patterns as found for other outgrowths of common biological processes such as dedifferentiation and alteration in the interaction between tumor cells and stroma. Therefore, we propose that the terminology and concepts concerning the PDCs, TBs, and MPPs with retraction artifacts should be carefully reviewed and clearly reestablished based on biological characteristics. Ultimately, an integration of grading systems based on the counts of these components should be considered.
 XML Download