

 PDF
PDF ePub
ePub Citation
 Print
Print


INTRODUCTION
Lung cancer is one of the most prevalent cancers worldwide (12). Over 85% of lung cancer cases are attributed to smoking, which contributes to the accumulation of genetic alterations that cause lung cancer. Previous studies have indicated that only a small proportion of lung cancer patients are non-smokers. This has not been well studied in western countries; however, in Asian countries, the proportion of patients who are non-smokers is higher (3), and approximately 10%–15% of patients diagnosed with lung cancer have no history of smoking (4).
Non-smokers with lung cancer are more likely to be female, have adenocarcinoma histology, and East Asian ethnicity. In addition to epidemiological differences, recent findings have shown that several molecular alterations are more frequently detected in non-smoking cancer patients (5678910).
Genetic alterations associated with lung cancer have been identified mainly in adenocarcinoma patients and have led to the development of targeted treatment strategies. In lung squamous cell cancer (SCC), comparative genomic hybridization (CGH) analyses have revealed frequent amplification of chromosome 3q25-qter (11). Several candidate genes with a potential role in the pathogenesis of lung SCC have been investigated but no genetic mutations have been specifically associated with lung SCC, especially in non-smokers.
In this study, we performed CGH arrays in 19 patients with lung SCC. We analyzed tissue samples from these patients to identify common genetic mutations associated with lung SCC in non-smokers. Furthermore, we performed retrospective analysis to validate our results using the public lung squamous cell carcinoma (LUSC) database from The Cancer Genome Atlas (TCGA) (12).
MATERIALS AND METHODS
Patient material
Patients with lung SCC who underwent surgical treatment for lung cancer between April 2005 and April 2015 were identified for review. Nineteen fresh frozen specimens from lung SCC patients were collected. Clinical characteristics, including age, sex, tumor stage, treatment history, Eastern Cooperative Oncology Group status, pulmonary function test, and smoking history, were recorded (Table 1). DNA was extracted from fresh frozen lung cancer specimens and stored at −196°C in liquid nitrogen and from methanol/acetic acid fixed cells stored at −80°C, using the Qiagen QIAamp® DNA Micro/Midi Kit (Qiagen, Hilden, Germany). The tissue specimens and data used in this study were provided by Asan Bio-Resource Center, Korea Biobank Network (2013-5[64]).
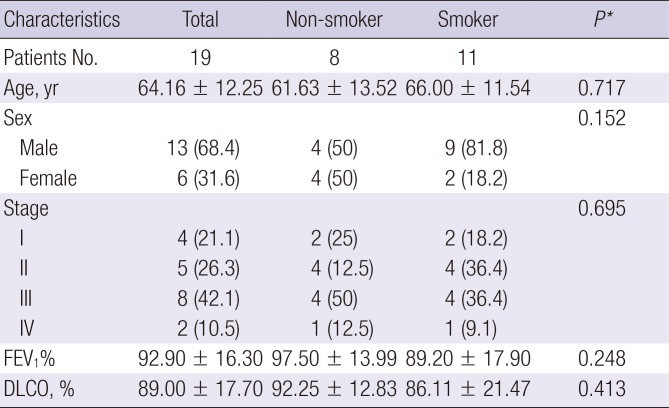
Table 1
Clinical characteristics of LUSC patients
Data are shown as mean ± standard deviation or number (%).
LUSC = lung squamous cell carcinoma, FEV1 = forced expiratory volume in one second, DLCO = diffusion lung capacity for carbon monoxide.
*Student's t-test for groups with continuous outcomes; Fisher's exact test for categorical outcomes.
![]()
Array comparative genomic hybridization (ArrayCGH)
ArrayCGH was performed using Agilent customized SurePrint G3 Microarray 60K (Agilent Technologies, Waldbronn, Germany), a high-resolution 60-mer oligonucleotide-based microarray. DNA labeling, hybridization, and washing were performed according to the manufacturer's instructions (protocol version 6.1). Tumor DNA samples were hybridized to pooled male DNA (Human Genomic DNA male, Promega G152A). The slides were scanned on an Agilent microarray scanner, and captured images were analyzed with feature extraction software. Filtered, normalized signal log ratios between lung tumor DNA and normal male reference DNA were used for analysis. The BioConductor package Limma version 3.24.15 was used to perform within-array normalization using the Loess method and between-array normalization was performed using the Aquantile method (13). After normalization, the replicate spots were averaged. Probes with less than two valid replicate values and probes that showed a standard deviation above 0.1 between replicate values were excluded. Chromosomal regions with a ratio between 1.11 and 1.41 were scored as “gained” and a ratio of 1.41 or greater was scored as “amplified.” Chromosomal regions with a ratio of between 0.84 and 0.73 were scored as “loss,” whereas a second threshold for loss was set for regions showing a ratio less than 0.73.
TCGA single nucleotide polymorphism (SNP) array data and clinical characteristics
Publically available level 3 copy number variation (CNV) data (SNP array) and clinical data of LUSC patients were downloaded from TCGA data portal (https://tcga-data.nci.nih.gov/tcga/) on June 19, 2015. Clinical data from 488 patients and 201 CNV data from primary solid tumors were downloaded. To validate ArrayCGH data, we used 196 CNV and clinical data which were above the intersection of the patient clinical and CNV data. Table 2 shows the clinical characteristics of lung SCC patients from TCGA.
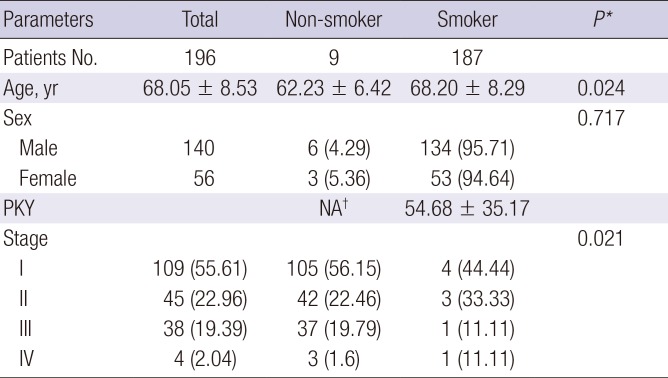
Table 2
Clinical characteristics of LUSC patients with CNVs from TCGA
Data are shown as mean ± standard deviation or number (%).
LUSC = lung squamous cell carcinoma, TCGA = The Cancer Genome Atlas, PKY = pack years, NA = not applicable, CNV = copy number variation.
*Student's t-test for groups with continuous outcomes; Fisher's exact test for categorical outcomes. †Nine subjects were lifelong non-smokers.
![]()
Copy number segmentation
To identify genomic regions that were significantly amplified or deleted, Genomic Identification of Significant Targets in Cancer (GISTIC, version 2.0.1) was used (14). This method identifies chromosomally altered regions that are over-represented across different tumor samples (region of interest) based on the amplitude and frequency of the alterations and quantifies the degree of overrepresentation using a G-score. Each G-score is assigned a P value by comparing the G-score at each locus to a background G-score distribution, which is corrected using the false discovery rate. This yields multiple testing corrected q-values. Individual significant regions of interest may cover more than one target region, and some false positive regions may appear significant because they are close to a target region. To address these issues, an additional correction of the q-values is required to confirm independently significant regions. A cutoff q-value of 0.25 was applied to select regions containing Somatic Copy Number Abnormalities (SCNAs) that were significantly over-represented. In a final step, GISTIC was used to determine the peak region and wide peak region for each region of interest.
Immunohistochemistry and scoring
Immunohistochemical assay was performed on paraformaldehyde-fixed paraffin sections. The GAB2 (OriGene Technologies, Rockville, MD, USA) primary antibodies were used at a 1:50 dilution in the immunohistochemistry analysis. The immunostaining intensity and average percentage of positive cells were evaluated as previous reported (15). The immunostaining intensity was scored as: 0 (no staining), 1 (weak staining), 2 (moderate staining), and 3 (strong staining). The percentage of stained cells on each section was scored as: 0 (less than 5%), 1 (5%–25%), 2 (26%–50%), and 3 (> 51%) accordingly. Then, the total immunostaining score was calculated by multiplying stained intensity score with staining cells score and thus ranged from 0 to 9. A final staining scoring at least 2 points in our study were considered to be positive.
Statistical analysis
We used the Student's t-test to analyze the ArrayCGH data processed by GISTIC. The mean log2 (relative ratios) and normalized measure of total signal intensity was calculated along each segment between the non-smoker and smoker groups. Multiple logistic regression analysis of the copy numbers was applied after age and sex adjustment using the logit function in R (v3.0.2; R Foundation, Vienna, Austria). We used copy number values calculated by GISTIC and defined the dependent variable as smoking status (Equation 1). This revealed a significant copy number association between non-smoker and smoker groups.

RESULTS
Identification of over-represented significant CNVs in SCC using GISTIC
Using GISTIC, we identified 16 significantly altered regions (six regions of gain on five different chromosomes and ten regions of loss on ten different chromosomes) as depicted in Fig. 1. Three gain (5p15.33, 8q24.21, and 11q13.3) and four loss regions (4q35.2, 9p21.3, 10q23.31, and 15q11.2) overlapped with the GISTIC analysis of TCGA LUSC patients (16). Based on the highest q-value (cutoff > 0.25), Table 3 shows the 16 significant regions of gain and loss. The GISTIC algorithm defines “peak regions” of major chromosomal instability by the magnitude and frequency of a copy number event. Within these significant regions, we detected 15 genes (ATM, CCND1, CDKN2A, DUX4L1, EZH2, FOXP1, LRIG3, MEN1, MITF, NRG1, NUMA1, PTEN, TERT, WHSC1L1, and WRN) that have been reported in the Cancer Gene Census downloaded on March 21, 2016, from the catalogue of somatic mutations in cancer (COSMIC) (17).
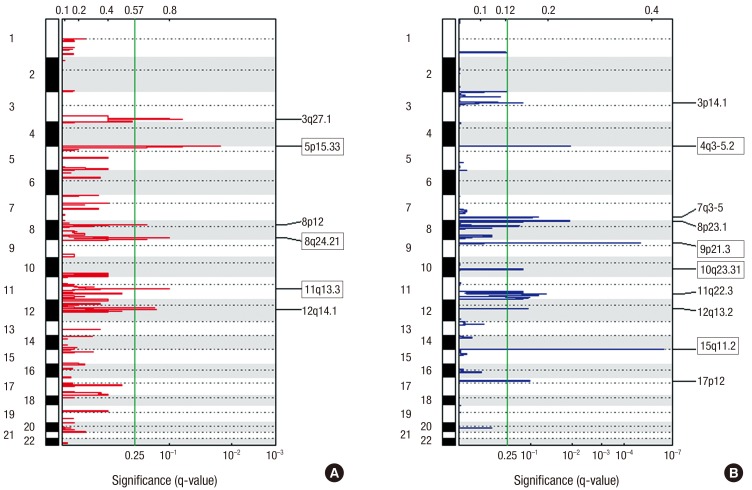
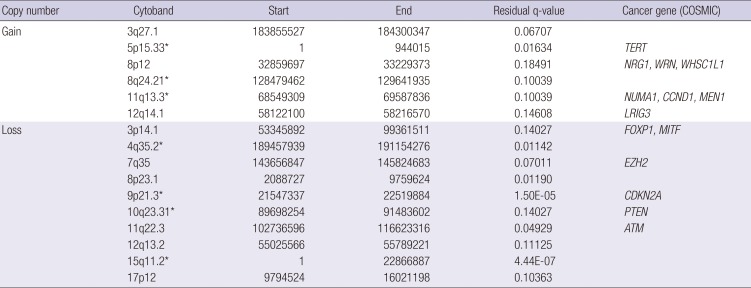
Fig. 1
Genomic positions of amplified and deleted regions in lung SCC.
Statistically significant (A) six amplified and (B) ten deleted regions were found. The X-axis represents the normalized amplification signals (top) and significance by q-value (bottom). The green line represents the significance cutoff at q-value = 0.25.
SCC = squamous cell cancer.
![]()
Table 3
Over-represented CNVs in SCC
CNV = copy number variation, SCC = squamous cell cancer, COSMIC = catalogue of somatic mutations in cancer, GISTIC = Genomic Identification of Significant Targets in Cancer, TCGA = The Cancer Genome Atlas, LUSC = lung squamous cell carcinoma.
*Tagged cytobands overlapped with GISTIC analysis of TCGA LUSC patients.
![]()
Identification of smoking status with different genomic signatures
We examined the frequency of copy number changes according to the smoking status in the ArrayCGH dataset (non-smoker [n = 8] and smoker [n = 11]) (Fig. 2). Statistical analysis of copy number changes between smokers and non-smokers revealed 539 protein-coding genes that were differentially altered between the two groups (P < 0.05). The genetic differences between smoker and non-smoker SCC patients are illustrated in Fig. 3.
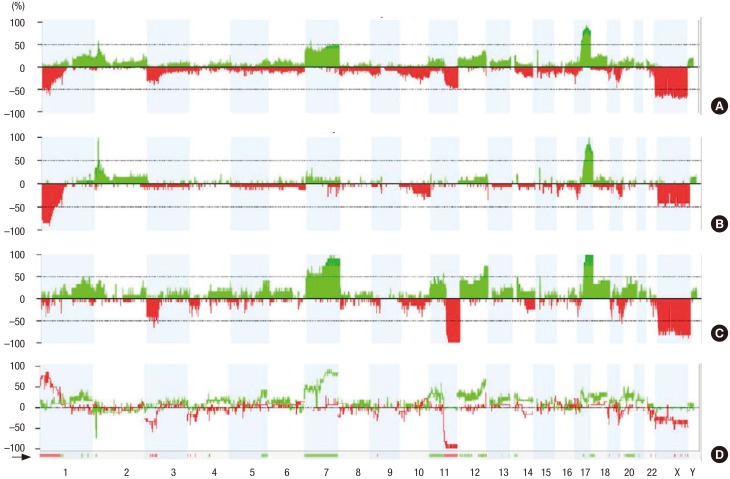
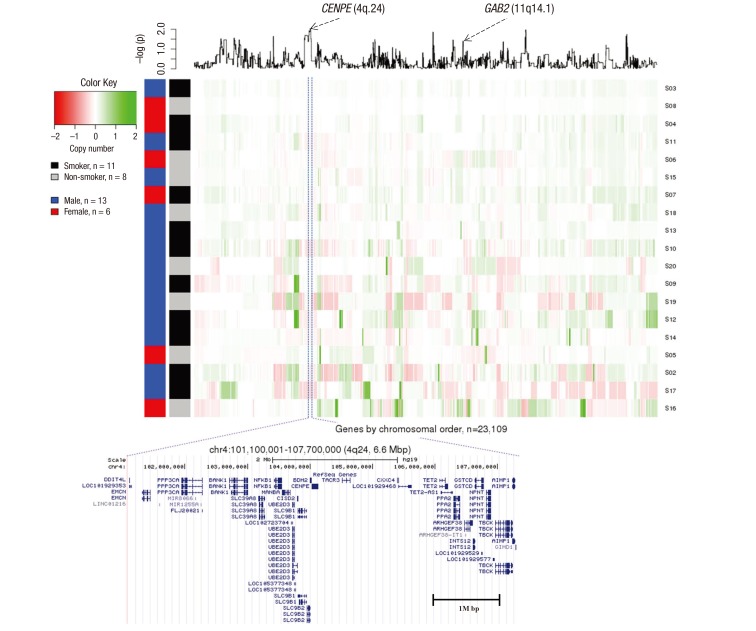
Fig. 2
Frequency of copy number changes for non-smokers and smokers. The frequency of copy number changes was calculated for all measurement points in the arrays and plotted relative to the position along the chromosome for (A) all squamous lung cancer sample, (B) smoker samples, (C) non-smoker samples, and (D) significant copy number differences bewteen smoker and non-smoker. The number of analyzed tumors is indicated. Green bars above the horizontal line indicate the percentage of tumors with copy number gains and red bars below the horizontal line indicate the percentage of tumors with copy number losses.
![]()
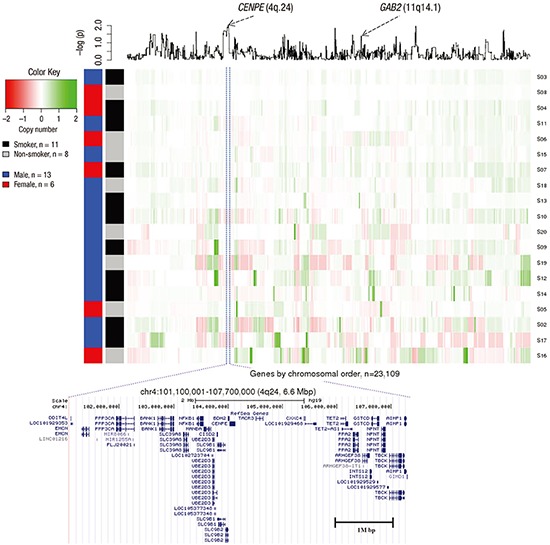
Fig. 3
Genetic differences in non-smoking SCC patients compared with smoking SCC patients. X-axis represents genes by chromosomal order, and Y-axis represents 19 samples that are clustered by Euclidian distance based on normalized intensity values. A line plot at the top panel is the P value from a t-test which was log2 transformed.
SCC = squamous cell cancer.
![]()
The most significant (P = 0.0093) protein-coding gene was CENPE (4q24) (the full gene list is presented in Supplementary Table 1). CENPE was amplified in the smoker and deleted in the non-smoker group. A SNP (rs1400363) in this gene was also reported in the Genome-wide Association Study and was highly associated with nicotine dependence in smokers (P = 9.9E-06) (18). A multiple logistic regression model with adjustment for age and sex was used to test copy number associations between nine lifelong non-smokers and 187 smokers to determine whether SCC depends on the smoking status in the TCGA LUSC dataset. To validate our ArrayCGH, we compared the differentially altered 539 genes with significant copy number changes from the TCGA LUSC dataset. The proto-oncogene GAB2 (11q14.1) was significantly associated in both datasets (ArrayCGH: P = 0.039; TCGA: P = 0.038). GAB2 was deleted in smokers and amplified in non-smokers in both datasets.
Immunohistochemistry result of GAB2
To further investigate the expression of GAB2 protein in lung SCC of smoker and non-smoker tissues, immunohistochemistry staining was performed. According to the established evaluation principle for immunostaining, GAB2 protein positive expression rate was 37.5% (3/8) in non-smoker tissues; whereas was weak expression or only one positive expression (9%, 1/11) in smoker tissue, exhibiting a significant difference of comparison within this result (P = 0.007, Fig. 4). Data were analyzed by χ2-test.
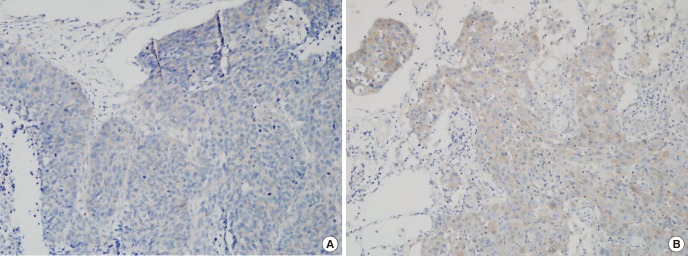
Fig. 4
Immunohistochemical staining for GAB2 in Lung SCC of non-smoker and smoker. (A) Lung SCC of non-smoker was positive for GAB2 staining. The total immunostaining score was 3% and 20% of cancer cells were stained. (B) Lung SCC of smoker was negative for GAB2 staining. While some cancer cells were shown weak positive for GAB2 staining, the percentage of stained cancer cell was less than 5%, and the total immunostaining score was 0.
SCC = squamous cell cancer.
![]()
DISCUSSION
Tumors are caused by mutations in genes that affect cell proliferation and regulation (19). Activation of oncogenes, inactivation of tumor suppressor genes, and increased instability of various genes comprise the genetic changes that affect the growth, differentiation, and survival of cells and ultimately lead to lung cancer. Lung cancer in non-smokers is a distinct disease driven by isolated genetic events rather than widespread genetic and epigenetic changes, which are frequent in smokers. Genomic alterations in lung cancer are related to the progression and determine the optimal treatment of the disease. In this study, we performed an ArrayCGH experiment to determine the genetic characteristics of SCC lung cancer in nonsmokers. We verified the results of the ArrayCGH experiment through TCGA SNP array data, a public genomic database, and found a new proto-oncogene, GAB2. In addition, we measured the protein expression of GAB2 in immunohistochemistry and analyzed it in smokers and non-smokers tissues.
GAB2 is a member of the GAB protein family, which also includes GAB1, GAB3, and GAB4. In Drosophila, this gene is called daughter of sevenless (Dos) and in Caenorhabditis elegans suppressor of Clr (Soc)-1 (20). GAB proteins promote human tumorigenesis by facilitating oncoproteins or by amplifying signaling via GAB2 overexpression (2122232425).
GAB2 is developing a strong track record as an oncoprotein in various solid tumors (26). GAB2 can stimulate Erk and AKT signaling through interactions with SHP2 and the p85 subunit of PI3K respectively (2728). Amplification of GAB2 has been reported in several cancers, including melanoma (25), ovarian cancer (22), breast cancer (21), gliomas (23), and gastic cancer (24). The SHP2/Ras and PI3K/Akt pathways are the two major signaling trasduction pathways of GAB2 (29). Increased PI3K signaling and abberation of the PI3K pathway genes PIK3CA, PKB, and PTEN have been implicated in several types of cancer including lung cancer (30). A recent study showed that the association of c-Met with PI3K and GAB2 was diminished by c-Met inhibition in small cell lung cancer (31). In addition, ablation of GAB2 severely suppressed lung metastasis (32), implicating GAB2 as an important therapeutic target. GAB2 was overexpressed and coupled with ErbB2 (also known as Neu or HER2) receptor signaling in breast cancer (33). GAB2 is also important for the progression of tumorigenesis and is overexpressed in lung cancer tissue. However, further investigation into GAB2 expression is required.
However, the role of GAB2 in lung SCC of non-smoker has not been reported. In this study, we characterized the genetic variations of SCC in non-smokers using ArrayCGH. Our results suggested that copy numbers in non-smokers are different from smokers, and we identified a proto-oncogene GAB2 that was significantly associated with SCC development in non-smokers. Although we used SNP chip data, which is a different approach to TCGA, we adjusted for age and sex to obtain accurate data that could be compared with public databases. We also measured the expression of GAB2 protein through IHC, and we found a statistically significantly higher number of highly expressed in non-smokers.
There are some limitations in our study. First, we did not perform other functional analyses. However, there is a wealth of evidence that GAB2 has an important role in carcinogenesis (29). Moreover, it is well known that genetic variations in Korean and Asian patients differ from those in American patients. Second, the number of tissues was small in this study. Most of lung cancer patients had an advanced stage at the diagnosis, and the proportioin of squamous cell carcinoma in Korea has decreased continously in recent (34). Because LUSC is well known smoking related carcinoma of the lung, the numbers of LUSC in non-smokers are too small. In this reason, we got a few samples from LUSC patients who were never smokers. Although the number of tissues was small, the differenece of GAB2 in squamous cell carcinoma between smokers and non-smokers was significant. So, further large population based study to clarify the clinical significance of GAB2 in squamous cell carcinoma is required.
In summary, we identified a GAB2 genetic variation that was associated with lung cancer in non-smokers by ArrayCGH and this result was validated by TCGA data. We also found that the protein expression of GAB2 was relatively upregulated in non-smoker than smoker tissues. Smoking is a major risk factor for lung cancer, but specific genetic alterations affect the development of lung cancer in non-smokers. Identification of these specific genetic alterations may uncover new biomarkers to identify individuals at high risk of developing lung cancer. This may have implications for early detection and targeted therapy.
 XML Download