

 PDF
PDF ePub
ePub Citation
 Print
Print


INTRODUCTION
The National Health Insurance Service (NHIS) in Korea is the compulsory health insurance scheme covering the whole Korean population. The National Health Information Database (NHID) provided by NHIS can produce various health statistics. The NHID consists of sub-database (DB) including the eligibility DB, healthcare utilization DB, health screening DB, and healthcare provider DB (1). The eligibility DB and healthcare utilization DB can be used to calculate the life expectancy (LE) and to produce health indicators that represent entire Korean population. Sociodemographic patterns of health-related factors such as health behaviors and bio-clinical risk factors can be identified through linkage of eligibility DB and health screening DB. In addition, the NHID is linkable to multiple national secondary data maintained by other governmental agencies, including registries of births, deaths, and cancer using 13-digit unique personal identification numbers.
Moreover, using the NHID, municipal level (i.e., si, gun, gu) estimates of health status, health-related factors, and morbidity and mortality measures can be obtained. In Korea, the Korea National Health and Nutrition Examination Survey (KNHANES) and the Community Health Survey (CHS) are the exemplary representative nationwide health surveys. However, the sample size of KNHANES is not enough large to conduct municipal level analysis, although KNHANES, if the data are combined across several years, may provide provincial level data. With respect to the CHS, it is possible to calculate the indicators at the municipal level, but the available variables are limited to health behaviors and self-reported health status. While, the NHID allows researchers to measure the various indicators related to bio-clinical factors, health behaviors, morbidity, and mortality at the municipal level with large sample size and objectively measured data. Furthermore, the National Health Insurance (NHI) premiums are available as a socioeconomic position indicator, and thus the NHID can be used as a valuable data source for health inequality monitoring across the nation, metropolitan areas, and municipalities. Only a few countries monitor the health of the entire population across the national and local levels using comprehensive data linked to demographic characteristics, income, medical use, health behaviors, and death of the whole population (2). If the validity and availability of NHID are ensured, it is expected to be used in various fields other than health and health equity monitoring of population.
In Korea, the residential registration data from the Korean Statistical Information Service (KOSIS) of Statistics Korea officially provide numbers of population and deaths at the national and local levels. Although the NHID also covers whole population, it is uncertain how much the numbers of population and deaths between NHID and KOSIS are similar especially at the local level. The residential registration data do not include foreigners while NHID does. In residential registration data, the numbers of military soldiers are counted to population numbers of districts where the soldiers originally resided. The NHID use the administrative residential information for soldiers. However, until now, no research effort has been made to compare the population and mortality statistics between NHID and KOSIS.
This study explores whether the NHID DB can be used to monitor health status of entire population in Korea across the national and local levels. For this purpose, we calculate the mortality rate and LE at birth across the national, provincial, and municipal levels using the NHID eligibility DB from 2004 to 2015. Then, we compare the results with the mortality rate and LE calculated using the population data based on resident registration and death certificate data provided by the KOSIS of Statistics Korea.
MATERIALS AND METHODS
The individual data linkage to mortality data was made under agreement between the NHIS and Statistics Korea. After internal linkage processes in Statistics Korea, aggregate data without any personal identifiers were transferred to the researchers of this paper for final analyses.
NHID DB
The numbers of deaths (numerator) and population (denominator) in NHID were obtained from the eligibility DB from 2004 to 2015. Death certificate data were collected by Statistics Korea and were individually linked to the eligibility DB. This data linkage using the eligibility DB from the NHIS was performed internally in Statistics Korea using unique 13-digit personal identification numbers. The NHIS constructed 1-year follow-up dataset using a person-year approach for the numbers of population and deaths. From the NHIS, we obtained aggregate data on the numbers of deaths and population denominators within the calendar years (2004 to 2015), gender, age (0, 1–4, 5–9, 10–11, …, 85+), and regions (national, provincial, and municipal levels).
KOSIS data
The numbers of deaths and population according to the calendar years (2004 to 2015), gender, age (0, 1–4, 5–9, 10–11, …, 85+), and regions (national, provincial, and municipal levels) were obtained from death certificate data and resident registration data, respectively, provided by the KOSIS. Mid-year estimates of resident population were used as population denominators. From the KOSIS web page (3), we collected annual life tables at national level from 2004 to 2015 and life tables at 17 provinces in 2014 (which were the most recent available year at the time of the study).
Statistical analysis
Crude mortality rates per 100,000 across the national, provincial, and municipal levels were calculated for both NHID DB and KOSIS data. We calculated LE at birth using life table method. Annual life tables at national level from 2004 to 2015 and life tables at 17 provinces in 2014 were constructed using NHID DB. For municipal levels, we used six-year (2004–2009 and 2010–2015) aggregate data for population and deaths to calculate stable LE for municipal areas. Previous studies reported that the minimum population required for stable LE was 5,000 (456). Thus, municipal level life tables were constructed using the 6-year probabilities of death by municipal regions for the six year periods 2004–2009 and 2010–2015 for both NHID DB and KOSIS data. Separate life tables were constructed for men and women. We employed the Kannisto-Thatcher method to expand the open-ended age interval 85+ to estimate the probability of dying for each age group of five-year age groups 85–89, 90–94, …, 120–124, 125+ (78). The average proportion of each 5-year age range lived by those who die in the age range was estimated using the iterative method described by Preston et al. (9).
We reclassified some municipal regions where the administrative areas were not exactly matched between the NHID and KOSIS during study periods (2004 to 2015). The administrative districts of NHID DB were divided into 17 provinces and 252 municipal regions based on the 2014 administrative districts in Korea. Sejong Special Provincial Municipality, which was established in 2012, was reclassified using the previous administrative district (the ‘Dong’ unit) to maintain the consistency of administrative district classification in the NHID DB. However, the administrative classification provided by KOSIS reflected the actual administrative area of each year. It was necessary to reclassify administrative districts in order to match municipal classification between the two data. Therefore, when there was an inconsistency in the administrative area between the NHID and KOSIS due to a change in the administrative district during the study period, it was reconstructed based on the most comprehensive administrative district classification. For example, four districts belonging to Cheongju (Sangdang-gu, Seowon-gu, Heungduk-gu, and Cheongwon-gu) and Cheongwon-gun in Chungbuk province were integrated into Cheongju.
We compared number of population, number of deaths, and crude mortality rate per 100,000 between NHID and KOSIS according to calendar year and sex. In addition, we evaluated agreements of crude mortality rate and LE at municipal level using concordance correlation coefficients (CCC). The CCC was recommended by Lin (10) for assessing agreement of continuous variables. The CCC measures the agreement between two measures while the Pearson correlation coefficient measures their relationship. The CCC ranges between −1 and 1. If the mean difference between the two measures is zero, the CCC will be 1. Analyses were conducted separately for men and women. All analyses were conducted using SAS V.9.4 (SAS Institute, Cary, NC, USA).
RESULTS
Over the period 2004–2015, the number of population, the number of deaths, and the crude mortality rate per 100,000 in NHID closely approximated to those in KOSIS. The population number of NHID was 98%–100% of the mid-year estimates of resident population in KOSIS. The number of deaths of NHID was 97%–99% of KOSIS. The ratio of crude mortality rate between the two data was 0.99 all over the study period (Table 1).
Table 1
Annual comparison of number of population, number of deaths, and crude mortality rate per 100,000 between the NHID and the KOSIS by sex
NHID = National Health Information Database, KOSIS = Korean Statistical Information Service.
*Mid-year estimates of resident population.
![]()
Table 2 shows the annual comparison of the gender-specific LE calculated in this study using the NHID and the LE provided by KOSIS. The absolute differences between the LEs from the two data were neither more than 0.5 years, nor exceeded 0.3 years in gender specific results. Overall, the LE of the NHID was slightly higher than the KOSIS (Table 2).
Table 2
Annual comparison of LE at birth between the NHID and the KOSIS according to sex
LE = life expectancy, NHID = National Health Information Database, KOSIS = Korean Statistical Information Service.
![]()
The LE from NHID in 2014 was compared with the LE from KOSIS in 2014 at the provincial level. The absolute differences in LE between the two data were between 0.0 and 0.6 years. The difference was the greatest in men of Sejong Special Self-Governing City where the population size among provinces was the smallest. Overall, the LE of the NHID was lower than that of KOSIS (Table 3).
Table 3
Comparison of LE at birth in 2014 between the NHID of the NHIS and the KOSIS of Statistics Korea according to province and sex
LE = life expectancy, NHID = National Health Information Database, NHIS = National Health Insurance Service, KOSIS = Korean Statistical Information Service.
![]()
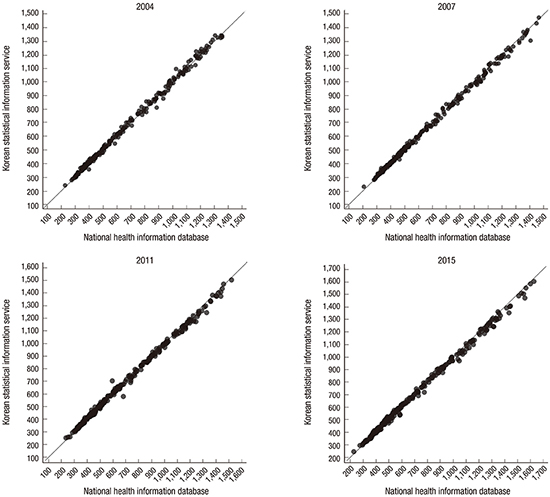
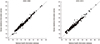
Fig. 1 shows plots comparing the crude mortality rates per 100,000 at the municipal level from NHID with those from KOSIS in 2004, 2007, 2011, and 2015. Most of the municipalities were located close to the diagonal line y = x where the crude mortality rates from NHID and KOSIS were the same (Fig. 1). The CCC between NHID and KOSIS ranged from 0.997 to 0.999 according to sex for crude mortality rates among the municipalities in all years (Table 4). For LE, the CCC between the NHID and KOSIS across the municipalities was 0.990 in 2004–2009 and 0.985 in 2010–2015 among men, while 0.952 in 2004–2009 and 0.914 in 2010–2015 among women, respectively (Table 5). LE in municipalities were generally fitted to the diagonal line in both periods 2004–2009 and 2010–2015 (Fig. 2).
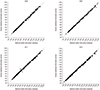 | Fig. 1Comparison of local districts' crude mortality rate between the NHID and the KOSIS in selected years among overall population.
NHID = National Health Information Database, KOSIS = Korean Statistical Information Service.
|
Table 4
Correlation coefficient and concordance correlation of local districts' crude mortality rate per 100,000 in NHID and crude mortality rate in the KOSIS
NHID = National Health Information Database, KOSIS = Korean Statistical Information Service, CI = confidence interval.
![]()
Table 5
Correlation coefficient and concordance correlation of local districts' LE at birth in NHID and LE at birth in the KOSIS
LE = life expectancy, NHID = National Health Information Database, KOSIS = Korean Statistical Information Service, CI = confidence interval.
![]()
DISCUSSION
The results of this study showed that the agreement rate for the crude mortality rate and LE between NHID and KOSIS were substantial. The numbers of both population denominators and mortality numerators from NHID were very close to the numbers from KOSIS and the mortality rates and LEs from two different data were about the same. Considering that the data from KOSIS reflect the official information on Korean population and mortality rates, the results of this study indicate that the NHID is a good source for monitoring mortality and LE across the national, provincial, and municipal levels with representing the entire Korean population. Therefore, this study provided evidence that it would be possible to perform monitoring of health status and health equity by using the NHID sub-DB including the eligibility DB, the healthcare utilization DB, and the health screening DB.
Since the eligibility DB is highly consistent with the KOSIS, it can be used to monitor the health status at the national, provincial, and municipal levels as well as to monitor the health equity. For example, using the healthcare utilization DB linked to the eligibility DB, it would be possible to employ the outpatient and inpatient utilization data for the study of the disease prevalence after considering the characteristics of each disease. Moreover, it would be also possible to use the health screening DB linked to the eligibility DB as a monitoring data source of health behaviors and related disparities within and between the municipalities considering the large sample size of the health screening DB. Furthermore, more sophisticated epidemiologic studies such as studies of temporal trends and retrospective cohort studies which might be useful in the construction of the etiology or validation of associations between risk factors and outcome (mortality and morbidity) would be possible using the NHID. With the nationwide health surveys, such as the KNHANES and CHS, it is possible to conduct an ecological study that reveals the link between the area characteristics and the relevant health gaps across regions.
In addition, using the NHI premium as an income proxy variable, it would be possible to establish a monitoring system for health inequality across the national, provincial, and municipal levels (11). To this end, the NHID can be used to expand health equity indicators and to evaluate the health equity goal of the National Health Plan 2020. Health inequalities in various health outcome indicators according to income level, occupations, and disability status can be described, and health disparities can be shown at the sub-group level covering the municipal units. Thus, in the long term, NHID can contribute to setting a policy agenda for health equity and identifying intervention strategies. In addition, wider use of NHID may well contribute to the national health promotion policy as being a part of the health and health equity monitoring system.
 XML Download