

 PDF
PDF ePub
ePub Citation
 Print
Print


INTRODUCTION
The ingestion of pesticides is a common method of suicide in numerous Asian countries (12). Patients who have ingested pesticides are candidates for aggressive therapy, which can improve their chances of survival. It is therefore important to be aware of the toxicity of all chemical components of pesticides.
Xylene is an aromatic hydrocarbon widely used as a solvent in industry, including pesticide manufacturing. Not all, but many pesticide formulations include xylene as a solvent, and its content can range from 10 to 80 volume%, depending on the pesticide product (34). This indicates that a person who ingests pesticide, either accidentally or intentionally, may be exposed to large amounts of xylene.
Exposure to xylene in any fashion can cause modest, acute toxicity with LD50 values ranging from 200 to 5,000 mg/kg for animals (National Institute for Occupational Safety and Health criteria for a recommended standard: Occupational exposure to xylene, 1975). Xylene is known to be absorbed by all routes of exposure and is rapidly distributed throughout the body because of its lipophilic properties (U.S. Department of Health and Human Services, Public Health Service, Agency for Toxic Substances and Disease Registry, www.atsdr.cdc.gov).
With a known or suspected pesticide poisoning, most clinical toxicologists on duty will have questions at the bedside, such as, “Does this pesticide formulation contain xylene?” and “What is the xylene content of the pesticide?” Nevertheless, many manufactures are not willing to divulge proprietary formulations, causing a conflict between the manufacturer's desire to protect intellectual property and the physician's duty to treat the patient appropriately.
Xylene in blood undergoes significant biotransformation, producing methyl hippuric acid (MHA), which is rapidly excreted in the urine (5). The amount of MHA in urine has been recommended as an indicator of occupational exposure, and the American Conference of Governmental Industrial Hygienists has recommended an upper limit for this indicator, called a biological exposure index (BEI), of 2.0 g MHA/L urine (SG 1.016).
However, it is not clear whether urine MHA accurately represents the amount of ingested xylene in acute pesticide intoxication, in which a relatively large amount of xylene is ingested at once.
In order to observe the relationship between the ingested amount of xylene and urine MHA, we measured urine MHA in 11 patients with acute pesticide intoxication, in which pesticide formulations were available. A relationship between ingested xylene volume and urine MHA was established and was used to estimate the ingested amount of xylene from urine MHA levels in 194 patients with acute pesticide intoxication in which the formulations were not available. Finally, we investigated whether MHA in urine is a clinical marker in acute pesticide intoxication.
MATERIALS AND METHODS
Case recruitment
Between January 2014 and December 2015, 205 patients with acute pesticide poisoning were treated at the Institute of Pesticide Poisoning at Soonchunhyang University Cheonan Hospital, a tertiary referral center for toxicology patients, which is located in a rural area of Korea. All patients had ingested undiluted pesticide to commit suicide. Immediately after the arrival of the patient to our hospital, we demanded the formulation of the pesticide, which had been ingested by the patient, from the manufacturer. Pesticide formulations were provided in 11 cases, but not in the remainder (194 cases).
Patients were excluded if they were in critical condition, such as in shock or in a coma. Patients who arrived 12 hours or more after pesticide ingestion were also excluded. The pesticide type was confirmed by inspecting the pesticide bottle that was presented by the individual accompanying the patient. Upon admission, patients received standardized medical emergency treatment. Gastric lavage was performed if the patients arrived within 2 hours of ingestion. Blood samples for arterial blood gas analysis and blood chemistry, including electrolytes, were drawn in the emergency room. The blood chemistry test included blood urea nitrogen (BUN), creatinine, glucose, lactic acid, liver enzymes, albumin, globulin, and urate. The common name of the pesticide was used, as determined by Technical Committee 81 of the International Organization for Standardization (ISO/TC81). The amount of pesticide ingested was estimated by the number of mouthfuls (1 mouthful = 20 mL), as stated by the patient, or calculated from the amount remaining in the pesticide bottle. The ingested volume of xylene in the 11 known cases was calculated from the content of xylene in the pesticide formulation and the ingested volume of pesticide (Table 1).
Table 1
Demography, chief ingredients, and ingested volume of pesticide and xylene in 11 cases in which the pesticide formulations were available
![]()
Urine sampling and assay for MHA
In our preliminary study, the MHA levels peaked several hours after ingestion of xylene and decreased sharply approximately 12 hours later (Supplementary Figs. 1 and 2). This was the reason that we excluded patients who arrived later than 12 hours after ingestion. In the emergency room, 10 mL of urine was collected via urine catheter and stored in −70°C until assay. The analysis of MHA in urine was performed by high-performance liquid chromatography (HPLC). In brief, the urine sample was filtered (Millex HV, 0.45 μm; Nihon Millipore, Tokyo, Japan) and diluted five times with Milli-Q water with no chemical treatment. For HPLC chromatography, a Hitachi HPLC system (Hitachi High-technologies Corp., Tokyo, Japan), comprising an L-2130 low-pressure pump, an L-2200 autosampler, an L-2300 column oven, and an L-2400 UV detector were used. The concentration of urine MHA was calculated as gram per gram of creatinine. The assay sensitivity was 0.001 g/g creatinine. The background urinary levels of MHA in non-exposed individuals (no industrial workers, no history of pesticide spraying during the last month, n = 40, male 30, female 20, aged 40–70 years) were < 0.01 g/g creatinine (range: 0.00–0.01 g/g creatinine) in our preliminary study.
Derivation of a regression model to predict the ingested xylene volume from urine MHA
The correlation between urine MHA and ingested amount of xylene/kg of body weight was measured in the 11 patients. From the relationship, we extrapolated a predictive model of which the accuracy between true value (TV) and predictive value (PV) was estimated by the concordance correlation coefficient (CCC) (67). From the equation of the predictive model, we estimated the ingested volumes of xylene in the remaining 194 patients with acute pesticide intoxication.
Effect of urine MHA on the clinical outcome
The relationship between urine MHA and parameters for both clinical outcome and seriousness of the toxic symptoms was assessed in two sub-groups of organophosphate and pyrethroid classes, because the number of patients was not sufficient for statistical analysis in the other pesticide classes.
The parameters used to assess clinical outcomes included the death rate, length of hospital stay (days), length of intensive care unit (ICU) stay (days), mechanical ventilator use during therapy, and the seriousness of the toxic symptoms. The seriousness of the toxic symptoms was evaluated using the Workload Management System for Critical Care Nurses (WMSCN) (8) and Acute Physiology and Chronic Health Evaluation II (APACHE II) scores (9). According to the workload of the ICU nurse, the seriousness of the toxic symptoms was either WMSCN class 1 (patient able to care for themselves, minimal degree of nursing care required), class 2 (moderate degree of nursing care required), class 3 (acute degree of nursing required), class 4 (intensive degree of nursing required), class 5 (continual nursing required), or class 6 (intensive care from two or more nurses required). The APACHE II score was calculated using the patient's age and the following 12 routine physiological measurements: PaO2, body temperature, blood pressure, arterial pH, heart rate, respiratory rate, serum Na+ and K+, creatinine, hematocrit, white blood cell (WBC) count, and Glasgow Coma Scale score. These measurements were taken during the first 24 hours after admission.
Statistical analysis
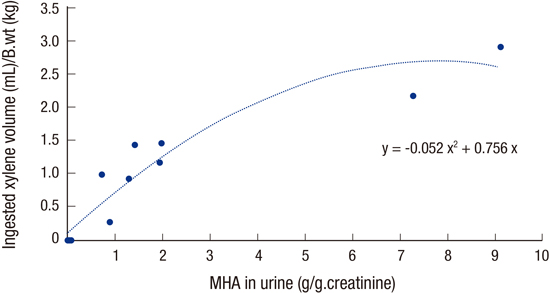
Data are presented as the means ± standard deviation (SD) or the median values with interquartile ranges (IQR). From the relationship between the urinary MHA level and ingested amount of xylene in the 11 known cases, we derived a quadratic regression model (Fig. 1).
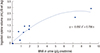 | Fig. 1Correlation between urine MHA level and ingested amount of xylene in 11 cases. The best fit equation between urine MHA and ingested amount of xylene was; y (ingested amount of xylene, mL/kg = −0.052x2 + 0.756x (x = MHA in urine in g/g creatinine).
MHA = methyl hippuric acid.
|
The accuracy between the TV and PV of the ingested xylene volume was estimated by the CCC (67) (scatterplot with TV and PV, and Bland-Altman plot; Fig. 2). With this equation, we estimated the ingested xylene volume in the 194 patients with acute pesticide intoxication. According to the estimated ingested xylene volume, we categorized the pesticide classes into xylene-rich and xylene-free pesticide classes.
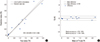 | Fig. 2The accuracy between the TV and PV of the ingested xylene volume. (A) Scatter plot of TV and PV for ingested xylene amount. (B) Bland-Altman plot. Horizontal lines are drawn at the mean difference, and at the limits of agreement, which are defined as the mean difference ± 2 times the SD of the differences. Note that all data are within 2 SDs of the mean value.
TV = true value, PV = predictive value, SD = standard deviation, CCC = concordance correlation coefficient, CI = confidence interval.
|
The relationship between the potential risk factors for clinical outcome, including age, sex, urine MHA, pesticide ingested volume, time lag before arrival to hospital, and cholinesterase (in the organophosphate group), and the parameters for seriousness of the toxic symptoms (i.e., APACHE score, WMSCN, length of hospital and ICU stay, mechanical ventilator use, and death rate) was assessed by univariate regression analysis. All variables with a P value < 0.05 in the univariate analyses were considered statistically significant. All data were analyzed using R (The R Foundation for Statistical Computing, Vienna, Austria) version 3.1.2 or SPSS (SPSS, Inc., Chicago, IL, USA) version 17.0 for Windows.
RESULTS
The mean age and weight of the subjects (205 cases; male/female = 122/83) was 62.5 ± 16.0 years and 62.5 ± 7.8 kg. They ingested 13 classes of pesticides: paraquat (68 cases), glyphosate (46 cases), glufosinate (25 cases), organophosphate (24 cases), pyrethroid (14 cases), synthetic auxin (9 cases), chloroacetamide (6 cases), fungicide (4 cases), neonicotinoid (3 cases), carbamate (2 cases), dinitroaniline (2 cases), oxadiazole (1 case), and pyridalyl (1 case). The mean ingested volume was 140.8 ± 123.6 mL (median value 100 mL; minimum (min) and maximum (max), 10 and 500 mL). The time interval between ingestion and arrival to the hospital was 5.5 ± 5.3 hours (median 3 hours; min and max, 1 and 24 hours).
In the 11 cases in which formulations were available, demography (age, sex, height, and weight), chief ingredients, ingested volumes of both pesticide product and xylene, and time lag to the hospital after ingestion are presented in Table 1.
Quadratic regression analysis showed that urine MHA levels, measured within 24 hours of xylene ingestion correlated significantly with the volume of ingested xylene. The best fit equation between urine MHA and ingested amount of xylene was;
where x = MHA in urine (g/g creatinine) (Fig. 1). The CCC between urine MHA levels and the volume of ingested xylene was validated on a scatter plot of TV and PV for ingested xylene amount (CCC = 0.94; 95% confidence interval = 0.81–0.98), and Bland-Altman plot (Fig. 2).
Xylene-rich pesticide class
The MHA in urine was greater than 0.01 g/g creatinine (upper limit of the xylene non-exposed control group) with 5 classes of pesticides. The estimated xylene volume of ingestion was oxadiazole (n = 1; 1.78 mL/kg), dinitroaniline (n = 2; 0.94 and 0.15 mL/kg), chloroacetamide (n = 6; median = 0.296; IQR = 0.020–0.985; min = 0.015; max = 1.023 mL/kg), organophosphate (n = 24; median = 0.458; IQR = 0.149–1.728; min = 0.045; max = 3.074 mL/kg), and pyrethroid (n = 14; median = 0.728; IQR = 0.041–1.766; min = 0.03; max = 3.026 mL/kg) (Fig. 3).
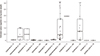 | Fig. 3Estimated ingested volume of xylene according to pesticide class. The pesticide classes in which the ingested xylene volume was greater than the upper limit of the base line (i.e., 0.01 g/g creatinine) in more than one patient were chloroacetamide (n = 6), dinitroaniline (n = 2), organophosphate (n = 24), oxadiazole (n = 1), and pyrethroid (n = 14).
|
Xylene-free pesticide class
No patient showed significant urine levels of MHA in the paraquat, glyphosate, glufosinate, synthetic auxin, fungicide, neonicotinoid, and carbamate groups. Therefore, these groups had no significant ingestion volume of xylene (Fig. 3).
Association of pesticide intoxication severity with potential risk factors in pesticide intoxication
In the pyrethroid group, the MHA levels in urine were significantly associated with the necessity to use mechanical ventilator support (P = 0.010) (Table 2). In addition, there was a significant association between the APACHE II scores and age (P = 0.034). However, there was no significant association between the urine MHA and other parameters, including APACHE II score, WMSCN, length of hospital and ICU stay, and death rate.
Table 2
Association of intoxication severity with the potential risk factors in patients with organophosphate and pyrethroid intoxication
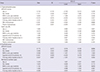
Note that, in organophosphate group, there is a significant association between APACHE II score and plasma cholinesterase, and death rate with sex (lower in female). In the pyrethroid group, there was a significant association with APACH II score and age, and MHA in urine with mechanical ventilator apply. Mechanical ventilator apply: under the necessity.
SE = standard error, CI = confidence interval, APACHE II = Acute Physiology and Chronic Health Evaluation II, MHA = methyl hippuric acid, RBC = red blood cell, OR = odds ratio.
P value < 0.05 was considered significant
![]()
In the organophosphate group, there was a significant association between the APACHE II scores and the erythrocyte cholinesterase levels (P = 0.032), and the death rate was significantly lower in females than in males (P = 0.028) (Table 2). However, there was no significant association between the MHA in urine and all parameters for the severity of the toxic symptoms, including APACHE II score, WMSCN, length of hospital and ICU stay, use of mechanical ventilator, and death rate.
DISCUSSION
A remarkable result in the current study is the identification of the xylene-rich pesticide class by measuring MHA in urine. If the formulation of each pesticide were available in clinical practice, then this type of study would be unnecessary. Unfortunately, many pesticide manufactures will not disclose their formulations, and the labels on the pesticide bottles indicate the chief ingredient with the general term, “solvent” or “surfactant.” In these cases, the solvent could be xylene, methyl alcohol, or other chemicals. In addition, the treating physician should be informed of the precise pesticide formulation, in order to treat the patient appropriately. Considering this, we believe that this type of study is needed until such an illogical system is reformed.
In this study, we have demonstrated that there was a significant association between MHA levels in urine and the necessity of ventilator support in the pyrethroid intoxication patient group. This association was not observed in the organophosphate group. We cannot explain the cause of this discrepancy. It may be due to the differences between pyrethroid and organophosphate in the manifestation of toxic symptoms in humans.
The toxic effects of pyrethroids are mediated through preventing the closure of voltage-gated sodium channels in axonal membranes. A type I pyrethroid produces reflex hyperexcitability and tremors. A type II pyrethroid produces salivation, hyperexcitability, choreoathetosis, and seizures (1011). Both produce potent sympathetic activation. However, the involvement of the central nervous system and lungs is less common in pyrethroid intoxication (12). In contrast, organophosphate pesticide is classically considered to cause an acute cholinergic syndrome with decreased consciousness, respiratory failure, and a delayed intermediate syndrome that requires prolonged ventilation. Therefore, respiratory failure by central and peripheral mechanisms is the primary cause of death in organophosphate poisoning (1314).
Exposure to xylene can occur via inhalation, ingestion, eye contact, or skin contact. Xylene causes health effects from both acute (< 14 days) and chronic (> 365 days) exposure. In industrial environments, the exposure level of xylene is tightly regulated in almost every country. The American Conference of Governmental Industrial Hygienists has recommended exposure limits for xylene of 100 ppm (time-weighted average), and 150 ppm (short-term exposure limit). On the contrary, there is no specific recommendation for xylene exposure limits from pesticides. For example, if the content of xylene is up to 50% in a pesticide, 50% of the fumes or particles during pesticide spraying may be composed of xylene, which may cause a problem for the health of farmworkers.
In the same way, when a patient ingests a pesticide, accidentally or intentionally, the treating physician should consider xylene toxicity. However, little is known about the hazards of xylene in pesticides. In clinical practice, it is impossible to tell if xylene has induced toxic symptoms in patients who have ingested pesticide, because pesticide formulations are typically composed of several toxic chemicals, such as the active ingredient, solvents, surfactants, antifreeze, volume expanders, and buffers. Considering that xylene is a neurotoxin (15), it may be the chemical responsible for respiratory failure in pesticide intoxication. However, during respiratory failure in organophosphate intoxication, the toxic symptoms of xylene and its metabolites may be masked by that of the organophosphate, because organophosphorus compounds are so toxic that any additional toxicity of xylene is unlikely to determine whether the patient requires mechanical ventilation. Our current study included a patient who ingested approximately 175.6 mL of xylene, which is an extraordinarily large amount for one person. The urine MHA was 9.12 g/g creatinine, and the patient survived without critical toxic symptoms. This result indicates that acute xylene intoxication caused by oral ingestion is not always life-threatening.
This study has several limitations. First, because there were few patients in some pesticide classes, the sub-group analysis for association between MHA levels and clinical outcome was applied in only two classes, organophosphate and pyrethroid. Second, all of the patients ingested an undiluted pesticide that was comprised of various active ingredients and additives. Consequently, the toxic symptoms arose from the mixture of chemicals. Therefore, our patients were inappropriate subjects to observe the toxic symptoms of xylene alone. Finally, other chemicals in the pesticide formulations may have altered xylene metabolism.
Even with the above limitations, our study demonstrates a significant correlation between the xylene metabolite, MHA in urine and the ingested amount of xylene in various types of pesticides. High MHA in urine was detected in 5 classes of pesticides (i.e., oxadiazole, dinitroaniline, chloroacetamide, organophosphate, and pyrethroid). In contrast, urine MHA was not detected in the paraquat, glyphosate, glufosinate, synthetic auxin, fungicide, neonicotinoid, and carbamate classes. There was a significant association between urine MHA levels and ventilator necessity in the pyrethroid group; this association was not observed in the organophosphate group.
In conclusion, our results suggest that urine MHA is a surrogate marker for xylene ingestion in patients with acute pesticide intoxication, and high levels of MHA may be a risk factor for clinical outcome with some pesticide poisonings.
 XML Download