

 PDF
PDF ePub
ePub Citation
 Print
Print


INTRODUCTION
Monitoring and reducing health disparities by socioeconomic status have long been an important health policy goal. Studies have shown the dynamic nature of socioeconomic disparities in cancer incidence and mortality from major cancers (123). Such disparities may even be widening in some instances (4). Cancer has been the leading cause of death in Korea since the 1980s and is the most burdensome disease (5). However, although ecological studies on the effect of socioeconomic status on mortality at the regional level in Korea exist (6), they are rare. Reliable data on reporting cancer-related health disparities among different socioeconomic groups is required to set and track the national goals for reducing such disparities.
Cancer mortalities are determined by individual characteristics and behaviors, but the social contexts in which people live also have an effect. Several cancer incidence and mortality studies in European countries have implied that there is wide variation among geographic areas because of various exposures to risk factors such as air pollution, occupational exposures, education, and differences in lifestyle (7). Moreover, a large proportion of the disparities may be attributed to socioeconomic status. It has been shown that the social context of neighborhoods is related to both health condition (89) and mortality from cancer, violence, or circulatory diseases (10111213). Population-based cancer registry data from the Surveillance, Epidemiology, and End Results (SEER) in the United States has reported consistent socioeconomic patterns in cancer incidence (14). Another study suggested that the nature of neighborhoods and communities such as shared living conditions and patterns of social relationships between individuals and groups initiates processes may influence health behaviors and/or psychosocial stress factors which could have a negative impact on immune functioning (15). Lower area-level socio-economic status has also been reported to be associated with higher risk of a certain cancer (1617) and all-cause and site-specific cancer mortality (1819).
In Korea, overall mortality has decreased significantly, but mortality preventable by primary prevention has shown greater reduction than mortality preventable by appropriate medical services did (20). Age-standardized mortality is inversely associated with educational attainment, and the level of socioeconomic all cause-mortality inequalities remained virtually unchanged in both genders from 1990 to 2000 (21). Among major causes of death, mortality from external causes, such as traffic accident and suicide, increased progressively with decreasing socioeconomic level, but mortality from avoidable cancers did not (22). Understanding the association between area-level socioeconomic status and cancer outcomes is critical for appropriately targeting interventions to reduce area-level and socioeconomic disparities (23). Although these studies stressed the importance of socioeconomic factors on mortality due to various causes, none of them investigated the effect of socioeconomic level on cancer survival outcome.
This study examined whether there was an association between area-level deprivation measure as a comprehensive area-level socioeconomic status and survival time for patients who had been diagnosed with major cancers in the entire population of the second largest city in Korea in the year of 2010 and 2011. This investigation has the potential to help fill the gap in the literature regarding the influence of area-level socioeconomic environment on major cancer mortality and survival time.
MATERIALS AND METHODS
Data analyzed for this study were obtained from the Busan Regional Cancer Registry. Since 1999, the Korea Central Cancer Registry (KCCR) has collected cancer incidence data nationwide by integrating a hospital-based KCCR database with data from regional cancer registry programs. The Busan Regional Cancer Registry, which is one of these regional cancer registry programs, has characteristics except catchment area that are the same as the KCCR. The KCCR has been described in greater detail elsewhere (24). The completeness of cancer registration in Korea is estimated to be 97.8% (6) and the Busan Regional Cancer Registry has been registering and following up subjects with cancer since the time of diagnosis. In this study, we investigated major cancer data (stomach, colon, liver, lung, breast, cervix, and thyroid) for the entire Busan population. Using the primary diagnoses of cancer recorded in the registry, the national mortality data in the registry was linked to identify date of death and mortality due to cancer and other causes of death. Additionally, information from other demographical regional registries were linked at the individual level by matching the national 13-digit civic registration number assigned to each person in Korea for his or her lifetime and information about behavioral risk factors and family history was examined through medical records by expert medical record administrators. The civic registration numbers were replaced by serial numbers to maintain the anonymity of all subjects studied.
We analyzed 10,902 medical records-investigated cancer registrants (completion rate = 89.9%) among those who were mainly diagnosed with seven selected cancers at 5 university hospitals (n = 12,121) that diagnosed 49.9% of cancer patients in Busan (n = 24,303) from January 1, 2010 to December 31, 2011. The follow-up period started on date of diagnosis and continued until death or the end of the study period on December 31, 2014.
Outcome variables
The outcome variables were mortality and survival time for seven cancer sites — stomach, colorectal, liver, lung, breast, cervix, and thyroid cancers. Survival time was measured in terms of time from diagnosis to death or the end of the study. We used the Busan Cancer Registry to identify the primary diagnoses of cancer in the study population during the study period. Only primary neoplasms of designated area classified according to the 10th revision of the International Classification of Diseases (ICD-10) were included in the study. The mortality due to a certain cancer was identified in the Cause of Death Registry during the same period. The WHO's ICD-10 was used to define mortality due to each cancer.
Explanatory variables
Individual variables included gender, age at the start of the study, body mass index (BMI), residential area at the start of the study, tumor stage, smoking and drinking habits, family history, diagnosis path, and area-level deprivation index. Other explanatory variables were collected but were not included in the analysis because of a lot of missing data.
Area-level deprivation index
We calculated the area-level deprivation index using 2010 Korean Census data to comprehensively measure area socioeconomic status. ‘Dong’ is the smallest administrative unit based on the classification of the Ministry of Public Administration and Security in Korea; thus, we used Dong as the unit of local area to define a residential area sharing the same area-level deprivation index. The method to produce the area-level deprivation index has been described in detail elsewhere (6). The deprivation index used information from eight indicators: residents living alone, female household head, no housing ownership, low education level (less than high school graduation among those aged 35–64), low occupational social class (low social class among economically active household heads aged 15–64 according to occupation based social class classification) (5), the divorced or separated in marital status among those aged 15 or over, population aged 65 or over, and unemployment among males aged 15–64. The percentage of each indicator was calculated at the Dong-level and then standardized to the z-score. The standardized z-scores for the eight indicators were summed up to create the area-level deprivation index, which was coded in both continuous scale (z-scores) and categorical scale (quartiles). Quartile 1 comprised the least deprived, i.e., richest, areas and quartile 4 represents the most deprived, i.e., poorest, areas socioeconomically.
Statistical analysis
Life tables were generated for 1-, 3-, and 5-year survival rate by cancer type for each level of risk factors and comparisons between groups were made using the log-rank test. In view of very small counts in some categories of the prognostic factors, for comparison, we re-categorized them in the analysis. For example, there were very few subjects younger than twenty years old in this study, the age at diagnosis was grouped into three age groups: 0–44, 45–64, or ≥ 65 years; BMI was grouped into two categories: normal (BMI < 25) or overweight (BMI ≥ 25); for smoking and drinking habits, the two categories (‘yes in the past,’ ‘yes in the present’) were combined into one category as ‘Yes.’ Because the subjects living in the same Dong have the same area-level deprivation index, a multi-level approach was used to analyze the data. Multivariate multi-level Cox regression models with frailty were used to identify factors that were associated with patient survival. Statistical significance was assumed for a two-tailed P value less than 0.05. All statistical analyses were performed using SAS software (version 9.4; SAS Inc., Cary, NC, USA).
RESULTS
During 2010 and 2011, 5,177 men and 5,725 women in Busan were entered in the registry with diagnosis of one of the seven cancers — stomach, colon, liver, lung, breast, cervix, or thyroid cancer. Each cancer diagnosis was classified into one of the seven cancer types using ICD-10 code. Table 1 presents the general demographic characteristics of the study population by cancer site. Among a total of 10,902 subjects in the registry, 2,621 (24.0%), 1,533 (14.1%), 1,191 (10.9%), and 1,426 (13.1%) were primarily diagnosed with stomach, colorectal, liver, and lung cancers, respectively. The percentages of female patients with these four cancer types were 28.9%, 36.4%, 25.2%, and 24.9%, respectively. To describe additional baseline characteristics across the four area-level deprivation groups, Table 2 shows the prevalence (%) of smoking, drinking, obesity, cancer stage, and diagnosis path for the subjects in each area-level deprivation quartile. Overall much higher smoking and drinking rates were prevalent among men than women. For female patients, higher smoking rates were noted to be more prevalent in more deprived groups. Higher percentages of late stage cancer and diagnosis by chance or symptom were observed toward more deprived group, respectively.
Table 1
Demographics of individuals diagnosed with major cancers during 2010 and 2011 in Busan, Korea
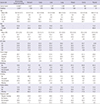
Table 2
Prevalence (%) of smoking, drinking, obesity, cancer stage, and diagnosis path for the subjects diagnosed with major cancers between 2010 and 2011 in Busan, Korea

The 1-, 3-, and 5-year survival rates by cancer site are presented in Table 3. Among subjects primarily diagnosed with lung cancer, for example, there was a 51.0%, 26.1%, and 19.3% chance of surviving 1-, 3-, and 5-year, respectively. The median survival time at which half the patients were expected to be alive was 12.4 months with a 95% confidence interval (CI) (11.3–13.8 months). Among male subjects primarily diagnosed with lung cancer, there was a 47.2%, 22.1% and 16.8% chance of surviving 1-, 3-, and 5-year, respectively, with the median survival time of 10.8 months with a 95% CI (9.5–12.2 months). Among female subjects primarily diagnosed with lung cancer, there was a 62.5%, 31.2%, and 24.6% chance of surviving 1-, 3-, and 5-year, respectively, with the median survival time of 20.3 months with a 95% CI (16.9–26.1 months). The difference in survival curves between genders was statistically significant (P < 0.001). We found that the 1-, 3-, and 5-year survival rates appear to be higher in female, younger age, and least deprived group when compared to the other categories of gender, age, and area-level deprivation variables. Evaluation of the area-level deprivation variable revealed that 1-, 3-, and 5-year survival rates seemed to decrease with higher area-level deprivation. When compared to the least deprived group (Q1), the estimated 1-, 3-, and 5-year survival rates became successively smaller in the next more deprived group for each cancer type except for lung cancer. For lung cancer, although the estimated 1-, 3-, and 5-year survival rates became successively smaller in the next more deprived groups up to the third quartile, the survival rates in the fourth quartile (most deprived group) were higher than those in the least deprived group. Since this observation is rather based on an exploratory comparison of survival rate among different subgroups we should consider statistical modeling of survival time with covariate adjustment.
Table 3
Cancer specific survival rates for patients diagnosed with major cancers during 2010 and 2011 according to different age group, gender, area-level deprivation quartile, and diagnosis path
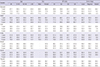
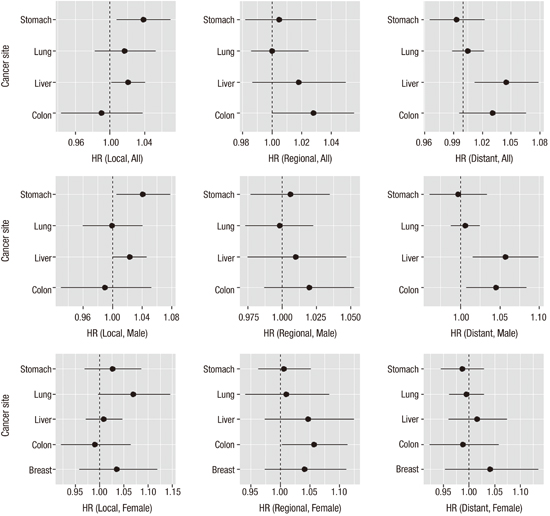
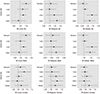
Table 4 summarizes the results by cancer sites from a multi-level multivariate survival analysis using Cox regression models. Among the covariates considered in Table 1, family history was removed from the analysis due to high missing rate. For each cancer type, increasing age at diagnosis, male sex, more growth of cancer, and diagnosis path other than regular checkup were identified as independent factors that carried increased survival mortality risk. Smoking was found to be significantly associated with higher mortality hazard rate for lung, breast and cervix cancers only. Drinking habit and family history appeared to be related with higher hazard rate for each cancer but none were statistically significant. In particular, a positive association was observed between higher extent of tumor growth and higher hazard rate and this association were consistently remarkable for each cancer type after adjusting for other covariates effects. The area-level deprivation index was significant in the model less frequently although gender and age were consistently significant risk factors in the model. For all cancer sites, when compared to the least deprived group, the survival hazard ratios (HRs) (95% CI) were 1.08 (0.99–1.18), 1.23 (1.12–1.36), 1.36 (1.21–1.53) for the second, the third, and the fourth (most deprived) quartile of the area-level deprivation index groups, respectively. The estimated survival HRs appeared to increase with increased levels of deprivation but the association between higher deprivation and shorter survival time seemed to be significant in major cancers studied in this study. Some notably significant effects of area-level deprivation were observed in colon (HR [95% CI] for Q4 vs. Q1 was 1.39 [1.03–1.87]), liver (Q3 vs. Q1 was 1.24 [1.02–1.51]; Q4 vs. Q1 was 1.38 [1.10–1.74]), and lung (Q3 vs. Q1 was 1.18 [1.00–1.40]) cancers. We noted that there were large disparities of survival times among different tumor stage thus we conducted a stratified survival analysis by tumor stage. We obtained similar results (Table 5) and presented the estimated HRs and their CIs by each tumor stage and gender in Fig. 1. Overall, with localized stage, we observed significant effect of area-level deprivation for stomach and liver cancers and with regional stage we observed significant effect of area-level deprivation for colon cancer. Compared to females, more significant effects of area-level deprivation were observed in the male group (local stomach, regional liver, and regional colon cancers).
Table 4
Cancer specific HRs and their 95% CIs for major cancers by important prognostic factors using the multi-level multivariate Cox proportional hazard model
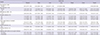
Table 5
Cancer specific HRs and their 95% CIs for major cancers by important prognostic factors using the stratified multi-level multivariate Cox proportional hazard model
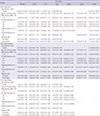
Fig. 1
Multivariate-adjusted HRs and 95% CIs for cancer-specific survival time from a stratified analysis by tumor stage. HR for one unit change of area-level deprivation as continuous scale was presented. Larger value of area-level deprivation index corresponds to more deprivation. Black circles represent the estimated HR and solid horizontal lines represent the 95% CI.
HR = hazard ratio, CI = confidence interval.
DISCUSSION
In this study, we have presented a comprehensive analysis of socioeconomic inequalities in patient survival from major cancers — stomach, colorectal, liver, lung, breast, cervix, and thyroid cancers. New analyses of area-level deprivation disparities in cancer survival spanning over a decade are a particularly novel feature of the study. Analysis of survival time with comprehensive socioeconomic measure with other important risk factors in cancer adds to the extensive literature on cancer survival disparities.
The main findings of this study were that after adjusting important individual-level prognostic factors, the HRs of cancer mortality are higher for subjects living in more deprived areas than among subjects living in affluent areas and the effect were statistically significant for several cancers — colon, liver, and lung cancers although the associations did not appear consistent for all area-deprivation levels. This supports the findings of previous studies that showed significant associations between socioeconomic status and cancer survival (2526). The results also confirm the findings of studies that showed that an inverse relationship between area-level socioeconomic status and cancer mortality. The present study represents a meaningful contribution as studies of socioeconomic inequality on cancer survival in Korea are scarce.
It should be noted that our study has some limitations. First, although data from Busan Regional Cancer Registry include the basic clinical records for more than 150,000 cancer patients residing in Busan, we were unable to obtain the data on important concomitant variables because of complicated coordination of data from different sources. Although cancer mortality data collection in Busan appears to be quite complete, our results mainly apply to Busan area regarding geographic areas. Access to national level registry data may lead to results more representative of cancer mortality in Korea. For further research, we are in the process of gathering information on other confounding or mediating risk factors that may affect local area either socio-economically or environmentally.
Second, because individual socioeconomic variables (such as educational attainment and occupation) that were not completely investigated and under active review of medical records were not included in the model, we could not evaluate the extent to which the observed association between area-level socioeconomic and cancer survival could be due to compositional factors or potentially influenced by contextual factors (e.g., physical environment, neighborhood resources, policies or social norm, that might contribute to cancer survival independent of individual socioeconomic status) (23) .
Third, the use of the area-level deprivation index to measure area-level disadvantage was adequate in terms of quantifying the nature and extent of mortality inequality between areas at the Dong's level (27); however, area-level deprivation index as a composite socioeconomic index tells us little about the area-level determinants that cause the inequalities, although they do serve to indicate that places are important for monitoring health and care services.
This study also had a number of strengths. Our study population consisted of the entire population of all ages in Busan. The use of a personal identification number made it possible to link individual level data from different databases. Since enrolling newly diagnosed cancer patient into the national cancer registry is mandatory in Korea, the Busan Cancer Registry is highly complete, with very few missing subjects. In this large cohort, we practically identified all subjects with various cancers of all ages in Busan during the study period, which increases the generalizability of our result and helps improve health policy in the second largest city in Korea.
Although there are some studies in Korea that stressed the importance of socioeconomic factor on mortality due to various causes (20212223), none of them studied the effect of socioeconomic level on cancer survival outcome. To our knowledge this is the first study investigating the impact of area-level deprivation on cancer survival in Busan, Korea. The longitudinal follow-up study design enables evaluation of cancer survival by analyzing individual time to death instead of death rate in a cross-sectional study.
The importance of social conditions has been downplayed as causes of cancer either advertently or inadvertently. Many cancer research studies have focused attention on individually-based risk factors. However, the individual-level risk factors need be contextualized, by examining what puts people at risk of risks. Also area-level socioeconomic status and social support are likely to be causes of cancer, because they embody access to important resources affecting knowledge about diagnosis and risks or the effectiveness of interventions. Thus, paying careful attention to broad-based societal interventions could produce substantial health benefits for patients.
This paper presents some initial findings that pertain to the identification of health disparities from this unique database in Korea, including cancer survival disparities according to area level socioeconomic status for major cancer types. In addition, the linked database itself is described including an overview of its structure, the record linkage methodology used to create it, data confidentiality issues, the representativeness of the cancer data, and its analytic potential for research. To be able to generalize our result to the whole population in Korea, we may need to compare our results with the data from the whole population in Korea. Thus, our future research includes to obtain and to analyze the survival time from major cancers and important covariates from national database.
In conclusion, we have shown that area-level deprivation makes some contribution to the risk of mortality in subjects with major cancers after adjusting for important independent risk factors. Further analysis with more subjects should follow and future interventions should include primary preventive and care efforts targeted at lower socioeconomic populations to reduce disparities by both governments and practitioners.
 XML Download