

 PDF
PDF ePub
ePub Citation
 Print
Print


INTRODUCTION
Chronic urticaria (CU) is defined as the occurrence of wheals, angioedema or both for more than 6 weeks.1 CU is not life-threatening, although its psychological impact has been found to be comparable to that of coronary artery disease.2 The lifetime prevalence of CU is estimated to range from 0.05% to 3%.3 A nationwide epidemiologic study performed in Korea using health insurance data revealed remarkable increases in the prevalence of CU between 2010 and 2014.4
Patients with CU are usually treated following standardized guidelines in which treatment steps are adjusted according to symptom severity and responses to prior therapies.1 The clinical manifestation of CU fluctuates in its severity, with a considerable number of patients presenting in an allergy clinic without any symptoms and objective signs. Therefore, evaluating their treatment response can be a challenge. The Urticaria Activity Score (UAS) and Chronic Urticaria Quality of Life Questionnaire (CU-Q2oL) have been recommended as measures to assess disease activity and its impact on quality of life.1 However, the treatment goal of CU is complete symptom control, which cannot be assessed by the UAS and CU-Q2oL. Therefore, the Urticaria Control Test (UCT) was invented as an effort to address the lack of tools for assessing disease control.5
CU has been found to be associated with chronic stress,6 which can, in turn, affect CU activity.7 Stimulation of the hypothalamus-pituitary-adrenal (HPA) axis by stress leads to cortisol secretion from the adrenal cortex. Since more than 90% of cortisol in circulation binds to the corticosteroid-binding globulin, salivary cortisol reflects the biologically active form of serum-free cortisol.8 Since the salivary glands exhibit high levels of 11β-hydroxysteroid dehydrogenase 2,9 salivary cortisol is rapidly converted to cortisone resulting in a 2–6 times higher concentration of cortisone than cortisol in saliva.10 Meanwhile, recent technology has enabled researchers to correctly measure cortisol and cortisone levels from saliva. Indeed, increasing evidence indicates that salivary cortisol and cortisone levels mirror those in the blood.11
In the present study, we aimed to translate the original UCT into Korean (K-UCT) and to investigate its validity, reliability, applicability and associations with subjective stress scores and salivary cortisol and cortisone levels.
MATERIALS AND METHODS
Study population
Korean patients with CU aged 19 years or older were recruited. All patients could read and write the Korean language and provided signed informed consent. Patients with chronic dermatological diseases other than CU, those with other chronic disease associated with pruritus and those with diseases of the hypothalamic-pituitary-adrenal axis, such as the central nervous system and endocrine system, or other chronic inflammatory and autoimmune conditions that can affect serum cortisol levels were excluded. This study was approved by the Institutional Review Board of Ajou University Hospital (AJIRB-MED-OBS-14-294).
On the first visit (visit 1), demographics, past disease history, drug use, smoking history, and detailed information on the diagnosis of CU were obtained from the patients. The presence of atopy was determined by a skin prick test or specific IgE for common inhalant allergens. An autologous serum skin test was performed following the method suggested by the European Academy of Allergy and Clinical Immunology (EAACI)/Global Allergy and Asthma European Network (GA2LEN) task force.12 Positivity was determined when wheals induced by autologous serum reached sizes at least 1.5 mm greater than those induced by a negative control.
Standardized CU treatment was given to patients following EAACI/GA2LEN/European Dermatology Forum (EDF)/World Allergy Organization (WAO) guidelines.1 Treatment steps were classified according to the number of antihistamines and leukotriene receptor antagonists, cyclosporine or systemic corticosteroids. Patient-oriented questionnaires to assess urticaria activity, CU-specific quality of life (CU-QoL), symptom severity, perceived stress, depression and K-UCT were completed by patients before and after 4 weeks of treatment (visit 2). Additionally, physicians evaluated the urticaria symptoms of the patients using the visual analogue scale (VAS). Patients were instructed to use an internet website to complete the UAS on their own and to record UAS results on the website each day durig the study period.
Linguistic adaptation
The original version of the UCT in German was respectively translated into Korean by 2 professional German translators for whom Korean is their native language. The respective translations were compared and put together through discussion between researchers and allergy specialists. Backward translation into German was conducted by a professional Korean translator whose native language is German. This was then harmonized with the original UCT through examination of the translation process and the results as a way of reducing discrepancies and errors. The final version of the Korean UCT was tested in 5 patients with CU who showed no problems in interpreting, understanding and utilizing the questionnaires. The final version of the K-UCT was applied in this study (Supplementary Fig. S1).
Patient-reported outcome measures for CU
Various scales were employed to measure CU-related clinical features. The original UAS consists of 2 items, number of wheals and pruritus severity. Three items, distribution, duration and diameter of wheals, were added in the UAS-Ye (UAS revised by Ye et al.).14 Each item is scored between 0 and 3 for a maximum total value of 15, which indicates most actively distressing urticaria. Urticaria Activity Score Over 7 Days (UAS7) is a sum of the original 2-item UAS for a consecutive 7 days (range, 0-42).13 The CU-QoL questionnaire developed and validated for measuring quality of life (QoL) in Korean CU patients was also administered.14 CU-QoL comprises 17 items (0-4 points, respectively). Total scores are transformed to a scale ranging from 0 to 100, with higher scores indicating better QoL. The VAS was assessed by patients and physicians independently to measure the severity of CU from different perspectives. Higher scores in patient VAS severity indicate more severe CU (range, 0-100), while higher scores in physician-derived VAS control reflect more controlled CU (range, 0-100). In addition, psychologic stress was assessed using the Perceived Stress Scale (PSS), which comprises 14 items (0-4 points, respectively), with total scores ranging from 0 to 56. Depression was measured using the Center for Epidemiologic Studies-Depression (CESD) scale, which comprises 10 items (1-4 points, respectively), with total scores ranging from 10 to 40. Both PSS and CESD have been validated in the Korean population, with higher scores indicating more severe degrees of stress and depression.15
Determination of urticaria control
Physicians determined and classified the status of CU patients into 3 categories at each visit: well-controlled, partly-controlled and uncontrolled. Responsiveness to treatment was assessed at the second visit. A favorable responder was defined as maintaining well-controlled status or having improved urticaria control, such as from partly-controlled to well-controlled and from uncontrolled to partly- or well-controlled, after the 4-week treatment for CU. A poor responder was defined as staying continuously at partly-controlled or uncontrolled status or having deteriorated urticaria control.
Validation of K-UCT
Known-groups validity of the UCT was analyzed in regard to whether the K-UCT was discriminative according to physician-assessed urticaria control, between well- and partly-controlled states with uncontrolled status. In addition, changes in K-UCT were compared between control statuses and responders at the second visit. The internal consistency of the 4 items in the K-UCT was measured using the Cronbach α coefficient. Cronbach α was interpreted as follows: <0.60, unacceptable; 0.60-0.65, undesirable; 0.65-0.70, minimally acceptable; 0.70-0.80, respectable; 0.80-0.90, excellent; and >0.90, excessive consistency.5 The intra-class correlation coefficient between physician VAS control and K-UCT was also measured. Therein, coefficient values were interpreted as follows: <0.40, poor; 0.40-0.60, fair; 0.60-0.75, good; and 0.75-1.00, excellent.16
Convergent validity was assessed in regard to whether the K-UCT is correlated with other CU associated clinical scores (i.e., UAS-Ye, UAS7, CU-QoL, physician VAS control, patients VAS severity, PSS and CESD). Responsiveness of the K-UCT in accordance with treatment for CU patients was estimated as 2 different cutoff values: First, the specific value at which well-controlled CU was optimally discriminated from partly-controlled or uncontrolled CU was analyzed. Secondly, the minimal important difference (MID) was estimated, which means the minimal change in the K-UCT score with which to differentiate favorable responders from poor responders.
Measurement of salivary cortisol and cortisone levels
Saliva samples were collected using Salivette® tubes for cortisol (Sarstedt, Sevelen, Switzerland) at the outpatient visit in the morning (9 to 11 AM). Eating and brushing teeth were restricted for 30 minutes before sampling. Collected saliva was centrifuged and aliquoted for measuring cortisol and cortisone concentrations as well as alpha-amylase activity. Samples were stored at −80°C until ready for experimentation. Salivary cortisol and cortisone levels were analyzed by liquid chromatography-tandem mass spectrometry as previously described.17 Salivary alpha-amylase was determined by an enzymatic calorimetric test using the Hitachi Cobas c System (Roche, Manheim, Germany) according to the specifications and protocols provided by the manufacturer.10
Statistical analysis
Clinical characteristics were analyzed using t tests for continuous variables and Pearson's χ2 test for categorical variables. Mean differences in the K-UCT were compared using independent t tests between patients of different control status and responders. In convergent validity, a generalized estimating equations model was applied to evaluate correlations between the K-UCT and other CU associated scores adjusting for age, sex and treatment step. Receiver operating characteristics (ROC) and area under the curve (AUC) were used to evaluate screening accuracy and sensitivity of K-UCT in determining changes in urticaria control after treatment. Each score change in the K-UCT was analyzed to determine MID. Optimal change in the K-UCT to discriminate favorable and poor responders was determined by considering sensitivity and specificity obtained from AUC.
Correlations between salivary cortisol and cortisone levels and CU related scores, PSS, and CESD were analyzed by Pearson's correlation coefficient (r). A P value less than 0.05 was considered statistically significant. All statistical analyses were performed using SPSS version 23.0 (IBM Corp., Armonk, NY, USA). To explore the associations between K-UCT in relation to UAS7, CU-QoL, physician VAS control, and salivary cortisone, path analysis using Amos 21.0 software (Small Waters Corp., Chicago, IL, USA) was performed. Structural equation modeling was used to evaluate the fit of the final model by examining a number of statistics. To examine the magnitude of the discrepancy between the sample and fitted covariance matrices, the χ2 test was used when a nonsignificant test indicated that the model and data were consistent.1819 The comparative fit index examines the difference in overall fit among the models, and values > 0.95 indicate a good model fit. The root mean square error of approximation evaluates the approximate fit of the model, with values < 0.005 suggesting a reasonable goodness of fit.1819
RESULTS
Study subjects
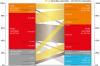
Of the 96 patients with CU who were eligible for this study, 80 completed the whole study process. The mean age was 37.9 ± 11.7 years, and 52 (65.0%) patients were female. Salivary cortisol and cortisone levels, as well as treatment steps, were comparable between visits 1 and 2. The K-UCT, UAS, CU-QoL, physician VAS control, patients VAS severity, and PSS scores were significantly improved at visit 2 compared t visit 1 (Table 1). The proportion of patients with well-controlled CU increased from 13.8% to 41.2%, and those with uncontrolled CU decreased from 30.0% to 8.8% after 4 weeks of treatment (P < 0.001, Fig. 1). The 80 patients who completed the study were classified into favorable (n = 44) and poor (n = 36) responders. In the favorable responder group, 9 patients maintained well-controlled CU; 16 patients moved from partly-controlled CU to well-controlled CU; and 8 and 11 patients with uncontrolled CU moved to well- and partly-controlled CU, respectively. The poor responder group comprised 2 patients who moved from well-controlled CU to partly-controlled CU, 27 patients who maintained partly-controlled status, 2 patients who moved from partly- to un-controlled CU, and 5 patients who maintained uncontrolled CU (Fig. 1).
Table 1
Clinical characteristics of the study subjects
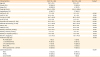
Values are presented as number (%) or mean ± standard deviation.
UAS-Ye, Urticaria Activity Score revised by Ye et al.; UAS7, Urticaria Activity Score Over 7 Days; CU-QoL, chronic urticaria-specific quality of life; K-UCT, Korean version of the Urticaria Control Test; VAS, visual analogue scale; PSS, Perceived Stress Scale; CESD, Center for Epidemiologic Studies-Depression; LTRA, leukotriene receptor antagonist.
*Paired t test
![]()
Validation of K-UCT
The 4 items of the K-UCT were found to have excellent internal consistency with a Cronbach α of 0.87.The correlation between physician VAS control and K-UCT was also excellent, with an intra-class correlation coefficient of 0.77.
After 4-week treatment, patients classified as exhibiting well-controlled CU showed significantly lower scores for the UAS, patients VAS severity, and PSS and higher scores for the CU-QoL, physician VAS control, and K-UC, compared to those with partly- or uncontrolled CU (Table 2). However, CESD and salivary cortisol and cortisone levels after treatment were not different between patients with well-controlled CU and partly- or un-controlled CU.
Table 2
Comparison of clinical characteristics according to the control status of CU assessed by physicians
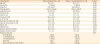
All values givens were measured at visit 1 and mean ± standard deviation.
CU, chronic urticaria; UAS-Ye, Urticaria Activity Score revised by Ye et al.; UAS7, Urticaria Activity Score Over 7 Days; CU-QoL, chronic urticaria-specific quality of life; K-UCT, Korean version of Urticaria Control Test; VAS, visual analogue scale; PSS, Perceived Stress Scale; CESD, Center for Epidemiologic Studies-Depression; LTRA, leukotriene receptor antagonist.
![]()
In terms of responsiveness to treatment, increases in the K-UCT were significantly higher in favorable responders than in poor responders (4.9 ± 3.4 vs. 1.6 ± 2.5, P < 0.001). Moreover, changes in UAS-Ye (−3.5 ± 3.0 vs. −1.0 ± 2.9, P < 0.001), CU-QoL (20.6 ± 15.4 vs. 12.8 ± 13.6, P = 0.021), and Physician VAS (32.3 ± 27.9 vs. 6.1 ± 24.6, P < 0.001) were also significantly different between favorable and poor responders. However, changes in UAS7 (−2.2 ± 5.8 vs. −0.1 ± 6.0, P = 0.126), patient VAS (−21.6 ± 30.6 vs. −16.6 ± 21.0, P = 0.409), PSS (−3.8 ± 6.7 vs. −1.6 ± 5.5, P = 0.120), and CESD (−0.7 ± 5.7 vs. −0.4 ± 3.7, P = 0.814) were not significantly different between the 2 response groups (Fig. 2).
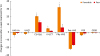 | Fig. 2Changes in CU related scores after 4-week treatment. Positive values mean increasing scores at visit 2. On the contrary, negative scores represent decreasing scores at visit 2.CU, chronic urticaria; UAS-Ye, Urticaria Activity Score revised by Ye et al.; UAS7, Urticaria Activity Score Over 7 Days; CU-QoL, chronic urticaria-specific quality of life; K-UCT, Korean version of Urticaria Control Test; VAS, visual analogue scale; PSS, Perceived Stress Scale; CESD, Center for Epidemiologic Studies-Depression.
*P < 0.05, †P < 0.001.
|
To determine convergent validity, a generalized estimating equations model adjusted for age, sex and treatment step was applied. The K-UCT was significantly dependent on all scores for patient-reported outcome measures, including UAS-Ye, UAS 7, CU-QoL, patient VAS, PSS and CESD, in addition to physician VAS (Table 3).
Table 3
Correlation analyses between the K-UCT and other outcome measures
A generalized estimating equations model adjusted for age, sex, and treatment step was applied. All values of visit 1 and visit 2 were included separately.
K-UCT, Korean version of the Urticaria Control Test; CI, confidence interval; UAS-Ye, Urticaria Activity Score revised by Ye et al.; UAS7, Urticaria Activity Score Over 7 Days; CU-QoL, chronic urticaria-specific quality of life; VAS, visual analogue scale; PSS, Perceived Stress Scale; CESD, Center for Epidemiologic Studies-Depression.
![]()
A ROC curve analysis showed that a K-UCT score of 12 was the optimal cutoff value with which to differentiate well-controlled CU from partly- or uncontrolled CU, with a sensitivity of 75.0%, a specificity of 75.8%, and an AUC of 0.824 (P < 0.001). When the minimal change in the K-UCT associated with favorable responders was assessed by ROC, a K-UCT score of 1 had the highest sensitivity of 90.9%, but a low specificity of 36.1%. Given that the mean increment in K-UCT scores in poor responders was 1.6, a K-UCT score of 2 was considered as the optimal cutoff value with which to detect favorable responders with a sensitivity of 81.8%, a specificity of 50.0% and an AUC of 0.772 (P < 0.001).
Salivary cortisol and cortisone
Salivary cortisol and cortisone levels were well correlated each other (r = 0.839, P < 0.001). PSS had a significant negative correlation with salivary cortisol (r = −0.267, P = 0.023) and cortisone (r = −0.261, P = 0.027). On the contrary, K-UCT showed a significant positive correlation with salivary cortisone (r = 0.308, P = 0.009). Salivary cortisone levels were also significantly higher among patients with controlled CU showing a K-UCT score of ≥ 12 than those with a K-UCT of <12 (3.55 ± 4.39 vs. 2.21 ± 2.16 nmol/L, P = 0.011).
Structural equation modeling
A structural equation model was developed to evaluate the relationships among K-UCT and UAS7, CU-QoL/Physician VAS for urticaria control/salivary cortisone levels (Fig. 3). To investigate the determinants of CU-QoL, the final outcome of CU, we considered that K-UCT and UAS7 by itself or through direct or indirect interactions with physician VAS for urticaria control could influence disease activity.
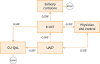 | Fig. 3Structural equation modeling to estimate relationships among K-UCT and UAS7/CU-QoL/salivary cortisone levels. The K-UCT was found to be a significant predictor of salivary cortisone levels (β = 0.278, P = 0.016) and CU-QoL (β = 0.501, P < 0.001). The UAS7 negatively impacted both K-UCT (β = −0.303, P = 0.008) and CU-QoL (β = −0.231, P = 0.021). The numbers on the arrows indicate the regression coefficient (β) of the structural equation model. Positive numbers mean a positive correlation between 2 factors, whereas negative numbers mean negative correlations. The direction of the arrows represents cause and effect.K-UCT, Korean version of Urticaria Control Test; CU, chronic urticaria; UAS7, Urticaria Activity Score Over 7 Days; CU-QoL, chronic urticaria-specific quality of life.
*P < 0.05, †P < 0.01, ‡P < 0.001.
|
The goodness of fit of the model was demonstrated using several fit statistics. A χ2 test of absolute fit was not significant (r = 5.263, P = 0.261), indicating that this model was a good fit for the data. This was further supported by a root mean square error of approximation value of 0.068 (90% confidence interval [CI], 0.000-0.204) and a comparative fit index value >0.95. The model had a relatively small Akaike information criterion value (27.263), suggesting that this simple model may provide a good explanation of the relationships among K-UCT and UAS7, CU-QoL/physician VAS/ and salivary cortisone levels. The regression coefficient β represents the index of path direction and the intensity of the relation between two factors. The K-UCT was found to be a significant predictor of CU-QoL (β = 0.501, P < 0.001) and salivary cortisone levels (β = 0.278, P = 0.016). A significant impact of UAS7 on CU-QoL (β = −0.231, P = 0.021) and K-UCT (β = −0.303, P = 0.008) was also identified in the model.
DISCUSSION
The Korean version of the UCT was successfully translated and validated in the present study. K-UCT scores were higher in well-controlled CU as determined by a physician than in partly- or uncontrolled CU, and increases in the K-UCT after 4 weeks of treatment were larger in favorable responders than in poor responders. Excellent internal consistency for the 4 items of the K-UCT and intra-class correlation between physician VAS control and K-UCT were identified. We also noted significant correlations of K-UCT with UAS-Ye, UAS 7, CU-QoL, physician and patient VAS, PSS and CESD. Additionally, we demonstrated that the optimal cutoff value of K-UCT scores with which to discriminate well-controlled CU was 12. The MID for detecting favorable responders was a K-UCT score of 2. Finally, salivary cortisone levels were found to be positively correlated with K-UCT.
Patient-reported outcomes (PROs) have been recommended for assessing disease severity and treatment responses and have been adopted as primary and secondary outcomes in clinical trials.20 Until now, only 2 PROs, CU-Q2oL and UAS, have been translated and validated internationally. However, these measures do not reflect symptom control, which is the goal of CU treatment.1 To address the lack of an assessment tool for evaluating urticaria control, the UCT was recently developed first in Germany and translated in American English.5 After that, a Thai version of the UCT was introduced and validated in Thai patients with CU.21 Also, while the UCT was also translated into Spanish, its clinical utility was not validated in Spanish patients with CU.22 As far as we know, the K-UCT is the fourth translated version of the original German UCT. Herein, we found the K-UCT to be a valid PRO. The K-UCT was higher in patients with well-controlled CU than those with partly- or uncontrolled CU, and larger increases in K-UCT after treatment were noted for favorable responder than for poor responders. In addition, K-UCT was strongly correlated with other CU-related scores, and CU-QoL was determined by K-UCT in a structural equation model.
In the present study, a K-UCT score of 12 was found to be accurate for discriminating well-controlled CU from partly- or uncontrolled CU, which is in agreement with the German and Thai versions of the UCT.521 This similarity in results suggests the applicability and consistency of the use of the UCT in other countries. In the case of asthma, an Asthma Control Test score of 20 has been used as a standard score in determining its control status. Therefore, given that a UCT score of 12 has been found to have the same clinical meaning in different linguistic and cultural settings, it is possible for that to be accepted as a practical standard when assessing and treating CU patients.
Prior to this study, the MID of the UCT has been evaluated in 2 countries, Germany and Thailand. Both studies reached the conclusion that a difference of 3 points in UCT scores is sufficient to differentiate clinical responders.2123 However, in our study, we found a difference of 2 points in the K-UCT was enough to differentiate responders. This might be attributable to the different anchors used in determining the presence of a response and different treatment methods among studies. In the 2 aforementioned studies, patients were asked to rank their control state on a 5-point scale (no control, little control, moderate control, good control and complete control) for themselves as an anchor to determine control state.2123 In this study, the presence of a response, either favorable or poor, was determined by a physician using 3 control states (well-controlled, partly-controlled and uncontrolled). In addition, while all of the patients were treated with omalizumab in the German study, patients treated with omalizumab were not enrolled in the present study.23 Omalizumab is a potent biological agent that can elicit dramatic increases in the control step. Therefore, different methods of analysis and treatment methods as well as a cultural difference, need to be taken into consideration when interpreting MID differences between studies.
Evidence indicates that CU is associated with chronic stress.24 Chronic stress has been defined as a specific ongoing environmental condition such as marital discord and caretaker burden, or as a stressor with enduring impact over at least 4 weeks.25 A recent study demonstrated that 26 of 45 (57.8%) CU patients exhibit hypocortisolism (defined by baseline serum morning cortisol levels < 3 μg/dL and poststimulation values <18 μg/dL). Therein, interleukin 18 and high sensitivity C-reactive protein, which are typically regulated by cortisol, were found to be positively correlated with UAS, whereas cortisol was negatively correlated with UAS.26 This result indicated that chronic stress caused by CU decreases cortisol level and increases inflammatory mediators. The hypothalamic-pituitary-adrenal axis is activated by acute stress, while it is attenuated in response to chronic stress.27 Cortisol is converted to cortisone by 11β-hydroxysteroid dehydrogenase, which is augmented in salivary glands.11 Salivary cortisol and cortisone concentrations show strong correlations with serum cortisol and cortisone. However, salivary cortisone is not affected by ingestion of hydrocortisone, such that it might be a superior surrogate marker of serum cortisol than salivary cortisol.28 In another study of adrenal insufficiency, measurement of salivary cortisol level was found to reduce corticotropin stimulation test by 34%, with a minimal salivary cortisol concentration of 1.0 nmol/L and a maximum concentration of 5.9 nmol/L.29 In the present study, salivary cortisol and cortisone were measured in patients with CU. We found them also to be negatively correlated with stress severity, and salivary cortisone was positively correlated with urticaria control status. Furthermore, the K-UCT was found to be a significant predictor of salivary cortisone levels through structural equation modeling. Therefore, since urticaria control status contributes directly to increasing stress levels, salivary cortisone may be a useful parameter with which to easily index chronic stress in patients with CU.
There are some limitations to the questionnaire itself. First, the K-UCT only reflects a subject's feelings. Secondly, there are still unnatural Korean expressions in the questionnaire, which can be difficult to answer in short time. Further studies should seek to address these limitations in order to better reflect the control status of CU and to make answering the questionnaire easier.
In conclusion, the present study demonstrated that the Korean version of the UCT is a useful tool for evaluating urticaria control status in Korean patients with CU. Our results also indicate that the original German UCT is a well-organized tool to be widely accepted in other countries with cultural and linguistic divergence. In addition, we found salivary cortisone levels to be correlated with the K-UCT, supporting the implication of chronic stress in the pathogenesis of CU.
 XML Download