Abbreviations
Arg-1
BMDM
FBS
GM-CSF
IFN
iNOS
IRF
KO
LPS
M-CSF
MHC
SEM
TGF
TNF
WT
INTRODUCTION
MATERIALS AND METHODS
Cells, antibodies, and reagents
Polarization of M1 and M2 macrophages
Flow cytometry
Cytometric bead array
Immunoblot analysis
RNA extraction, cDNA preparation, and quantitative real-time PCR
RESULTS
Viperin is basally expressed in murine bone marrow cells and BMDMs.
 | Figure 1Viperin expression in murine bone marrow cells and BMDMs. (A) The expression of viperin in bone marrow cells. The murine bone marrow cells were isolated from WT C57BL/6 mice. The cells were stained with fluorescently-conjugated antibodies specific to CD11b, Ly6C, and viperin and analyzed by flow cytometry. Cell fractions were gated in a flow cytogram. Specific cell types were confirmed by expression levels of CD11b and Ly6C (Granulocytes, CD11bhighLy6Cmiddle; Monocytes, CD11bmiddleLy6Chigh). Viperin expression of each cell population was shown in flow histograms. Shaded histograms represent staining with anti-viperin antibody; open histograms represent staining with an isotype-matched control antibody of irrelevant specificity. Data are representative of two independent experiments. (B, C) The expression of viperin in BMDMs. The bone marrow cells were differentiated into BMDMs by incubation in M-CSF or GM-CSF conditioned media for 7 days. The cells were stained with fluorescently-conjugated antibodies specific to CD11b and F4/80. Cell fractions were analyzed by flow cytometry. BMDMs specificity was confirmed by expression of F4/80 and CD11b (F4/80+CD11b+). BMDMs were washed and plated in 6-well plates containing media without M-CSF or GM-CSF. The cells were treated with or without type I IFN (1,000 U/ml) for 8 h or IFN-γ (20 ng/ml) and LPS (100 ng/ml) for 24 h. Viperin expression in BMDMs was detected by immunoblot using monoclonal antibody specific to viperin (MaP.VIP). β-actin served as a protein-loading control.BM, bone marrow cells; BM+M-CSF, BMDMs differentiated with M-CSF; BM+GM-CSF, BMDMs differentiated with GM-CSF under the indicated conditions.
|
Viperin has little effect on the phenotypes of BMDMs.
 | Figure 2Viperin effects on the BMDMs differentiated with M-CSF or GM-CSF. The bone marrow cells were isolated from WT and viperin KO C57BL/6 mice and differentiated into BMDMs in conditioned media. (A, B) The effects of viperin on expression of macrophage markers and cytokines. The mRNA expression levels of M1 macrophage markers and cytokines (left) and M2 macrophage markers and cytokines (right) in BMDMs differentiated with GM-CSF (A) or M-CSF (B) were measured by quantitative RT-PCR and normalized to β-actin mRNA. Data are presented as mean±SEM of triplicate samples and are representative of two individual experiments.
*p<0.05.
|
Viperin deficiency promotes gene expression of macrophage markers and cytokines in the polarized M1 and M2 macrophages.
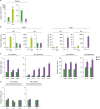
 | Figure 3Viperin effects on the polarized M1 and M2 macrophages. The bone marrow cells isolated from WT and viperin KO C57BL/6 mice were differentiated into BMDMs in M-CSF conditioned media for 7 days. The BMDMs were washed and plated in media without M-CSF. The cells were polarized to M1 macrophages by treatment with LPS (100 ng/ml) and IFN-γ (20 ng/ml) for 24 h and to M2 macrophages by treatment with IL-4 (20 ng/ml) for 48 h. (A) Viperin expression in M1 and M2 macrophages. The mRNA levels of viperin in M1 macrophages (left) and M2 macrophages (right) were measured by quantitative RT-PCR and normalized to β-actin mRNA. The mRNA level of viperin in BMDMs was used for a control. (B) Polarization of BMDMs into M1 and M2 macrophages. The polarization of WT and viperin KO macrophages was confirmed by the increased expression levels of M1 and M2 specific markers. iNOS, an M1 marker; Arg-1, an M2 marker. The mRNA levels in BMDMs were used for controls. (C) Viperin effects on the polarized macrophages. The mRNA expression levels of M1 markers and cytokines (left) and M2 markers and cytokines (right) in WT and viperin KO M1 and M2 macrophages were measured. The mRNA levels in WT M1 and M2 macrophages were used for controls. iNOS, Cd80, and Cd86, M1 markers; Tnf-a, Il-1b, Il-6, Il-12, and Il-23, M1 cytokines; Cd163, Cd206, and Arg-1, M2 markers; Il-10 and Tgf-b, M2 cytokines. (D) IRF effects on the polarized macrophages. The mRNA expression levels of IRFs in WT and viperin KO M1 and M2 macrophages were measured. The mRNA levels in WT M1 and M2 macrophages were used for controls. Irf-1, Irf-5, and Irf-8, M1-related transcriptional factors; Irf-3 and Irf-4, M2-related transcriptional factors. Data are presented as mean±SEM of triplicate samples and are representative of two individual experiments.
*p<0.05; **p<0.01.
|
Viperin deficiency enhances macrophage marker protein expression and cytokine secretion in the polarized M1 and M2 macrophages.
 | Figure 4Viperin deficiency enhances expression of macrophage marker proteins and secretion of cytokines in the polarized macrophages. (A) The effect of viperin on expression of M1 and M2 marker proteins on cell surface. WT and viperin KO BMDMs were polarized into M1 and M2 macrophages as described above. The cells were stained with fluorescently-conjugated antibodies specific to MHC II, CD86, and CD206 and analyzed by flow cytometry. Left cytograms represent staining with an isotype-matched control antibody of irrelevant specificity. Right fraction on each cytogram indicates cell populations expressing M1 and M2 specific markers. MHC II and CD86, M1 markers; CD206, an M2 marker. (B) The effect of viperin on secretion of M1 and M2 cytokines. Cytometric bead array was performed. Open bars indicate cytokines secreted from WT M1 and M2 macrophages and closed bars represent cytokines secreted from viperin KO M1 and M2 macrophages. TNF-α and IL-6, M1 cytokines; IL-10, an M2 cytokine. Data are presented as concentration of cytokines secreted from M1 and M2 macrophages and are representative of 2 individual experiments.FSC-H, forward scatter height.
|


 PDF
PDF Citation
 Print
Print


 XML Download