

 PDF
PDF Citation
 Print
Print


INTRODUCTION
Inflammatory bowel disease (IBD), which encompasses Crohn's disease and ulcerative colitis, is an immunologically mediated disorder of the gastrointestinal tract that is caused by dysregulation of the mucosal immune system (12). The mucosal immune system is composed of various immune cells required for physiological immune tolerance (34). Aberrant infiltration of T lymphocytes is one of the main immune responses in intestinal inflammation (5). T helper (Th) 1, Th2, and Th17 cells play an important role in activating other immune cells by releasing T cell cytokines, whereas regulatory T cells are essential for restricting the expansion and overactivity of Th cells (67).
Cytokines are key mediators of innate and adaptive immune responses in intestinal inflammation (8910). In rodents, experimental colitis is induced by overexpression of proinflammatory cytokines or elimination of regulatory mediators from various immune cells, such as T lymphocytes (11). Interferon (IFN)-γ is abundantly produced in the colon of dextran sulfate sodium (DSS)-induced colitis mouse models, whereas IFN-γ knockout (KO) mice show attenuated colitis (12). Similarly, blocking of the IL-6 receptor with monoclonal antibodies prevents the development of colitis (13). Deficiency of IL-10, an anti-inflammatory cytokine, increases the susceptibility of mice to the induction of colitis (14).
Signal transducer and activator of transcription 3 (STAT3) is a transcription factor with roles in growth, survival, and homeostasis in various cell types (1516). In particular, STAT3 helps maintain the pool of T lymphocytes in the resting state by regulating survival pathways (1718). Moreover, substantial evidence supports a critical role of STAT3 in inflammatory responses via regulation of numerous pro- and anti-inflammatory cytokines such as IL-6, IL-10, and IL-17 (171920). In experimental ulcerative colitis, the expression of IL-6-mediated S100A9 through STAT3 activation is increased in colonic epithelial cells (21). These findings suggest the importance of STAT3 in T cells for intestinal inflammation.
Therefore, we studied the STAT3 function of T cells in colitis. In a transgenic mouse model, STAT3fl/fl;Lck-Cre+/−, STAT3 was selectively eliminated in T lymphocytes. Then, we examined the effects of T cell-specific STAT3 on intestinal inflammation in a DSS-induced colitis mouse model.
MATERIALS AND METHODS
Experimental animals and genotyping
Mice carrying a Cre transgene under the control of the Lck promoter (Lck-Cre+/+) were purchased from the Jackson Laboratory (Bar Harbor, ME, USA). STAT3-floxed (STAT3fl/fl) mice were a kind gift from Dr. S. Akira (Osaka University, Suita, Japan). Mice with a STAT3 deletion in T lymphocytes were generated by crossing mice with the floxed STAT3 allele with mice expressing Cre under the control of the Lck promoter. Genotyping was performed as previously described (18). The primers were specific for exons 22 and 23 of STAT3. All experiments were performed with male mice aged 8–10 weeks. The experimental animals were maintained under specific pathogen-free conditions at 22°C±1°C on a reversed 12-h light–dark cycle (lights on at 07:00). All experimental procedures were reviewed and approved by the Institutional Animal Care and Use Committee at the College of Medicine, Seoul National University.
Protocol for DSS-induced colitis
Experimental colitis was induced by administration of 3% (w/v) DSS in drinking water for 7 days, followed by a regimen of 5 days of normal water, whereas the control group received only normal water throughout the experiment. A scoring system was used to assess the disease activity index (DAI), stool consistency (scale of 0–3), weight loss (scale of 0–3), and gross bleeding (scale of 0–3). The total score ranged from 0 (normal) to 9 (severe colitis). Animals were sacrificed on day 7, and tissues were immediately used in experiments. The survival rate was measured for 12 days.
Histological assessment of colitis
Colon tissues of mice were fixed for one day in 4% paraformaldehyde at 4°C and then embedded in paraffin. The paraffin blocks were cut using a microtome (5 μm; Finesse E+; Thermo Shandon, Runcom, UK). Paraffin slices were mounted on silane-coated microslides (Muto Pure Chemicals, Tokyo, Japan) and then allowed to air-dry at room temperature in the dark for 24 h. Before immunostaining, the slides were deparaffinized in xylene, dehydrated by graded alcohol solutions, and heated in citrate buffer for 10 min. Nonspecific binding was blocked with 5% normal goat serum (Vector Laboratories, Burlingame, CA, USA) in PBS, and the slides were stained with hematoxylin and eosin. Images were obtained using the Leopard program included with the microscope (BX53; Olympus, Tokyo, Japan). A scoring system was used to assess DSS-induced colitis as follows: severity of inflammation (scale of 0–3), crypt damage (scale of 0–4), and extension (scale of 0–4). The total score ranged from 0 (normal) to 11 (severe colitis).
Myeloperoxidase (MPO) activity assay
Colon tissues were weighed and homogenized in KPO4 buffer containing 0.5% hexadecyltrimethylammonium bromide. Lysates were centrifuged, and the supernatants were collected as samples. MPO activity was determined according to the manufacturer's instructions (Abcam, Cambridge, UK). Changes in absorbance at 460 nm were measured. MPO activity was expressed as U g−1 of tissue.
Western blotting
Thymus tissues were homogenized and lysed in Triton lysis buffer containing 1% Triton X-100, 50 mM Tris-HCl (pH 7.4), 0.35 M NaCl, 0.5% Nonidet P-40, 10% glycerol, 0.1% SDS, 1 mM EDTA, 1 mM EGTA, 0.2 mM Na3VO4, 1 mM phenylmethylsulfonyl fluoride and 0.5 mM sodium fluoride. After incubation for 30 min on ice, insoluble debris was removed by centrifugation at 16,000×g for 10 min at 4°C. The lysates were resolved by SDS-polyacrylamide gel electrophoresis, and proteins were transferred to nitrocellulose membranes (GE Healthcare, Pittsburgh, PA, USA). The nitrocellulose membranes were probed with primary antibodies against phospho-STAT3, STAT3 (1:1,000; Cell Signaling Technology, Danvers, MA, USA), and α-tubulin (1:1,000; Santa Cruz Biotechnology, Santa Cruz, CA, USA), followed by incubation with horseradish peroxidase-conjugated goat anti-mouse IgG and goat anti-rabbit IgG secondary antibodies (1:10,000; Enzo Life Science, Farmingdale, NY, USA). Immunoreactive bands were visualized using an ECL detection kit (SurModics, Eden Prairie, MN, USA).
Quantitative real-time PCR (RT-PCR)
Total RNA was isolated from intestinal colon tissues using RNAiso Plus reagent (Takara, Shiga, Japan), and cDNA was synthesized using ReverTra Ace qPCR RT Master Mix (Toyobo, Osaka, Japan). Quantitative RT-PCR was performed using EvaGreen qPCR Mastermix (Applied Biological Materials, Richmond, Canada), and the results were normalized to GAPDH expression. Primers for IFN-γ (QT01038821), IL-6 (QT00098875), IL-10 (QT00106169), IL-17A (QT00103278), Foxp3 (QT00138369), and GAPDH (QT01658692) were purchased from Qiagen (Germantown, MD, USA).
Flow cytometric analysis
Single-cell suspensions of splenocytes or mesenteric lymph node cells were stained with Alexa 488-labeled anti-mouse CD3, phycoerythrin-conjugated rat anti-mouse CD4, and allophycocyanin-labeled anti-mouse CD8 (BioLegend, San Diego, CA, USA). Flow cytometry analysis was performed using a FACS Canto flow cytometer (Becton Dickinson, Franklin Lakes, NJ, USA). The data were analyzed using FlowJo software (FlowJo, LLC, Ashland, OR, USA).
Serum cytokine immunoassay
Cytokine measurement in serum samples was performed using a mouse inflammation panel (LEGENDplex™ Mouse Inflammation Panel; BioLegend) according to the manufacturer's instructions. The Mouse Inflammation Panel, containing 13 bead populations distinguished by size and internal fluorescent dye, allows simultaneous detection of 13 cytokines (IL-23, IL-1α, IFN-γ, TNF-α, MCP-1, IL-12p70, IL-1β, IL-10, IL-6, IL-27, IL-17A, IFN-β, and granulocyte-macrophage colony-stimulating factor) in a single sample. The data were analyzed using BioLegend's LEGENDplex™ data analysis software.
Statistical analysis
Two-tailed, unpaired Student's t-test was used to compare differences in wild-type (WT) and KO mice in the control or DSS-induced colitis groups. Two-way ANOVA was applied to evaluate body weight changes and the DAI. Bonferroni's post hoc test was performed when applicable. All data are presented as the means±standard error of the mean (SEM). All statistical analyses were performed using GraphPad Prism (GraphPad Software, Inc., La Jolla, CA, USA) and SigmaPlot software (ver. 12; Systat Software, San Jose, CA, USA).
RESULTS
Clinical activity was decreased in the DSS-induced colitis STAT3 KO mouse model
The STAT3 gene was disrupted in murine T cells by deletion of a fragment of genomic DNA containing STAT3 exons 22–23 (Supplementary Fig. 1A). To verify STAT3 depletion in T cells, STAT3 gene KO was first confirmed by genotyping. We denoted STAT3wt/fl;Lck-Cre+/− as WT and STAT3fl/fl;Lck-Cre+/− as KO mice (Supplementary Fig. 1B). To assess the pathological function of STAT3 in T cells in intestinal inflammation, the development of DSS-induced colitis was examined in T cell-specific STAT3 KO mice (Fig. 1A). In the DSS-treated group, loss of body weight was observed in both WT and STAT3fl/fl;Lck-Cre+/− mice, but STAT3fl/fl;Lck-Cre+/− mice exhibited less severe weight loss than did WT mice (Fig. 1B). Moreover, STAT3fl/fl;Lck-Cre+/− mice had significantly reduced DAI scores as assessed by stool consistency, weight loss, and gross bleeding (Fig. 1C and Supplementary Fig. 1C). Survival was dramatically prolonged in STAT3fl/fl;Lck-Cre+/− mice compared to that in WT mice (Fig. 1D).
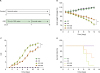 | Figure 1Clinical activity was attenuated in a DSS-induced colitis STAT3 KO mouse model. (A) Experimental design for DSS-induced colitis. (B) Graph showing body weight changes in control and DSS-treated WT and KO mice (n=7 mice, group×time interaction: p=0.2394, group effect: p<0.001, time effect: p<0.001; 2-way ANOVA with Bonferroni correction). (C) Graph showing the DAI of control and DSS-treated WT and KO mice (n=7 mice, group×time interaction: p<0.001, group effect: p<0.001, time effect: p<0.001; 2-way ANOVA with Bonferroni correction). (D) Graph showing the survival rates of control and DSS-treated WT and KO mice (n=7 mice). Data are presented as the means±SEM.
***p<0.001.
|
T cell-specific deletion of STAT3 reduced the histological score and MPO activity in mice
To investigate the histological alterations caused by DSS-induced colitis in STAT3fl/fl;Lck-Cre+/− mice, we collected colon tissues and performed a histological analysis. Although DSS treatment reduced the colon length in both WT and STAT3fl/fl;Lck-Cre+/− mice, STAT3fl/fl;Lck-Cre+/− mice showed less reduction in the colon length than did WT mice (Fig. 2A and B). According to the histological features, DSS-treated STAT3fl/fl;Lck-Cre+/− mice had remarkably low overall histological scores (Fig. 2C and D). In addition, we investigated the activity of MPO as a parameter of IBD. Compared to WT mice, STAT3fl/fl;Lck-Cre+/− mice showed reduced MPO activity in the intestinal epithelium after treatment with 3% DSS (Fig. 2E). Collectively, our results suggest that the deletion of STAT3 in T cells alleviated DSS-induced colitis.
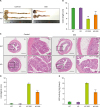 | Figure 2Deletion of STAT3 in T cells reduced histological scores and MPO activity in mice. (A) Representative images of colon tissues from control and DSS-treated WT and KO mice. (B) Bar graph for the colon lengths in control and DSS-treated WT and KO mice (n=7 mice). (C) Representative images of colon slices from control and DSS-treated WT and KO mice (scale bars: 4× image=500 μm; 20× image=100 μm). (D) Bar graph for the histological scores of control and DSS-treated WT and KO mice (n=7 mice). (E) Bar graph for the MPO activity in control and DSS-treated WT and KO mice (n=7 mice). Data are presented as the means±SEM.
*p<0.05, ***p<0.001 compared with the DSS-treated group; ###p<0.001.
|
Changes in the T lymphocyte population in T cell-specific STAT3 KO mice
The protein expression of STAT3 was consistently depleted in thymocytes of STAT3fl/fl;Lck-Cre+/− mice, although STAT3 activation was increased after DSS treatment in thymocytes of WT mice (Fig. 3A and B). Depletion of STAT3 in T cells led to reductions in the volume, weight and cell number of the spleen and mesenteric lymph nodes under normal conditions (18). Interestingly, we found consistent reductions in the spleen size and weight in STAT3fl/fl;Lck-Cre+/− mice compared to those in WT mice under DSS treatment conditions (Fig. 3C-E). To determine how STAT3 in T cells triggers intestinal inflammation, we investigated the T cell population in spleens from DSS-treated WT and STAT3fl/fl;Lck-Cre+/− mice. The number of CD3-positive T cells was reduced in splenocytes from STAT3fl/fl;Lck-Cre+/− mice in both the control and DSS-treated groups (Fig. 3F and G). Furthermore, we analyzed the subpopulations of splenocytes in WT and STAT3fl/fl;Lck-Cre+/− mice. The proportion and number of CD4- and CD8-positive T cells in the spleen were considerably decreased in STAT3fl/fl;Lck-Cre+/− mice in the control and DSS-treated groups (Fig. 3H and I). The same tendency was observed in mesenteric lymph nodes of STAT3fl/fl;Lck-Cre+/− mice. STAT3fl/fl;Lck-Cre+/− mice showed a decrease in mesenteric lymph node size and number of CD3, CD4 and CD8 T cells in DSS treatment conditions (Fig. 4). Therefore, the data suggest that T cell maintenance by STAT3 affects intestinal inflammation.
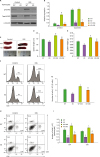 | Figure 3Changes in the T lymphocyte population in spleen of T cell-specific STAT3 KO mice. (A) Western blot analysis of pY-STAT3, total-STAT3, and α-tubulin in thymocytes from control and DSS-treated WT and KO mice. (B) Graph for the quantification of Western blot data (n=3 mice). (C) Representative images of spleen tissues from control and DSS-treated WT and KO mice. (D) Bar graph for the spleen lengths in control and DSS-treated WT and KO mice (n=7 mice). (E) Bar graph for the spleen weights in control and DSS-treated WT and KO mice (n=7 mice). (F) Representative flow cytometry analysis traces of splenocytes showing the distribution of CD3-positive T cells. (G) Bar graph for the numbers of T cells in control and DSS-treated WT and KO mice (n=5 mice). (H) Representative FACS plot of splenocytes showing the distribution of CD4- and CD8-positive T cells. (I) Bar graph for the numbers of CD4- and CD8-positive T cells in control and DSS-treated WT and KO mice (n=5 mice). Quantification of Western blot data was completed with relative densitometry and normalization to the level of α-tubulin. Data are presented as the means±SEM. Representative data from 3 independent experiments are shown.
**p<0.01, ***p<0.001 compared with the DSS-treated group; #p<0.05, ##p<0.01, ###p<0.001.
|
 | Figure 4Changes in the T lymphocyte population in mesenteric lymph nodes of T cell-specific STAT3 KO mice. (A) Representative images of mesenteric lymph nodes from control and DSS-treated WT and KO mice. Scale bar=5 mm. (B) Representative flow cytometry analysis traces of lymph node cells showing the distribution of CD3-positive T cells. (C) Bar graph for the numbers of T cells from lymph node cells in control and DSS-treated WT and KO mice (n=5 mice). (D) Representative FACS plot of lymph node cells showing the distribution of CD4- and CD8-positive T cells. (E) Bar graph for the numbers of CD4- and CD8-positive T cells from lymph node cells in control and DSS-treated WT and KO mice (n=5 mice). Data are presented as the means±SEM.
*p<0.05, **p<0.01, ***p<0.001 compared with the DSS-treated group; #p<0.05, ##p<0.01, ###p<0.001.
|
T cell-specific STAT3 deficiency modulates the production of inflammatory cytokines
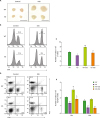
To assess the inflammatory response in the DSS-treated group, we quantified the expression of pro- and anti-inflammatory cytokines in the serum using a multiplex bead-based immunoassay (Fig. 5A). Production of IFN-γ, IL-6, and IL-17A was decreased, but IL-10 was increased in the serum of DSS-treated STAT3fl/fl;Lck-Cre+/− mice (Fig. 5B). We further investigated the mRNA levels of these cytokines in colon tissues. Consistent with the changes in cytokine expression in the serum, DSS-treated STAT3fl/fl;Lck-Cre+/− mice exhibited a substantial decrease in IFN-γ, IL-6, and IL-17A production, as well as an increase in IL-10 (Fig. 5C). Previous studies demonstrated that the IL-6 signaling inhibits the conversion of conventional T cells into Foxp3 regulatory T cells and induces Th17 cell differentiation from Foxp3 regulatory T cells (2223). Thus, we suggested that IL-6 signaling in the absence of STAT3 in T cells could affect the Foxp3 regulatory T cell population under conditions of intestinal inflammation and Foxp3 mRNA level in colon tissues was analyzed. Although Foxp3 mRNA level was reduced in STAT3fl/fl;Lck-Cre+/− mice under normal conditions, it was highly elevated in the DSS-treated group compared to WT mice (Fig. 5D). The results imply that low levels of IFN-γ, IL-6, and IL-17A by the reduced T cell populations and increased IL-10 with Foxp3 regulatory T cells played a particularly prominent role in alleviating intestinal inflammation in STAT3fl/fl;Lck-Cre+/− mice. Taken together, our results suggest that STAT3 in T cells contributes to cellular homeostasis and is an important target to mitigate pathological condition of colitis.
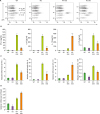 | Figure 5T cell-specific STAT3 deficiency affects the production of inflammatory cytokines. (A) Representative FACS plot of a multiplex bead-based immunoassay showing the distribution of cytokine production. (B) Bar graphs for the amounts of IFN-γ, IL-6, IL-10, and IL-17A in the serum from control and DSS-treated WT and KO mice (n=5). (C, D) Bar graphs for the mRNA levels of IFN-γ, IL-6, IL-10, IL-17A, and Foxp3 in colon tissues from control and DSS-treated WT and KO mice (n=5). Relative mRNA levels were normalized to those of GAPDH. Data are presented as the means±SEM. Representative data from 3 independent experiments are shown.
*p<0.05, **p<0.01, ***p<0.001.
|
DISCUSSION
IBD, such as Crohn's disease and ulcerative colitis, is a complex disease caused by environmental factors, microbes infection and genetic susceptibility leading mucosal immune responses and intestinal inflammation (24). For many decades, accumulating evidence has reported the interplay between adaptive and innate immune system in pathological studies of IBD (25). It should be noted that, although innate immune system provides the first line of immunological defense in response to DSS, adaptive immune system is consistently induced by the accumulation of T and B cells in the colon during the late acute and chronic phases of DSS-induced colitis (26). Furthermore, adaptive immune cells such as regulatory T cell have been reported to cure intestinal inflammation mediated by chronic activation of the innate immune system (27).
STAT3 plays a crucial role in the pathogenesis of IBD; however, STAT3 is difficult to target due to our poor understanding of the function of T lymphocytes. Even though STAT3 has been reported to be essential for CD4 T cell proliferation, survival and Th17 cell differentiation using a T cell transfer model of colitis, but more comprehensive functional studies are required when considering the importance of other regulatory cell types such as CD8 and γδ T cells (172829). In the present study, we characterized the STAT3 function of T cells using T cell-specific STAT3 KO mice under control or DSS-induced colitis conditions. By using a STAT3-deficient model targeting a variety of T cell subsets, we identified a fundamental role of STAT3 in T cells under intestinal inflammation. We have previously reported that depletion of STAT3 in T cells has been shown to reduce the population of CD4 and CD8 T cells, including Foxp3 regulatory T cells, under normal conditions (18). Consistently, the T cell population was reduced in T cell-specific STAT3 KO mice under DSS treatment conditions (Fig. 3F-I and Fig. 4B-E), and the increase in intestinal Foxp3 mRNA level indicate that the STAT3 deficiency was attributable to the maintenance of regulatory T cells under conditions of intestinal inflammation (Fig. 5D).
Our findings for the cytokine expression profiles show that changes in the T cell population are strongly associated with cytokine production. Under DSS treatment conditions, IFN-γ, IL-6, and IL-17A levels were significantly reduced in the serum and colon tissue compared to those in WT mice due to a decrease in the inflammatory response of T cells (Fig. 5A-C). The increased IL-10 level can be attributed to the regulatory CD8 T cell population. STAT3-deficient CD8 T cell KO mice show an expansion of IL-10-producing regulatory CD8 T cells similar to that observed in autoimmune diseases (30). On the other hand, the important role of IL-10 in the prevention of colitis is related to the reduction of myeloid population such as monocytes and dendritic cells, i.e., it may not be directly associated with T cells (3132).
Regarding cellular homeostasis, STAT3 plays a pivotal role in modulating Th17 cell differentiation in CD4 T cells (33). In a STAT3-deficient CD4 T cell transfer model, chronic intestinal inflammation was alleviated by modulating IL-17 secretion from Th17 cells (17). Based on our cytokine profiles, IL-17 production tended to decrease in STAT3fl/fl;Lck-Cre+/− mice, but this change was not a major factor in the mitigation of colitis compared to changes in other cytokines (Fig. 5B). Notably, therefore, we suggest that STAT3 deficiency in various T cell subsets leads to much more complex immune responses.
In conclusion, this study provides evidence that ablation of STAT3 in T cells results in the disruption of cellular homeostasis, which regulates both pro- and anti-inflammatory cytokine production. During pathological conditions, reduction of IFN-γ, IL-6, IL-17, and increase of IL-10 by T cells contribute to the alleviation of colitis. Thus, our study demonstrates an integrative role of STAT3 in T lymphocytes in intestinal inflammation and IBD.
 XML Download