

 PDF
PDF Citation
 Print
Print


Abbreviations
BMMCs
murine bone marrow-derived mast cells
DNP
2,4-dinitrophenyl
FcεRI
high-affinity IgE receptor
HSA
human serum albumin
mTOR
mechanistic target of rapamycin
mTORC1
mTOR complex 1
mTORC2
mTOR complex 2
S6K
ribosomal protein S6 kinase
TNF-α
tumor necrosis factor α
4E-BP1
eukaryotic translation initiation factor 4E-binding protein 1
INTRODUCTION
Mast cells arise from hematopoietic stem cells in the bone marrow, circulate through the blood and lymphatic fluid, and then complete their development peripherally (12). These cells serve in host defense against parasites and bacteria, and contribute to allergic disorders such as asthma, anaphylaxis, and rhinitis. The high-affinity IgE receptor (FcεRI), expressed on the cell surface, binds to IgE, and the subsequent aggregation of neighboring FcεRI via bivalent or multivalent Ags allows mast cells to release granular components, such as histamine, β-hexosaminidase, and leukotrienes within minutes (34). In a late phase reaction, the cells newly synthesize numerous cytokines, chemokines, and growth factors, and then secrete them several hours after stimulation. Signals from the Ag-IgE-FcεRI axis are transmitted to protein tyrosine kinases of the Src, Syk, and Tec families, which in turn activate downstream effectors and adaptor molecules (5). Among the various signaling cascades induced by FcεRI engagement, phosphoinositide-3-kinase (PI3K) is critical for the proper function of mast cells (67).
The mechanistic target of rapamycin (mTOR) is a downstream kinase of PI3K and forms 2 signaling complexes, mTOR complex 1 (mTORC1) and mTOR complex 2 (mTORC2). Rapamycin-sensitive mTORC1 phosphorylates ribosomal protein S6 kinase (S6K) and eukaryotic translation initiation factor 4E (eIF4E) binding proteins (4E-BPs), whereas rapamycin-insensitive mTORC2 uses the AKT kinase as a substrate. A growing body of evidence has demonstrated that mTOR plays fundamental roles in immune cells, including mast cells (89). The mTORC1 pathway is critical for activation and function of mast cells (10). Surprisingly, constitutively active mTORC1, induced by genetic deletion of tuberous sclerosis 1 (Tsc1), caused decreased degranulation but enhanced cytokine production following FcεRI stimulation, as well as increased apoptosis of mast cells (11). Therefore, the proper level of mTOR activity might be important for mast cell function and survival. A recent study by Choi et al. (12) showed that MHY1485 directly binds and activates mTOR. In the present study, we aimed to investigate how the selective activation of mTOR by MHY1485 affects mast cell function, proliferation and apoptosis.
MATERIALS AND METHODS
Murine bone marrow-derived mast cell (BMMC) culture
Bone marrow cells were flushed from femurs and tibias of 8 to 10-week-old C57BL/6 mice and cultured in IMDM-IL3, as previously described (13). All the experiments were performed using BMMCs after at least 4 weeks in culture. Animals were handled according to the protocols approved by the Institutional Animal Care and Use Committee of Inha University (INHA 161214-465).
β-hexosaminidase release assay
To measure degranulation activity, BMMCs (1×10⁶ cells/ml) were sensitized with 1 μg/ml anti-2,4-dinitrophenyl (DNP) IgE (SPE-7, Sigma-Aldrich, St. Louis, MO, USA) for 5 h in 37°C and 5% CO2 incubator. Thereafter, the cells were washed 3 times with Tyrode's buffer (130 mM NaCl, 10 mM HEPES [pH 7.4], 1 mM MgCl2, 5 mM KCl, 1.4 mM CaCl2, 5.6 mM glucose and 1 mg/ml bovine serum albumin), mixed with the indicated concentrations of MHY1485 (Sigma-Aldrich) or DMSO in V-bottom 96-well plates for 1 h, and incubated with DNP-human serum albumin (DNP-HSA) Ag for 30 min. The β-hexosaminidase activity of each sample was determined relative to the total activity of the cell lysate using p-nitrophenyl-N-acetyl-β-D-glucosamide as the substrate.
Immunoblotting analysis
IgE-sensitized BMMCs (1×10⁷ cells/ml) were incubated with 30 ng/ml of DNP-HSA in the presence or absence of MHY1485. Samples were harvested and lysed with radioimmunoprecipitation assay buffer containing protease and phosphatase inhibitor cocktails (Sigma-Aldrich) at 0, 1, 5, 15, and 30 min after Ag stimulation. Equal amounts of proteins were subjected to SDS-polyacrylamide gel electrophoresis (PAGE), transferred onto Trans-Blot Nitrocellulose membranes (Bio-Rad, Hercules, CA, USA), and incubated with 1:1,000 diluted antibodies against phospho-p70S6K (Thr389), phospho-eukaryotic translation initiation factor 4E-binding protein 1 (4E-BP1) (Thr37/46), phospho-Akt (Ser473), p70S6K, 4E-BP1, and Akt (all from Cell Signaling Technology, Beverly, MA, USA). Immunoblots were quantified by densitometric analysis using Adobe Photoshop CS6 (Adobe Systems Software, San Jose, CA, USA).
Cytokine production
Measurement of newly synthesized or secreted IL-6 and tumor necrosis factor α (TNF-α) was performed as described previously (11). IgE-sensitized BMMCs were treated with the indicated concentrations of MHY1485 and stimulated by 30 ng/ml of Ag. Total RNA was extracted using a NucleoSpin RNA plus kit (Macherey-Nagel, Düren, Germany) 1 h after stimulation, and cDNA was generated using iScript cDNA synthesis kit (Bio-Rad). Quantitative real-time PCR (qRT-PCR) reactions were performed in a Bio-Rad CFX96 Real-Time System using SsoFast EvaGreen Supermix (Bio-Rad). The mRNA levels of IL-6 (Il6) and TNF-α (Tnfa) relative to β-actin (Actb) as a reference gene were calculated using 2−ΔΔCT method (11). To measure secreted cytokines, supernatants were harvested after 6 h and tested for their levels of cytokines using ELISAs with Mouse IL-6 and TNF-α ELISA MAX Deluxe kits (BioLegend, San Diego, CA, USA) according to the manufacturer's instructions.
BMMC apoptosis and proliferation
Cell number monitoring was assessed using a Cell Counting Kit-8 incorporating WST-8 (2-(2-methoxy-4-nitrophenyl)-3-(4-nitrophenyl)-5-(2,4-disulfophenyl)-2H-tetrazolium, monosodium salt) (Dojindo Molecular Technologies, Rockville, MD, USA). BMMCs (1×10⁵ cells/ml) were cultured in IMDM-IL3 or IL-3 free IMDM, with or without MHY1485, as indicated. On day 6, 100 µl of the cells was mixed with 10 µl of WST-8 and further cultured for 2 h at 37°C, and the absorbance was read at 450 nm using an Epoch microplate reader (BioTek Instruments, Winooski, VT, USA). IL-3 withdrawal-induced cell death was analyzed with or without different dosages of MHY1485. Six days later, BMMCs were stained with annexin V-PE (phycoerythrin) (BD Bioscience, San Jose, CA, USA) and the percentages of annexin V-positive cells indicating apoptosis were analyzed using a FACS Calibur system (fluorescence-activated cell sorting; Becton Dickinson & Co., Oxnard, CA, USA). To trace cell proliferation, cells were labeled with 5 µM CFSE (Invitrogen, Carlsbad, CA, USA), a dye that is equally distributed between daughter cells following each cell division. On day 6 of culture, CFSE dilution was visualized using flow cytometry. All the data obtained from flow cytometry were analyzed using FlowJo V10 software (Tree star, San Carlos, CA, USA).
Statistical analysis
All the data were expressed in bar graphs as the mean±standard error of the mean. To evaluate statistically significant differences between drug-treated groups with the control, unpaired 2-tailed Student's t-test was performed using GraphPad Prism 5 software (GraphPad Software Inc., San Diego, CA, USA).
RESULTS AND DISCUSSION
MHY1485 increases mTORC1 signaling and suppresses mast cell function following FcεRI stimulation
First, we investigated whether FcεRI-mediated mTOR signaling in mast cells is promoted by the mTOR specific activator, MHY1485. BMMCs were sensitized with 1 µg/ml of anti-DNP-IgE for 5 h, incubated with 2 µM of MHY1485, and then stimulated with DNP-HSA Ag for the indicated times. The cells were lysed and phosphorylation of S6K and 4E-BP1, downstream effectors of mTORC1 as well as phosphorylation of mTORC2 target Akt were assessed using immunoblotting. The levels of phospho-S6K at Thr389 and phospho-4E-BP1 at Thr37/46 were markedly enhanced, but the levels of phospho-Akt at Ser473 were significantly diminished in MHY1485-treated cells compared with those in DMSO-treated controls (Figure 1A). These data suggest that MHY1485 increases mTORC1, but decreases mTORC2 signaling in mast cells following FcεRI cross-linking.
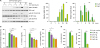 | Figure 1Effects of MHY1485 on FcεRI-mediated degranulation and cytokine production in mast cells. BMMCs were sensitized for 5 h, incubated with the indicated concentration of MHY1485 for 1 h, and then either unstimulated (unstim) or stimulated with the DNP-HSA Ag. (A) Time-course immunoblot analysis for mTOR signaling, with or without MHY1485, following Ag stimulation. Band densities of pS6K on Thr389 and pAkt on Ser473 were normalized to their total protein expression from the results of 3 independent experiments. AU represents arbitrary unit. (B) Degranulation was assessed by measuring β-hexosaminidase release 30 min after stimulation. (C) The levels of IL-6 and TNF-α proteins in the media were analyzed using ELISA 6 h after stimulation. (D) qRT-PCR analysis for FcεRI-mediated induction of Il6 and Tfna mRNA was carried out 1 h after Ag stimulation. Bar graphs are shown as mean±standard error of the mean of triplicates and are representative of 3 independent experiments. A p-value of less than 0.05 between stimulated groups with and without MHY1485 treatment is judged significant and indicated.pS6K, phospho-S6K; Thr389, threonine 389; pAkt, phospho-Akt; Ser473, serine 473; qRT-PCR, quantitative real-time PCR.
*p<0.05, **p<0.01, ***p<0.001.
|
To investigate the effects of MHY1485 on FcεRI-mediated mast cell function, IgE-sensitized BMMCs were incubated with MHY1485 at the indicated doses. β-hexosaminidase is enriched in the secretory granules of mast cells and therefore is used as a typical marker of mast cell degranulation (1314). At 30 min after Ag stimulation, the release of β-hexosaminidase from the activated cells was significantly reduced by MHY1485, in a dose-dependent manner (Figure 1B), indicating that MHY1485 inhibits FcεRI-mediated mast cell degranulation. In the late phase response, activated mast cells newly generate and secrete a number of proinflammatory cytokines, including IL-6 and TNF-α (24). To further examine whether MHY1485 regulates cytokine production, the culture supernatants were harvested 6 h after stimulation. The amounts of IL-6 and TNF-α released into medium decreased according to the dose of MHY1485 used (Figure 1C). Consistent with the result for cytokine release, the mRNA levels of Il6 and Tnfa were decreased in these cells (Figure 1D). These data suggested that MHY1485 suppresses both the immediate and late phase reactions in FcεRI-mediated mast activation.
MHY1485 suppresses mast cell proliferation
The mTOR pathway regulates cell growth, proliferation and death by responding to a variety of environmental stimuli, such as nutrients and energy (15). MHY1485 exerts protective effects on cell death induced by dexamethasone and ultra violet (UV) radiation (1617). IL-3, together with stem cell factor, is an essential growth factor to maintain mast cell survival and proliferation (1). Thus, removal of IL-3 leads to apoptotic cell death in cultured mast cells (1819). To investigate the effects of MHY1485 on the proliferation and survival of mast cells, BMMCs were cultured in medium with or without IL-3. The relative amounts of viable cells were calculated using the WST-8 assay after 6 days of culture. As shown in Figure 2A, MHY1485 dose-dependently reduced the number of viable cells in IL-3 sufficient medium, whereas it had no effect in the absence of IL-3.
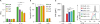 | Figure 2Effects of MHY1485 on mast cell proliferation and apoptosis. BMMCs were cultured in IL-3 sufficient or deficient media, with or without the indicated concentrations of MHY1485 for 6 days. (A) WST-8 assay to determine cell numbers 6 days after culture. (B) IL-3 withdrawal-induced cell death. Annexin V-positive apoptotic cells were analyzed using flow cytometry. (C) Cell proliferation analysis. CFSE-labeled BMMCs were cultured in the indicated conditions and CFSE dilutions were analyzed using flow cytometry. The gMFI of each histogram was used to represent the cell proliferation activity. Data are shown as mean ± standard error of the mean of triplicates and are representative of 3 independent experiments. Statistical significance between non-treated and MHY1485-treated cells is indicated.gMFI, geometric mean fluorescence intensity.
*p<0.05, **p<0.01, ***p<0.001.
|
A decrease in cell number can be caused by either an increased ratio of cell death and/or decreased proliferation. Flow cytometry analysis of annexin V-stained cells showed a comparable effect of MHY1485 on apoptotic cell death induced by IL-3 removal (Figure 2B). BMMCs were labeled with CFSE, which is a cell-permeable dye diluted during division. Interestingly, the levels of CFSE were decreased in proportion to the increased concentration of MHY1485 (Figure 2C). Taken together, these results suggested that MHY1485 inhibits mast cell proliferation but not survival in growth factor-sufficient condition.
mTOR signaling influences many aspects of the immune system, including the development, differentiation, activation, growth, and survival of immune cells (89). Although studies using antagonists and deletion of components in the mTOR pathway have revealed that mTOR signaling controls degranulation; cytokine and chemokine production; and homeostasis of mast cells (101120); the details of how the mTOR pathway is involved in mast cell biology remain unclear.
The present study was undertaken to investigate how the direct activation of mTOR regulates FcεRI-mediated activation and the function of mast cells. MHY1485, an agonist that binds directly to mTOR (12), amplifies the FcεRI-mediated mTORC1 but suppresses mTORC2 pathway in mast cells, in which both degranulation and cytokine production are downregulated (Figure 1). It has been reported that mTORC1-S6K phosphorylates Rictor (rapamycin-insensitive companion of mTOR) on threonine 1135, resulting in inhibition of mTORC2-Akt signaling (212223). Given that Akt plays pivotal roles in FcεRI-mediated mast cell function (2425), the hyperactivation of mTORC1-S6K signaling by MHY1485 might negatively regulate degranulation and cytokine production through inhibiting mTORC2-Akt pathway. We previously reported that the hyperactivation of mTORC1 by deletion of Tsc1 suppressed mast cell degranulation and histamine release, but enhanced IL-6 and TNF-α production, in vitro and in vivo, following FcεRI stimulation (11). Interestingly, treatment with rapamycin could reduce this increase in cytokine production but was incapable of restoring impaired degranulation in Tsc1-deficient mast cells. In contrast to other study (10), rapamycin could inhibit both mast cell degranulation and cytokine production following FcεRI stimulation in our experimental conditions (data not shown). TSC1 is a subunit of the TSC1–TSC2 complex that suppresses the mTOR pathway by inhibiting the small GTPase RAS homolog enriched in brain (Rheb), which is upstream of mTORC1 (26). The differential effect of MHY1485 compared with TSC1 deficiency on cytokine production suggested that the TSC1-TSC2 complex might be involved in other regulatory pathways in addition to mTORC1. Indeed, TSC1 controls the formation of neuronal spine synapses by inactivating Rheb independently of mTORC1 (27). The activity of TSC1 as a co-chaperone to facilitate folding of kinases can affect other signaling pathways in mast cells (28).
In the present study, we showed that the increase of mast cell number was attenuated during culture in IL-3 sufficient medium containing MHY1485 due to defective proliferation but not cell death (Figure 2). It has been reported that MHY1485-mediated mTOR activation prevents dexamethasone and UV, which are inducers of reactive oxygen species (ROS), from damaging osteoblasts and skin cells, respectively (1617). Moreover, TSC1-deficiency promoted ROS production, resulting in mast cell apoptosis, which was exacerbated by IL-3 withdrawal (11). Notably, the acute and chronic effects caused by drug treatment and germ-line deletion of TSC1 could exert differential effects on mTOR-related biological phenotypes. It is possible that the action of MHY1485 is dependent on cell contexts and cell types.
In summary, MHY1485 inhibits the FcεRI-mediated activation and function of mast cells, such as degranulation and cytokine production, and decreases their proliferation. Signaling from the mTOR pathway is complex and requires further studies to determine its precise mechanism in mast cells. However, our findings suggest the potential therapeutic use of a selective mTOR activator in mast cell-related diseases and provide insights into the fundamental roles of hyperactivated mTORC1 in the immune system.
 XML Download