

 PDF
PDF ePub
ePub Citation
 Print
Print


INTRODUCTION
In the last 2 decades, membrane technology has been greatly improved and is widely used for multiple applications such as water treatment, removal of toxic materials, protein filtration, attachment of molecules, and so on. For these applications, attempts have been made to produce various materials in the membrane form. One of these materials, polyvinylidene fluoride (PVDF), has received intense consideration because of its exceptional properties including mechanical durability, thermal stability, chemical endurance, and so on (1234). Therefore, PVDF membranes have been intensively studied in chemical and biological filtration for separation purposes. Although the potential of PVDF in the filtration industry is unavoidably high, its effect on the immune system is incompletely studied.
The immune system comprises 2 arms: innate and adaptive immunity (5). Innate immunity acts as the first line of defense, whereas adaptive immunity works specifically to fight infections (6). These 2 arms usually cooperate to mount proper immune responses against pathogenic molecules or organisms, even though they use different pathways (7). We focused on innate immune cells because these are the first cells to identify foreign materials and decide whether an immune response needs to be initiated (8). Therefore, stimulation of innate immune cells may induce improper responses to infectious diseases.
Macrophages have been studied over the last few decades for their roles in response to pathogens (9). These cells can produce proinflammatory molecules such as nitric oxide (NO) and proinflammatory cytokines when stimulated by bacterial endotoxins such as lipopolysaccharide (LPS), CpG, or others (810). Production of these molecules can initiate innate immune responses to possible harmful materials. Thus, macrophage activation may determine whether or not a particular material can induce inflammatory responses (11).
Using this system, we previously reported that single-walled carbon nanotubes (SWCNTs) induce cell death and tumor necrosis factor α production in macrophages without affecting NO production (12). Since carbon nanotubes (CNTs) are free floating materials, we hypothesized that CNTs-attached PVDF do not affect macrophage function. Here, we examined if PVDF and CNTs could modulate the immune response mounted by LPS-stimulated macrophages. We found that PVDF membrane with or without CNTs induced apoptosis in macrophages. These materials also inhibited NO production by LPS-activated macrophages, possibly due to cell death. In addition, macrophages stimulated by PVDF showed increased number of cells in the G2 and S phase of the cell cycle. These data suggest that PVDF can modulate inflammatory responses.
MATERIALS AND METHODS
Cells
The murine macrophage cell line RAW 264.7 (RAW), was cultured in DMEM containing 10% Hyclone™ fetal bovine serum (GE Healthcare Life Sciences, Logan, UT, USA) and 1% Hyclone™ penicillin/streptomycin (GE Healthcare Life Sciences) at 37°C under 5% CO2.
Reagents
LPS from Escherichia coli 0111:B4 was purchased from Sigma-Aldrich Korea (Yongin, Korea). Two types of CNT filters were fabricated using multi-walled carbon nanotube (MWCNT) and SWCNT inks (Applied Carbon Nano Technology, Pohang, Korea). In the inks, CNTs were suspended in a water-based solvent containing dispersants. The average width and length of the CNTs was 18 nm and 0.1 μm, respectively. Before preparing the CNT filters, the MWCNT (1.0 wt.%) ink was diluted 10-fold in deionized (DI) water, whereas the SWCNT (0.1 wt.%) ink was not diluted. The diluted MWCNT ink (10 ml) or SWCNT ink (10 ml) was passed through a 47 mm PVDF filter (0.1 μm pore size; Merck Millipore, Billerica, MA, USA) using a vacuum filtration unit. The residual dispersants in these prepared CNT filters were removed by passing 200 ml of DI water through the filters using the same filtration unit. The fabricated CNT filters were kept in a desiccator before the toxicity test.
NO assay
The Griess reagent measures nitrite (NO2−) concentration, which is used as a standard of inflammation. Griess reagent was prepared with 1% sulfanilamide, 0.1% naphthylethylenediamine dihydrochloride, and 2% phosphoric acid, which were dissolved in water and the bottle was wrapped the bottle in aluminum foil until use. Following the pretreatment of cells for 18 to 24 h with PVDF, SWCNT, or MWCNT, and treatment with LPS at 3 h after cell seeding, an equal volume of supernatant and Griess reagent was mixed in a 96-well plate as described previously (13). Absorbance was measured using a spectrophotometer at 540 nm. DMEM treated cells was used as the negative control. The nitrite concentration was determined based on a standard curve generated using sodium hydroxide nitrite.
MTT assay
RAW cells grown in a 96-well plate (1×10⁶ cells/ml) were treated with PVDF, SWCNT, MWCNT, or LPS (1 ng/ml) for 18 to 24 h. Cells treated with DMEM were used as the negative control. Cell viability was measured using the CellTiter 96® Non-Radioactive Cell Proliferation Assay (Promega Corp., Madison, WI, USA) according to the manufacturer's instructions. Cell death greater than 20% was considered significant.
Cell cycle analysis
Cells were stimulated with LPS and each membrane with SWCNT, or MWCNT for 24 h. The incubated cells were washed with PBS and fixed in ice-cold 70% ethanol at −20°C for 1 h. Cells were stained with Krishan buffer at 37°C for 30 min after washing in PBS (14). The stained cells were examined by flow cytometry and analyzed using FlowJo software (Tree Star Inc., San Carlos, CA, USA).
Apoptosis/necrosis detection
Cells were treated with LPS and each membrane was treated with SWCNT, or MWCNT. The treated cells were stained with annexin V and propidium iodide (BD Biosciences, San Jose, CA, USA) using a BD Pharmingen™ FITC Annexin V Apoptosis Detection Kit II (BD Biosciences). Stained cells were detected by flow cytometry (BD LSRFortessa™ cell analyzer; BD Biosciences) and the acquired data was analyzed using FlowJo software version 9.3.3 (Tree Star Inc.).
RESULTS
PVDF treatment decreased NO production in LPS-activated macrophages
To test our hypothesis that CNTs bound to PVDF membranes do not modulate macrophage function, we treated RAW cells with 3 different PVDF membranes: 1) PVDF membrane alone, 2) SWCNT-attached PVDF membrane, and 3) MWCNT-attached PVDF membrane. NO production in these cells was measured after 24 h of treatment. To our surprise, LPS-stimulated RAW cells treated with any of these materials produced reduced amounts of NO compared to the negative control (Fig. 1). These data suggest that PVDF or CNT-attached PVDF can inhibit macrophage activation by LPS.
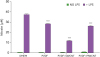 | Figure 1Effect of PVDF membrane on NO production in LPS-stimulated RAW cells. RAW cells were cultured and stimulated with PBS or LPS. These cells were then treated with one of the membranes for 24 h, as indicated. Cells treated with DMEM served as negative controls. Culture supernatants were harvested and tested for NO production. Data are shown as mean±standard deviation values of triplicates in each group. These data are representative of 2 independent experiments.
***p<0.001.
|
The number of macrophages was reduced following treatment with CNT-attached PVDF
As NO production in LPS-stimulated macrophages was inhibited by PVDF with or without CNT attachment, we examined whether there were any changes in cell number. RAW cells were seeded in a 96-well plate and treated with or without LPS. After 24 h of treatment, the cell number was examined by an MTT assay. Surprisingly, treatment with PVDF alone decreased the number of macrophages (Fig. 2). Moreover, the number of macrophages was also reduced by treatment with SWCNT- or MWCNT-bound PVDF. These findings suggest that PVDF with or without SWCNT affects macrophage homeostasis, resulting in reduced expression of NO.
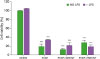 | Figure 2Influence of PVDF membrane on RAW cell survival with or without LPS stimulation. PBS or LPS-stimulated RAW cells were treated with the indicated membrane for 24 h. DMEM treated RAW cells were used as negative controls. After removing the culture supernatants, the cells were examined for survival compared with the negative controls. The plotted values represent survival rate±standard deviation. These data are representative of 2 independent experiments.
***p<0.001.
|
PVDF increased cell cycle of macrophages
Since we found reduced number of RAW cells after PVDF treatment, we hypothesized that these cells underwent cell cycle arrest. To test this hypothesis, we treated RAW cells with PVDF, SWCNT-bound PVDF, or MWCNT-bound PVDF for 24 h and performed cell cycle analysis. In response to PVDF alone, RAW cells showed increased frequency in the S/G2 phase regardless of LPS stimulation, suggesting that PVDF induced activation and proliferation of RAW cells. Although RAW cells without LPS stimulation were not affected by treatment with PVDF+SWCNT or PVDF+MWCNT, LPS-stimulated RAW cells showed a substantially increased ratio of cells in the S/G2 phase with the same treatments (Fig. 3). We thus concluded that treatment with PVDF does not induce cell cycle arrest in macrophages. Instead, PVDF increased the proportion of macrophages in the cell cycle probably due to activation of these cells, especially upon stimulation with LPS.
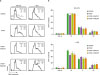 | Figure 3Altered cell cycle in RAW cells after exposure to PVDF membrane. Cells were treated with PVDF, PVDF+SWCNT, or PVDF+MWCNT. The cells were then exposed to LPS or LPS-free conditions for 21 h, and then stained using the Krishan staining buffer. (A) Stained cells were analyzed by flow cytometry and a histogram was obtained. The cell cycle of these cells was examined based on the DNA content of RAW cells. (B) The plotted values represent mean±standard deviation. The data are representative of 3 independent experiments.
*p<0.05.
|
PVDF treatment induced apoptosis in murine macrophages
Considering that the frequency of PVDF-treated macrophages in the S/G2 phase was increased compared to controls, we examined whether these cells underwent activation-induced cell death. RAW cells were stimulated either with PBS or LPS, and then treated with PBS, PVDF alone, SWCNT-bound PVDF, or MWCNT-bound PVDF for 24 h. These cells were then analyzed for annexin V expression by flow cytometry. As shown in Fig. 4, the ratio of apoptotic RAW cells in the LPS-stimulated group was 3 times greater than the negative controls. When these cells were treated with PVDF alone, the ratio of apoptotic cells was increased irrespective of the absence (5.83→19.2) or presence (17.4→35.3) of LPS. Although the percentage of apoptotic cells upon treatment with CNT-bound PVDF was unchanged in the LPS treated RAW cells, the ratio of annexin V+ cells was increased by 2-fold compared to the DMEM control in the absence of LPS. Overall, these data suggest that PVDF induces activation-induced cell death in macrophages irrespective of the presence of CNT, resulting in decreased production of NO.
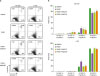 | Figure 4Increased apoptosis in RAW cells after treatment with PVDF. Cells were treated with the 3 types of membrane: PVDF, PVDF+SWCNT, and PVDF+MWCNT. The cells were then exposed to LPS or LPS-free conditions for 21 h and then stained with annexin V and propidium iodide. (A) Stained cells were examined by flow cytometry. (B) The data shown are means of triplicates±standard deviation. Similar results were obtained in 3 independent experiments.
*p<0.05.
|
DISCUSSION
PVDF has been widely used in the membrane industry but its biological effects remain to be addressed. In this study, we examined PVDF for its ability to modulate inflammatory responses in murine macrophages. When macrophages were treated with PVDF, NO production in response to LPS was inhibited. We also observed reduced numbers of these cells after PVDF treatment for 24 h, probably due to activation-induced cell death.
The proinflammatory effects of PVDF have been reported previously in animal models. PVDF was found to induce inflammatory and fibrotic reactions, even though the level of these reactions was lower than those induced by polypropylene (PP) (15). In other reports, PVDF and PP induced comparable foreign body reactions such as granuloma formation (1617). PVDF could induce inflammation in these animal models, involving various leukocytes including T cells, B cells, macrophages, and possibly others. Since it is difficult to dissect the roles of each cell type, we focused on the effects of PVDF on LPS-stimulated macrophages. Although PVDF showed a reduced level of inflammation compared to PP in previous reports, we found that PVDF showed toxicity in macrophages resulting in cell death. Altogether, these data suggest that PVDF modulates inflammatory reactions by causing cell death in macrophages.
Fig. 4 shows that treatment with PVDF induced apoptosis in macrophages; however, the cause of this cell death is not clear. One possible explanation is that these cells underwent activation-induced cell death (18). Macrophages treated with PVDF appeared to be activated as observed by their increased proportion in the S/G2 phase of the cell cycle. Notably, treatment with PVDF alone showed more cells in the G2 phase than the PVDF+CNT treatment in normal macrophages, whereas treatment with PVDF alone showed fewer cells in the G2 phase compared to treatment with CNT-attached PVDF in LPS-stimulated macrophages. These data may indicate that the effects of PVDF combined with CNT may vary depending on the activation status of macrophages.
We previously demonstrated that CNT could induce necrosis in macrophages (12). This is probably due to the asbestosis caused by “frustrated macrophages” (19). We therefore hypothesized that membrane-bound CNT does not induce cell death and could facilitate the use of CNT in health purposes. However, PVDF itself altered the survival of macrophages. Therefore, other mesh materials need to be explored for carrying CNT with minimal inflammatory responses.
In this study, we examined the function of CNT-attached PVDF on inflammatory responses. Macrophages treated with CNT-attached PVDF showed reduced NO production probably due to cell death. PVDF could also activate macrophages resulting in their proliferation. Finally, PVDF-treated macrophages underwent cell death probably through activation-induced cell death. Taken together, these data indicate that PVDF needs to be investigated for medical applications.
 XML Download