

 PDF
PDF ePub
ePub Citation
 Print
Print


INTRODUCTION
Lymphocytic choriomeningitis virus (LCMV) has been extensively studied and is closely associated with the development of modern immunology. This includes T-cell biology during persistent and acute infection, illustrating the importance of the detection of this virus (1). LCMV is a non-cytopathic prototype virus belonging to the arenavirus group. It is an ambisense RNA virus that contains 2 RNA segments, glycoprotein (GP) 1, GP2, and nucleoprotein (NP), which constitute the viral envelope with internal components (2). In particular, persistent infection by the stabilization of the keratin network is associated with the spread and action of LCMV NP, which is essential for viral propagation and vaccine development (34).
For decades, modified versions of several plaque assays to detect rubella and poliovirus have been established for the quantification of LCMV strains (5678). However, these tools require counting with the naked human eye and may be time consuming, highlighting the need for an improved detection method. The limited sensitivity, subjective judgment by the observer, and long procedures associated with these methods have encouraged the development of techniques based on quantitative PCR (qPCR) to detect LCMV-derived transcripts, including GP and NP in vivo and in vitro (910). However, qPCR-based detection of LCMV has some drawbacks; this method cannot distinguish actual functional viruses (1112) and only detects RNA copies of viruses. Some reports have suggested the presence of defective interfering LCMV in persistently infected cells, reflecting the lack of viral replication (1213). Moreover, RNA detection using qPCR is disadvantageous, owing to the difficulty involved in the setup of a clean detection environment through the exclusion of contaminating factors such as RNase, pyrogens, and other RNAs.
Studies have reported detection methods based on LCMV-specific antibodies (141516). Korns Johnson and Homann (17) recently reported an LCMV detection method using NP-specific antibody with flow cytometry that provides suboptimal conditions with a 96-well plate system. These authors established a protocol for this approach and emphasized the functional aspects of flow cytometry. However, the presented methods need to be further improved in terms of variables such as host cell type, detection scale, cell number, and incubation time. Here, we suggest methods to improve and optimize the semi-functional quantitative flow cytometry (SFQF) assay, LCMV detection method, with flow cytometry using LCMV NP-specific antibody. In addition, we provide more specific implications for its utility in the analysis of LCMV infection in vitro and in vivo.
Go to : 
MATERIALS AND METHODS
Cell culture
Vero (verda reno) and baby hamster kidney 21 (BHK21) cells were obtained from Rafi Ahmed. Cell lines were expanded in DMEM supplemented with 10% fetal bovine serum (FBS), 1% penicillin/streptomycin, and 1% l-glutamine. Cells were detached after treatment with PBS, followed by their incubation with trypsin-EDTA at 37°C for 3 min. The expanded cell lines were aliquoted and stored with DMEM solution supplemented with 10% DMSO and 50% FBS in liquid nitrogen.
LCMVs
LCMV Armstrong (ARM) 53b, a triple plaque-purified isolate of LCMV ARM CA1371 (18), and LCMV clone 13 (CL13), a variant derived from an LCMV ARM CA1371 carrier mouse (19), were obtained from Rafi Ahmed (Emory Vaccine Center, Atlanta, GA, USA). All experiments involving LCMV viruses followed appropriate guidelines related to Biosafety Level 2.
Infection and tissue harvest
C57BL/6 mice were intravenously infected with LCMV CL13 (2×10⁶ pfu/ml). The spleens were dissected from infected mice 10 days after infection, followed by complete tissue homogenization using a homogenizer (Kinematica, Luzern, Switzerland). Mice were anesthetized by isoflurane inhalation before blood collection (eye bleeding) or euthanization. Harvested blood was centrifuged at 13,000 rpm and 4°C for 5 min. Prepared samples were used for each experiment.
Plaque assay
Vero cells were grown to 90%–95% confluence before the day of plaque assay. A total of 3.5×10⁵ cells were incubated in 6-well plates in 3 mL of DMEM complete medium for 12 h. Dilutions were made according to the experimental conditions in a round-bottomed plate comprising 225 µl plain medium and 25 µl viral stock. After removing the medium, the cells were infected with 200 µl serial diluents and incubated for 1 h under shaking condition (once every 15 min) to prevent drying. Warm 199 medium mixed with 1% agarose was overlaid and incubated for 4 days. After 4 days, 1% neutral red was added and the cells were incubated for 18 h. Plaques were counted and calculated considering dilution factors.
Antibody specific for LCMV NP and fluorescent conjugation
The antibody for LCMV NP (VL-4 clone) and its isotype IgG2a were purchased from Bio X cell (West Lebanon, NH, USA) and conjugated with Alexa Fluor 647 monoclonal antibody labeling kit (Molecular Probe; Thermo Fisher Scientific, Waltham, MA, USA), as per the manufacturer's instructions. In brief, VL-4 antibody was prepared at 1 mg/ml in 100 µl aliquots at −70°C until its use for conjugation with the fluorescent agent. A total of 100 µl VL-4 antibody solution was incubated with the prepared Alexa 647 labeling solution. The mixture was added to a spin column and centrifuged at 1,100 ×g for 5 min. Alexa 647-conjugated VL-4 antibody was collected and stored in the dark at 4°C.
Antibody staining for SFQF
Vero cells were detached from plates with trypsin-EDTA at the end of the experiments. Cells were washed with fluorescence-activated cell sorting (FACS) buffer supplemented with 2% FBS and 0.1% sodium azide. Cells were treated with fixation/permeabilization solution for 20 min and washed with Perm/Wash buffer. Cells were treated with VL-4 antibody conjugated with Alexa 647 for 35 min at room temperature. Cells were washed twice with FACS buffer and analyzed by flow cytometry.
Go to :
RESULTS
Vero cells were more frequently infected with LCMV than BHK21 cells
LCMV propagates in a host cell expressing α-dystroglycan receptors. α-Dystroglycan receptor is expressed across species, including mouse, hamster, monkey, and human, especially in fibroblast or epithelial cell lines. In particular, BHK21 cells show no end-product contamination derived from the shedding of other endogenous retroviruses. In addition, Vero cells have been used for plaque assays for approximately 30 years (2021).
To provide an optimal titration platform for LCMV infection, Vero and BHK21 cells were seeded into 6-well plates and incubated in a humidified 37°C incubator for 24 h. The cells were infected with LCMV ARM at a series of dilutions from 106 to 102 pfu/ml for 1 h. After 24 h, Vero and BHK21 cells were stained and analyzed using LCMV NP-specific VL-4 antibody by flow cytometry. NP was detected in both Vero and BHK21 cells infected with more than 103 pfu/ml (Fig. 1A). We found that Vero cells were about 7-times more sensitive to infection than BHK21 cells upon treatment with 103 and 104 pfu/ml. The detection of NP+ cells reached its saturation level at 105 and 106 pfu/ml dilution in Vero and BHK21 cells, respectively (Fig. 1A). We also confirmed the absence of any background signals by staining with an isotype control for VL-4 antibody, thereby excluding the possibility of non-specific binding between VL-4 antibody and cell lines (Fig. 1B). This observation may be attributed to the differences in the expression of α-dystroglycan receptors or the rate of LCMV replication in these cells. As BHK21 cells replicate more rapidly than Vero cells (data not shown), the exponential growth rate of these cells may affect the results. Vero cells may be more suitable for the detection of viral protein expression, as these cells proliferate slower than BHK21 cells and show better monolayer arrangement. Based on these results, we chose Vero cells as a cell platform for the detection of LCMV NP by flow cytometry.
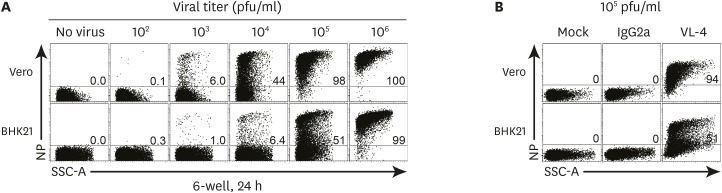 | Figure 1Vero cells were more susceptible than BHK21 cells to LCMV ARM infection. A total of 3.0×10⁵ Vero and BHK21 cells were plated in a 6-well plate with 3 ml of DMEM complete medium for 15 h before use. After the removal of the culture medium, cells were treated with 200 µl of serial dilutions (106 to 102 pfu/ml) of LCMV ARM for 1 h. A total of 2 ml of the medium was dispensed and cells were stained with VL-4 after 24 h of incubation, followed by flow cytometry analysis. (A) NP expression in Vero and BHK21 cells infected with serial dilutions of LCMV ARM. (B) The expression of isotype control of VL-4 antibody (IgG2a) in Vero and BHK21 cells infected with LCMV ARM (105 pfu/ml). The number in the plot indicates the percentage of NP+ cell population in Vero and BHK21 cells. Data are representative of 5 independent experiments.
SSC-A, side scatter area.
|
Optimization of cell confluence excluding cell overgrowth
Prior to the optimization of conditions, a suitable number of cells were plated and synchronized cell distribution was set for each scale, including 6-, 12-, and 24-well plates. This not only affects the efficiency of viral detection but also changes the point at which a monolayer develops depending on the number of cells plated. In addition, it influences the changes in the rate of viral penetration or level of cell quality for cells that adopt multilayered arrangements.
To establish appropriate conditions at each scale, we set cell confluence to reach 50%–70% 15 h before seeding cells in each plate. We calculated the number of cells proportional to the area of each plate scale. The numbers of cells to be plated were separated into 2 groups, high and low seeding numbers. Briefly, 1.5×10⁵, 6.0×10⁴, and 3.0×10⁴ cells were seeded as low seeding numbers, while 3.0×10⁵, 1.2×10⁵, and 6.0×10⁴ cells were seeded as high seeding numbers in 6-, 12-, and 24-well plates, respectively. The cell confluence was about 50% during the seeding of low seeding groups, while 70% confluence was achieved for high seeding groups in all plate scales (Fig. 2).
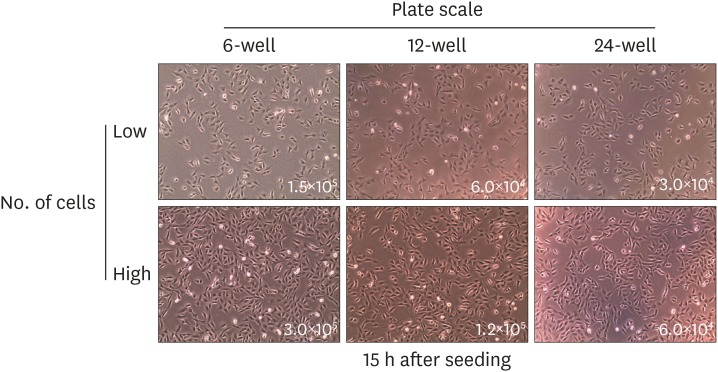 | Figure 2Initial cell seeding number was set to high and low for each plate scale. Cell numbers for each scale were calculated in proportion to the size of 6-, 12-, and 24-well plate. Cells were seeded and incubated for 15 h prior to infection. The number in the image visualized by an optical microscope indicates the cell count of seeded cells as high (top) and low (bottom) confluence in each plate. Data are representative of 2 independent experiments.
|
Korns Johnson and Homann (17) reported LCMV titration method using flow cytometry with 48 or 72 h of incubation of 5.0×10⁴ cells in a 96-well plate. However, the number of cells seeded in their experiment may likely induce overgrowth and formation of a multilayer arrangement, which may lead to misreading of the viral titer. Moreover, it is difficult to maintain cell quality in the acidic environment developed due to cell metabolism in a 72-h long culture. Indeed, 72-h incubation decreases R2 value of the standard curve, owing to the increased variability in the linear range at a low viral dose (17). Therefore, the numbers of seeded cells were optimized in each plate scale during the optimization of SFQF assay.
Establishment of optimal conditions of SFQF assay
We provided several conditions such as suitable cell type, seeding number, and plate scale to validate variables of SFQF assay. We determined the combination that is most sensitive and appropriate for the detection of LCMV NP using VL-4 antibody. In addition, we added incubation time as an additional variable to the experiment. As long-term incubation leads to cell overgrowth in the limited area of the plate, LCMV ARM will may show variable infection rate and the virus that propagates in the cell may disseminate into nearby cells. This may affect the linear virus detection, which would be masked by the exponential detection elicited by cell division. Moreover, the doubling times differ across LCMV strains, including LCMV ARM (5.86 h), reassortant WE-ARM (4.94 h), WE (4.16 h), DOC (3.56 h), and Traub (3.92 h) (22); hence, differences in the doubling rate of viruses during long-term incubation may induce nonlinear replication of viral species. Therefore, maximum incubation time limits need to be predicted and reflected in the conditions. We established a 3-dimensional index, including plate scale (6-, 12-, and 24-wells), cell number (high and low), and incubation time (24 and 48 h) (Fig. 3). As the virus concentration increased, the proportion of NP+ cells exponentially increased in all plate scales (Fig. 3), suggesting that the effective threshold of the linear curve may be provided by the appropriate dilution factor. NP+ cell populations were detected in Vero cells treated with 104 and 102 pfu/ml LCMV ARM in 6-well plate for 24 and 48 h, respectively (Fig. 3). Thus, 48-h incubation is associated with 100-times greater sensitivity to detect LCMV NP as compared with 24-h incubation. Therefore, 48 h of incubation was selected for SFQF assay as an optimal initial detection point. The proportion of NP+ cells increased with in the high seeding group as compared with the low seeding group, suggestive of the beneficial effect of the broader spreading of cells to capture viruses. In particular, the groups treated with 103 pfu/ml LCMV ARM in 6-, 12-, and 24-well plates showed a 2- to 4-fold increase in sensitivity in high seeding group as compared with the low seeding group. In comparison to lower confluence conditions, higher confluence conditions may exclude the increase in NP+ population, owing to the proliferation of infected cells. Since Vero cells are untransformed cells derived from kidney of an African green monkey. These cells show contact inhibition characteristics. Therefore, high seeding number may achieve full confluence faster than low seeding number and exclude the effect of heritable population of NP+ cells from initial dividing cells (23). The number of NP+ cells was maximum upon treatment of high seeding groups with 102 pfu/ml LCMV ARM in 6-well plate for 48 h, suggestive of a large increase in the sensitivity of viral infection. Thus, the conditions most suitable for the detection of LCMV using SFQF assay include an incubation of 3.0×10⁵ cells in a 6-well plate for 48 h.
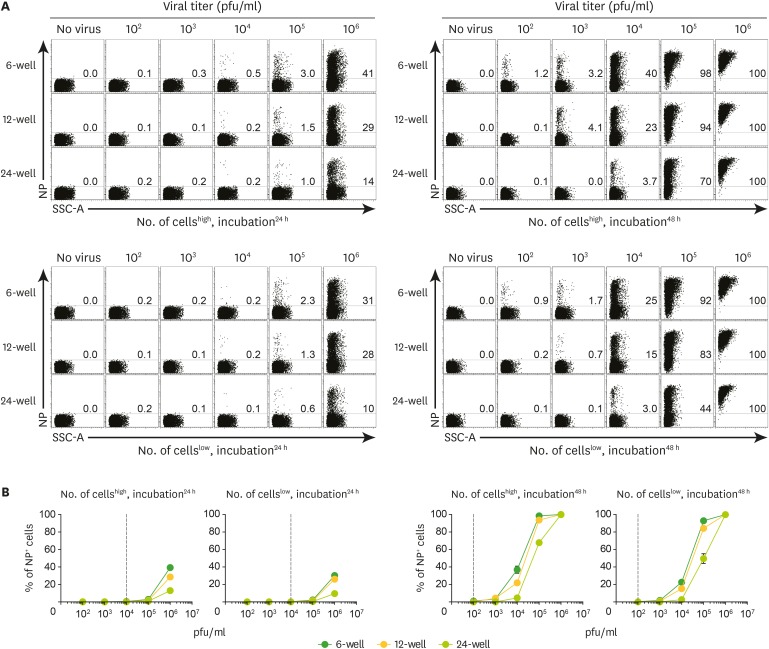 | Figure 3Validation of conditions such as plate scale, cell seeding number, and incubation time to establish an optimal method for SFQF assay. Vero cells were plated on 6-, 12-, and 24-well plates at high and low seeding numbers (as previously determined) and cultured for 15 h. The medium was removed and cells were treated with 200 µl of the serial dilution of LCMV ARM stock (106 pfu/ml) at each incubation time, followed by flow cytometry analysis. (A) The incubation of 48 h in a 6-well plate seeded with a high number of cells was optimal for LCMV detection. Numbers in representative plots indicate percentages of NP+ cells at indicated conditions such as cell seeding number and incubation time (left top, high and 24 h; left bottom, low and 24 h; right top, high and 48 h; right bottom, low and 48 h). (B) Line graphs summarize the representative data of Fig. 3A obtained from each condition. Data are representatives of 2 independent experiments.
SSC-A, side scatter area.
|
Calibrations of standard curve in SFQF and plaque assay reveal the detection threshold of LCMV NP
To ensure that the optimized SFQF assay conditions can replace the plaque assay, calibration curves of SFQF and plaque counts were created with serial dilutions to analyze the detection limits. We conducted plaque and SFQF assay with 2-fold serial dilution of LCMV ARM (106 pfu/ml) and calibrated the standard curve. As the detection threshold of the plaque assay remains to be revealed, the titer was calculated using the number of plaques from all dilutions to identify the limit of the detection range of viral load (Fig. 4). The standard curve of the plaque and SFQF assay exhibited an exponentially increasing number of plaques and NP+ cells upon treatment with serial dilution of LCMV ARM viral stock (106 pfu/ml). Moreover, standard curves of plaque and SFQF assays resulted in R2 values of 0.97 and 0.99, respectively. Interestingly, a moderate increase in the sensitivity of NP detection was identified above 102 pfu/ml, suggesting that SFQF assay provides advantages in terms of detection threshold at low doses of viral loads. Notably, a decrease in plaque assay titers was observed at 106 pfu/ml despite an increase in plaques beyond the shaded area, indicating that the excess of plaques may result in the saturation of the detection limits. Taken together, both SFQF and plaque assays can be used as accurate LCMV titration tools and the viral detection limits identified in this experiment require the plaque numbering to be around 30 for effective viral titer calculation.
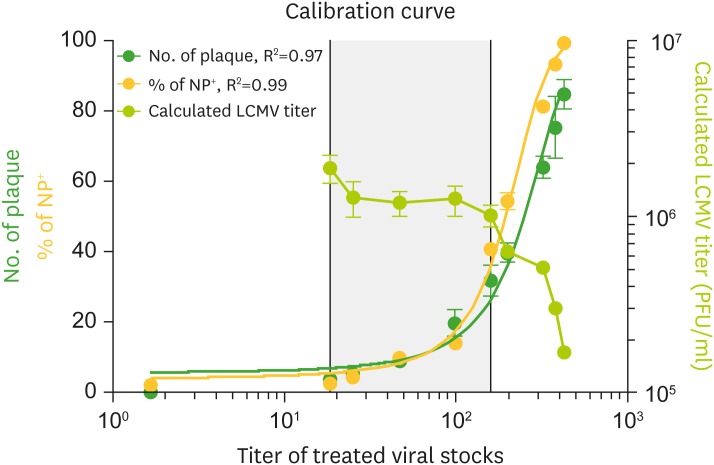 | Figure 4Plaque numbers and NP+ cell frequencies were correlated to obtain a standard curve. Vero cells were plated as per the conditions in Fig. 3 and infected with 200 µl of 2-fold dilution of LCMV ARM (106 pfu/ml) in the amount same as that in the plaque assay. After 48 h of incubation, the frequency of NP+ cells was analyzed by flow cytometry. All of the serial dilutions were analyzed by plaque assay to verify the threshold of the virus detection. Calibration curve of NP+ cell frequency (yellow circle) and plaque number (green circle). Calculation of plaque assay for each serial dilution (yellow green circle). Left Y-axis, right Y-axis, and X-axis indicate plaque number with NP+ cell frequency, calculated LCMV titer of each serial dilution, and titer of each treated serial dilution, respectively. R2 values were obtained using non-linear curve fit analysis. Data are representative of 3 independent experiments.
|
Frequency of NP+ cells were correlated with the number of plaques
We applied SFQF assay to LCMV titration ex vivo by infecting C57BL/6 mice with LCMV CL13, which induces chronic infection. The spleen and serum of infected mice were harvested after 10 days of infection. The data of the calibration curve shown in Fig. 4 reveals that the frequency of NP+ cells evaluated from SFQF assay was similar to the titer calculated by plaques counted in relevant plaque assay in spleen and serum (Fig. 5). Thus, SFQF assay can replace plaque assay for LCMV titration ex vivo.
 | Figure 5Validation of LCMV titration in tissues ex vivo. C57BL/6 mice were intravenously infected with LCMV CL13 (2×10⁶ pfu/ml). Spleens and serum were harvested from mice 10 days after infection. Homogenized spleens and bled serum from 10−4 to 10−2 dilution of original stocks were incubated with Vero cells and SFQF and plaque assays were manually performed. (A) Detection of NP+ proportion in serum and spleens of mice infected with LCMV CL13. Numbers in plots indicate the percentage of NP+ population. (B) Bar graphs summarize the titer calculated from the plaque assay (green bar) and frequency of NP+ cells measured by SFQF assay (yellow bar). n=3 mice per group in each experiment.
|
Go to :
DISCUSSION
In this study, we established optimal conditions for SFQF assay as a surrogate analytical tool for LCMV titration (Table 1). Although a previous report suggested the concept of LCMV quantification using flow cytometry, the optimization of a range of variables of SFQF assay performed in our study may replace the pre-existing LCMV titration tools. We suggest improved and critical factors, which provide information about appropriate cell type, incubation duration, plate scale, and cell number. Therefore, this platform can be compared with the previously reported setups used to establish LCMV titration tool with flow cytometry (Table 2). During the adjustment of parameters, we shifted the plate scale from 96 to 6 wells, cell number to 3.0×10⁵, and incubation time to 48 h to avoid cell overgrowth.

Table 1
Protocol of SFQF assay
![]()

We can compare the pros and cons of each LCMV detection tool with variable factors (Table 3). The plaque assay takes 5 days, but SFQF assay can detect viruses within 3 days. qPCR analysis takes 1 day for detection but poses difficulty of handling and may not reflect the functionality of the virus. On the other hand, qPCR can detect distinct components such as GP1, GP2, and NP and may be a helpful tool for the analysis of the extent of viral load, reflective of the functional aspects of specific viromes. Plaque and SFQF assays used for the detection of comprehensive infected cells offer the advantage of the detection of unknown variants or subtypes, regardless of the species (Table 3). NP+ population was detected at 20 pfu/ml in the standard curve of SFQF assay, which is more sensitive than the plaque assay that detected NP+ cells at 50 pfu/ml (Fig. 4 and Table 3). By re-examining the features of the various detection methods, it is possible to provide implications for the improved use of each assay. Aside from the methods used to detect transcripts (qPCR) and plaque count (plaque assay), the frequency of infected cells may be a new indicator of virus titration method using flow cytometry.

Table 3
Comparisons of LCMV detection methods with various approaches
![]()
LCMV strains have different replication kinetics across the clones. It is interesting that the doubling time of hepatitis C virus (HCV) depends on the specific disease status, including chronic progressing hepatitis (4 to 15 days), acute resolving hepatitis (2.3 to 10 days), and fulminant hepatitis (2.1 to 6.2 days). The doubling time of HCV and hepatitis B virus (HBV) is much slower than that of LCMV; hence, SFQF assay should be used to estimate loads of other types of viruses (2224). Thus, SFQF assay may display potential applications for the detection of viruses in laboratory animals and clinical settings.
Go to :
 XML Download