

 PDF
PDF ePub
ePub Citation
 Print
Print


Abbreviations
18F-FDG-PET/CT
positron-emission tomography integrated with computed tomography, using glucose labeled with the positron emitting radionuclide 18F
ASCT
autologous stem cell transplantation
BM
bone marrow
BMPC
bone marrow plasma cell
CI
confidence interval
EL
extramedullary lesion
EMP
extramedullary plasmacytoma
G-MDSC
granulocytic myeloid-derived suppressor cell
HBD
high bone disease
IMWG
International Myeloma Working Group
ISS
international staging system
LDH
lactate dehydrogenase
MM
multiple myeloma
M-MDSC
monocytic myeloid-derived suppressor cell
MRI
magnetic resonance imaging
NDMM
newly diagnosed multiple myeloma
OS
overall survival
PBMC
peripheral blood mononuclear cell
PET/CT
positron emission tomography integrated with computed tomography
PFS
progression-free survival
PL
paramedullary lesion
RR
relative risk
INTRODUCTION
Multiple myeloma (MM) is a neoplastic plasma-cell disorder characterized by clonal proliferation of malignant plasma cells in the bone marrow (BM) microenvironment, monoclonal proteins in the blood or urine, and associated organ dysfunction or tissue impairment resulting in so-called hypercalcemia, renal insufficiency, anemia, and bone lesions (CRAB) symptoms (1). Although malignant plasma cells in MM are typically confined to the BM, extramedullary plasmacytomas (EMPs) have a reported incidence of 7% to 18% at diagnosis (234). EMPs infiltrate in 2 different ways: extramedullary infiltration arising from hematogenous spread (extramedullary lesions [ELs]) and soft tissue infiltration originating from a bone lesion, i.e., the presence of extraosseous lesions linked to skeletal involvement (paramedullary lesions [PLs]) (245).
Although several imaging techniques can be used for the assessment of bone and soft-tissue disease in MM (56), positron emission tomography integrated with computed tomography, using glucose labeled with the positron-emitting radionuclide 18F (18F-FDG-PET/CT) is recommended when extramedullary involvement is suspected (i.e., severe localized pain, palpable masses, or suspected nervous system involvement) (257).
The occurrence of EMPs has been reported to be associated with poor prognosis, high mortality rate, and a shorter overall survival (OS) time in patients with MM (34). However, the distinct clinical features and outcomes of ELs and PLs remain uncertain. Therefore, the aim of this study was to compare the clinical features of PLs and ELs of plasmacytomas at diagnosis, using positron emission tomography integrated with computed tomography (PET/CT) in newly diagnosed symptomatic MM, and to address their prognostic impact.
MATERIALS AND METHODS
Study patients and treatment procedures
This retrospective study included 64 patients with newly diagnosed symptomatic MM who had ELs and/or PLs detected by PET/CT at diagnosis at a single institution between April 2009 and December 2016. Patients who were diagnosed with solitary plasmacytoma, asymptomatic MM, and plasma cell leukemia were excluded. Forty-four patients (69%) were transplant eligible, all of whom received novel agent-based induction chemotherapy (7 bortezomib+dexamethasone, 23 thalidomide+dexamethasone, 11 bortezomib+thalidomide+dexamethasone, and 3 bortezomib+melphalan+prednisone). Twenty-eight patients underwent autologous stem cell transplantation (ASCT) and 3 are currently under induction chemotherapy; 13 patients did not undergo ASCT owing to early mortality (n=3) and disease progression (n=10). Patients who had progressive disease prior to ASCT did not proceed to transplantation and, instead, received salvage chemotherapy. Twenty transplant-ineligible patients received chemotherapy (13 bortezomib+melphalan+prednisolone, 1 lenalidomide+dexamethasone, and 6 melphalan+prednisolone or high-dose dexamethasone). The Institutional Review Board of The Catholic University of Korea approved the research protocol for data analysis, and this study was conducted in accordance with the Declaration of Helsinki.
Definitions and evaluation of response
When extramedullary involvement was suspected, owing to localized pain, palpable masses, or neurological signs, examination using magnetic resonance imaging (MRI) and/or computed tomography (CT) was performed. PET/CT imaging was then used to screen the entire body of patients with positive MRI or CT findings. EMPs were divided into ELs (single or multiple highly vascularized nodules arising from hematogenous spread in the skin, liver, breast, kidney, and any other organ) and PLs (soft tissue infiltration originating from a bone lesion, i.e., the presence of extraosseous lesions linked to skeletal involvement), using PET/CT (268). A skeletal evaluation using X-ray images was also performed in all patients, in which the presence of 3 or more osteolytic lesions or fractures defined high bone disease (HBD).
The stage was determined using the Durie-Salmon staging system and the international staging system (ISS), and disease progression was assessed according to the criteria from the International Myeloma Working Group (IMWG) (9). Cytogenetic risk was assessed in 40 patients (62.5%). Patients with a deletion of chromosome 13 or hypodiploidy — determined using a conventional cytogenetic study — or t(4;14), t(14;16), and 17p- — determined using fluorescent in situ hybridization (FISH) of BM samples at diagnosis — were stratified as high risk (9).
Isolation of mononuclear cells and flow cytometric analysis
Blood samples for the analyses of immune cell populations were obtained at the time of diagnosis, and peripheral blood mononuclear cells (PBMCs) were isolated from whole blood (30 mL) collected in EDTA-coated tubes by centrifugation on Ficoll-Paque and were processed immediately. Forward scatter (FSC) and sideward scatter (SSC) on a linear scale were used for gating live cell populations. Then, CD4+ and CD8+ T cells were analyzed by flow cytometry. Anti-CD4-FITC and anti-CD8-PE were purchased from eBioscience (San Diego, CA, USA). Myeloid-derived suppressor cells (MDSCs) were divided into 2 categories: granulocytic MDSC (G-MDSC) and monocytic MDSC (M-MDSC). For G-MDSC, cells labeled with anti-HLA-DR-PerCP (BD BioSciences, San Jose, CA, USA) and anti-Lineage Cocktail 1 (Lin1)-FITC (BD BioSciences) were gated and then identified using rat anti-mouse CD11b-APC-Cy™7 (BD BioSciences) and mouse anti-human CD33-V450 (BD BioSciences) antibodies. The frequency of G-MDSC immunophenotyped as the HLA-DR-Lin-CD11b+CD33+ population was quantitated as a percentage of PBMC. For M-MDSC, cells labeled with anti-HLA-DR-PerCP (BD BioSciences) and anti-human CD14-APC antibodies (eBioscience) were gated. The frequency of M-MDSC immunophenotyped as the HLA-DR-CD14+ population was quantitated as a percentage of PBMC. Flow cytometry was performed using a FACSCalibur™ (BD Biosciences).
Statistical analysis
The study objectives were: 1) to compare the clinical features between the patients with ELs and PLs at diagnosis, and 2) to address its prognostic impact on survival outcomes. The χ2 test and Fisher's exact test were used to test the correlation of categorical variables. The 2-tailed Student's t-test was used to analyze continuous variables. OS was calculated from the date of diagnosis to the date of death from any cause, and surviving patients were censored at the final follow-up. Progression-free survival (PFS) was measured as the time from diagnosis to disease progression or death (regardless of cause), whichever occurred first. Kaplan-Meier curves for PFS and OS were plotted, and the log-rank test was used to assess potential prognostic factors. Covariates having a p-value of less than 0.1 in the univariate analyses were added to a Cox proportional hazards regression model, in which all p-values were 2-sided and statistical significance was set at p<0.05.
RESULTS
Patient characteristics
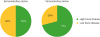
A total of 64 patients with symptomatic MM were included in this study. Of them, 22 had ELs and 42 patients showed only PLs. Table 1 lists the demographic information for all patients and subgroups according to the presence of ELs and PLs at initial diagnosis. Patients with ELs at initial presentation had unfavorable laboratory parameters of calcium and lactate dehydrogenase (LDH) at diagnosis, compared to those of patients with PLs, and showed a trend toward advanced ISS. Patients with ELs also showed a higher percentage of bone marrow plasma cells (BMPCs) than patients with PLs did. As shown in Table 2, the most common sites of PLs were the axial skeleton (57%), ribs (48%), pelvis (17%), skull (12%), and humerus (12%). The most common sites of ELs were the muscles (57%), pleura (14%), and lungs (9%). ELs were more often unifocal, whereas PLs were mainly multifocal. HBD was present in 50% and 71% of patients with ELs and PLs, respectively (Fig. 1).
Table 1
Baseline characteristics of patients
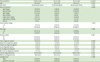
F, female; M, male; Hb, hemoglobin; Ca, calcium; Cr, creatinine; NA, not available.
*High-risk cytogenetics is defined as hypodiploidy or deletion 13 on conventional cytogenetics or presence of t(4;14), t(14;16), and 17p- on fluorescent in situ hybridization and/or conventional cytogenetics. All other cytogenetic abnormalities were considered standard risk.
![]()
Table 2
Involvement sites and number of ELs and PLs at diagnosis by PET/CT
![]()
Overall outcomes
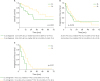
After a median follow-up of 29.2 months (range, 3.4–76.5 months) in survivors, the 2-year OS of patients with ELs was 35.1%, being significantly lower than that (52.6%) of patients with PLs (median months, 27.8 [95% confidence interval {CI}=5.8–26.2] and 54.2 [95% CI=36.9–71.4]; p=0.033) (Fig. 2A). In contrast, there was no difference in the PFS between patients with ELs and PLs (median months, 16.0 [95% CI=5.8–26.2] and 16.1 [95% CI=10.4–21.9]; p=0.818) (Fig. 2B). However, the PFS after 1st progression was significantly worse in patients with ELs than in those with PLs (median months, 8.2 [95% CI=1.8–14.5] and 12.9 [95% CI=7.3–18.5]; p=0.017) (Fig. 2C).
Prognostic factors affecting outcomes
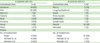
In univariate analyses (Table 3), ASCT, high serum albumin level, low serum calcium, and LDH levels were potential factors for a higher PFS. ASCT, low β2-microglobulin, and LDH levels were associated with a higher OS, and patients with ELs showed a lower OS than those with PLs did. Ultimately, in multivariate analyses, ASCT (relative risk [RR]=0.41; p=0.007) and low LDH levels (RR=2.17; p=0.018) were independent factors for a higher PFS. The presence of initial ELs, compared to PLs, was associated with a lower OS (RR=2.79; p=0.033), and patients receiving ASCT showed a trend toward better OS (RR=0.38; p=0.058) (Table 4).
Table 3
Univariate analysis of risk factors affecting survival outcome

F, female; M, male; LCD, light chain disease; Hb, hemoglobin; Alb, albumin; Ca, calcium; Cr, creatinine.
![]()
Table 4
Multivariate analysis of risk factors affecting survival outcome

![]()
Immune cell population of patients with EMPs
Next, to identify the characteristics of the immune cell population in patients with EMPs, the frequency of CD4+ cells, CD8+ cells, M-MDSCs, and G-MDSCs in the peripheral blood of the patients who provided samples at diagnosis (n=16) were compared with those of consecutive patients with newly diagnosed MM without EMPs at diagnosis (control group; n=23). Data are presented as the mean±standard error of the mean (SEM), and t-tests were used to compare the continuous variables. Patients with EMPs showed a trend of increased frequency of M-MDSCs (0.71%±0.20% vs. 1.60%±0.52%, p=0.084) and G-MDSCs (0.16%±0.02% vs. 0.27%±0.09%, p=0.055) compared with those of the control group. The CD4+ cell frequency (28.58%±1.88% vs. 26.85%±3.95%, p=0.663) and CD8+ cell frequency (29.35%±2.31% vs. 31.36±3.02%, p=0.597) were not significantly different between the 2 groups (Fig. 3).
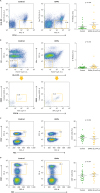 | Figure 3Comparison of immune cell populations between patients with newly diagnosed MM without EMPs (control group) and with EMPs (ELs+PLs). Frequencies of M-MDSCs (A), G-MDSCs (B), CD4+ T cells (C), and CD8+ T cells (D) were compared. Data (right panel) are presented as the mean±SEM, and t-tests were used to compare the continuous variables.
SEM, standard error of the mean.
|
DISCUSSION
This study described the clinical features of PLs and ELs of plasmacytomas at diagnosis, based on PET/CT imaging in patients with newly diagnosed symptomatic MM, and addressed their prognostic impact. Previously, we reported that 19.6% of patients with MM had EMPs at diagnosis, and patients with initial EMPs were more likely to have myeloma bone disease, compared to those without EMPs. The EMP group had a different distribution of myeloma isotypes (predominantly IgG), with more lambda light chain isotypes (10). In the present study, we observed a higher rate of HBD in patients with PLs than in those with ELs, whereas there was no difference in the distribution of myeloma isotypes. In addition, unfavorable laboratory features, such as higher calcium and LDH, advanced ISS, and higher percentages of BMPC, were observed in patients with ELs, compared to those in patients with PLs. Similar to previous data (10), the median OS and PFS for all patients with EMPs at diagnosis were 40.4 months and 14.5 months, respectively. An interesting finding in this analysis was the significant difference in prognosis for the 2 different types of EMPs. Patients with initial ELs showed a shorter PFS after 1st progression than those with PLs, which translated into poor OS, providing insight into the different biological effect of ELs. Further investigations on the mechanisms involved in the tumor clone with drug resistance are needed.
PET/CT is an optimal imaging tool to evaluate the disease activity of the skeletal system, detect extraosseous involvement, assess patients with non-secretory myeloma, and evaluate therapy response visually and semi-quantitatively (6). Although the IMWG and National Comprehensive Cancer Network guidelines do not recommend the routine use of PET/CT for initial staging of MM (511), the IMWG does recommend PET/CT for detecting EMPs, given that it has been shown to detect more sites of disease than focused MRI does in 30% of patients (51213). A meta-analysis of 14 studies, which included only 2 studies on isolated EMM, showed that PET/CT had a sensitivity of 96% and a specificity of 77.8% for detecting EMPs, which were higher than those for detecting intramedullary lesions (14). Recently, Tirumani et al. (15) described PET/CT findings in EMPs present at diagnosis (n=12) and during disease progression (n=23) and determined the correlation between the PET/CT findings and the disease outcome. In their study, any involvement of the liver, lung, and/or muscle away from bones was associated with significantly shorter survival, whereas EMPs occurring as a direct extension of osseous disease and those with involvement of nodes or the peritoneum/mesentery did not show survival differences (15). This was not consistent with our data, which showed that the patients with initial ELs had a shorter OS than those with PLs. Although our study has strengths (i.e., it only included EMPs at diagnosis and not during disease progression, and all patients were treated in the era of novel agents), further study in a larger sample size is required to confirm the prognostic difference between ELs and PLs.
With the regard to the extramedullary spread of MM, several possible mechanisms have been suggested, such as the decreased expression of adhesion molecules (e.g., VLA-4, CD44, and P-selectin) by impairing the adherence of myeloma cells to the BM endothelium (16); decreased expression of chemokine receptors CCR1, CCR2, and CXCR4 (17); and down regulation of tetraspanin expression (18). Many genes involved in angiogenesis (19) and mutations in the alternative or classical NF-kB pathway (20) were also reported as being linked to increased disease dissemination. Although these are preliminary data, we observed a trend toward distinct patterns of immune cell population, such as M-MDSCs and G-MDSCs, between patients with and without EMPs, suggesting that microenvironmental interactions appear to be important in extramedullary spread. However, whether these mechanisms are linked to both PLs and ELs remains to be determined.
Our finding of initial ELs being associated with a shorter PFS after 1st progression and poor OS compared to PLs may be important for identifying which patients benefit more from combination approaches that incorporate consolidation and possible maintenance. Currently, no standard therapeutic approach exists to treat patients with myeloma who present with EMPs, and the efficacy of chemotherapy in newly diagnosed MM with EMPs is poorly studied. Novel agents and drug combinations have been tested in the relapse setting, but there are still ongoing debates regarding the optimum treatment at diagnosis (221). In our previous study investigating survival outcomes according to the presence of EMPs at diagnosis, we suggested that ASCT can overcome the negative impact of EMPs and highlighted the potential efficacy of bortezomib on EMPs in the non-transplant setting. However, we performed the present study to address the unsolved clinical question on whether there is a different clinical pattern and outcome between ELs and PLs.
In conclusion, our results demonstrated the different clinical features and outcomes of ELs and PLs of plasmacytomas in newly diagnosed MM. The patients with initial ELs showed a shorter PFS after 1st progression than those with PLs did, which translated into poor OS, providing insight into the different biological effect of ELs. Further studies into the pathophysiology and new treatment strategies in MM with ELs will be needed to overcome the negative impact of ELs and result in an improvement of survival outcomes.
 XML Download