

 PDF
PDF ePub
ePub Citation
 Print
Print


INTRODUCTION
Solid organ transplantation is the best therapeutic option for end-stage organ failure. Due to antigenic differences, allogeneic organ transplantation induces immune responses against the graft, necessitating the application of immunosuppressants to prevent graft rejection. However, some grafts are rejected by physiological immune responses of the recipients even under the use of immunosuppressants (1). On the contrary, a few recipients acquire operational tolerance against the allogeneic graft and can terminate the immunosuppressants (2). To elucidate how to acquire immunological tolerance and avoid rejection against the graft is the fundamental goal for solid organ transplantation. Using biomarkers as prediction tools or therapeutic indicators not only in rejection situation but also in immunological tolerance can be a valuable strategy in transplantation. If we detect biomarkers of acute rejection (AR), we may try to prevent the ongoing rejection with timely interventions. In addition, the biomarker molecule can possibly be a target for developing more specific immunosuppressant (3). If we identify biomarkers of transplantation tolerance (TOL), we may terminate immunosuppressant administration and avoid side effects such as opportunistic infections. In addition, a method for enhancing the physiological function of the biomarker molecules can be a promising tolerance induction strategy (4). In these ways, identifying transplantation biomarkers may contribute to personalized medicine and development of novel therapeutics.
Recently, Khatri et al. (5) reported 11 genes that were significantly overexpressed in AR in human allogeneic transplantations across four solid organs. They utilized and evaluated 8 independent gene expression studies of organ biopsy specimens from liver, kidney, lung, and heart transplant patients. Using meta-analysis approaches, they were able to identify genes specifically overexpressed in AR. On the other hand, Baron et al. (6) sought to distinguish biomarkers for tolerance following human allogeneic kidney transplantation. At first, they could not identify overlapping gene signatures among 5 independent microarray data studied on blood of tolerant groups (7891011). At that point, they adopted meta-analysis strategy used by Khatri et al. (5). Through the meta-analysis by integration of 5 datasets, they successfully identified a common gene signature consisting of the top-20 tolerance biomarkers.
Medical phenomena or body reaction after therapeutic intervention like solid organ transplantation are not induced by a single cause but rather the sum of complex biological and molecular dynamics (12). To shed light on the pathological reason and genetic susceptibility of certain condition, it is important to investigate and comprehend the network of each molecules as well as the meaning of integral cellular behaviors instead of traditional methods using a single gene perturbation analysis (131415). To identify the signature gene sets which can drive the molecular cascade as well as pathway analyses with systems biology approach are the recent bioinformatics tools for this specific purpose, leading to a hidden insight into specific biological phenomena (1617). Especially, due to the production of high-throughput data, it is highly critical for traditional biologists to analyze these massive data as well as to lead the meaningful experimental hypothesis. By identifying specific signature genes enriched in 2 opposite immunologic results, we could find implications for preventing acute rejection and inducing transplantation tolerance.
In this study, we comparatively analyzed the published transplantation studies of 2 opposite consequences, rejection and tolerance, using the ranked scoring system. Instead of simple comparison of gene lists, we conducted the comprehensive integrated meta-analysis using 1,252 public available gene expression data as well as gene-set enrichment pathway analysis of signature genes obtained from the current study. In this context, the primary objective of our study is to identify and to suggest the signature gene groups indicative of tolerance and acute rejection.
MATERIALS AND METHODS
Principal Component Analysis (PCA) and bioinformatical tools
Acute rejection (AR) and operational tolerance (TOL) information were taken from public available database, Gene Expression Omnibus (GEO) microarray datasets. In AR condition, heart (GSE4470, GSE2596, GSE9377), kidney (GDS724, GSE9493), liver (GSE13440), and lung (GSE6095) datasets were used to analyze the expression pattern of AR. In TOL condition, kidney (GSE14655, GSE22229, GSE22707K, GSE47755) and liver (GSE22707L) were used to examine the gene expression pattern compared with stable condition after transplantation. We filtered GEO information to select the stable (STA), AR, and TOL groups. Next, we modified the datasets by our previously reported paper (18). Briefly, quantile normalization, PCA, MDS, and heat-map visualization were conducted by the R 3.4 program (R Project, Vienna, Austria). The visualization form of PCA and heat-map referenced the previously reported paper (18). Adobe Illustrator CS6 (Adobe Systems Inc., San Jose, CA, USA) was used to draw a summary figure.
Scoring system development for identification of the signature genes
To identify the signature genes across the different organs, we developed the scoring system. In principle, number of overlap genes that were involved in up-regulated genes or down-regulated genes in AR or TOL were marked score. Each gene has different maximum score following the microarray platform of GEO series (GSE) information because each GSE dataset used the different microarray chip. Then, the maximum score each gene can get is considered as the base score. “Score divided by base score (score/base score)” was used to validate the score rank. In this study, genes in condition of score ≥2, score/base score >0.5 were selected to be the signature genes. In AR group, 53 up-regulated signature genes were selected from 1,049 total differentially expressed genes (DEGs) list and 32 down-regulated signature genes were selected from 1,107 DEGs list. In TOL group, 110 up-regulated signature genes were selected from 920 DEGs and 48 down-regulated signature genes were selected from 1,004 DEGs list, respectively.
Pathway analysis with gene-set enrichment analysis
We applied several gene-set association analysis tools. Well-known database libraries such as ChIP Enrichment Analysis (ChEA) (19), Encyclopedia of DNA Elements (ENCODE) Transcription Factor ChIP-seq, ENCODE and ChEA consensus Transcription Factors, TargetScan microRNA, Kyoto Encyclopedia of Genes and Genomes (KEGG) 2016, Reactome 2016, BioCarta 2016, Wiki Pathways 2016, Protein-Protein Interaction (PPI) hub proteins, Human gene atlas, National Cancer Institute (NCI)-Nature 2016, and Gene Ontology (GO) tools were used initially for the pilot screening analysis. Application of these methods led us to find integrative insights into molecular pathways as well as gene ontologies and transcription factors. Gene-set enrichment analyses of 2 different gene lists (AR and TOL) were performed independently.
Statistical analysis of gene-set enrichment analysis
For enrichment analysis in this study, we applied the standard method of the Fisher exact test used in other common bioinformatics analysis studies (20). In general, the Fisher exact test is a proportion test that compares every possible event and expected linked events. The proportions of the query input list of overexpressed genes involved in the specific lists in the gene set libraries were calculated. This proportion is considered as a key factor in the bioinformatics computation. If a query input list has higher proportion with a list of specific gene set library compared to random query input lists, more likely statistical p-value in the list of specific gene library is projected to be lower, leading to a meaningful inference. The enriched pathway or term was considered as a significant pathway by calculated p-value under 0.05. We visualized GO molecular function and PPI hub proteins using Network2Canvas tools (Icahn School of Medicine at Mount Sinai, New York, NY, USA) (20).
RESULTS
Global data overview of total gene sets in AR and TOL groups
To check an overall expression of GEO information related with AR and TOL condition, we conducted PCA and heat-map visualization. First, we separated AR and TOL database into specific conditions sorted by official gene symbol ID. Since the platform of each transcriptome database uses different gene sets, for the precise comparison, we needed to make the composite dataset for each condition. We used the overlapped gene sets shared by every database set of each condition for the global comparison. After filtering, we obtained total 2,269 AR common genes across platforms and 4,335 TOL genes across platforms for the later comparison. Intriguingly, PCA results indicated that dataset of both AR and TOL groups are significantly biased based on their technical conditions. (Fig. 1A, 1B, 1D, and 1E). We could find that the hypothetical intention of our experiment, the gap between STA and disease groups, are much smaller than the gap between each experimental condition, called the batch effect, based on PCA. To further investigation, we used heatmap to display the expression pattern in the AR and TOL specific genes. Heat-map results show that the inconsistent pattern in each disease condition that should have been highlighted. (Fig. 1C and 1F). This global overview leads us to make a different strategy to analyze AR and TOL information, meaning that DEGs were examined in each dataset comparison reducing batch effect. (Fig. 1G).
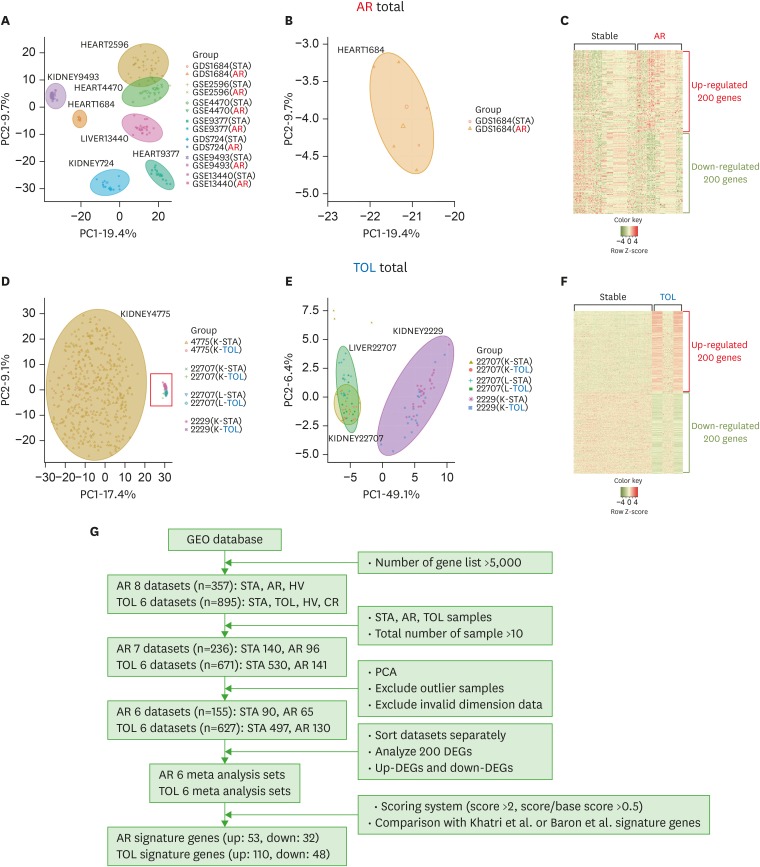
Figure 1
Global analysis of total AR and TOL groups with experimental strategy. (A) Global PCA results using 7 different microarray datasets related to AR. Each group made different clusters regardless of what condition they have. (B) A heart microarray dataset (GDS1684) shows wide spread global expression data and not well distinguished data clustering. It is excluded for later investigation. (C) Heat map visualization with AR global analysis. We selected only 200 genes in each direction (up-regulated and down-regulated). (D) Global PCA results using 4 different microarray datasets related to TOL. The datasets are significantly biased because of wide spreading patterns of kidney GSE4775 datasets. (E) Global PCA results without GSE4775 data. Each group made different clusters regardless of what condition they have. (F) Heat map visualization with TOL global analysis. We selected only 200 genes in each direction (up-regulated and down-regulated). (G) Comprehensive key experimental strategy features.
![]()
Meta-analysis of transcriptome expression of AR group compared with stable group
To identify the signature genes in the condition of AR, we compared the gene expression patterns of the different organs such as liver, kidney and heart defined as AR condition compared with stable condition after transplantation. PCA results show that the distinct clusters of STA and AR groups in every organ (Fig. 2A). It concluded that global gene expression data of AR condition are significantly different from the stable condition. The difference between expression pattern of AR and STA groups are more distinct than each individual difference. Heat-map visualization of DEGs displayed the noticeable expressional pattern of AR datasets compared with stable sets (Fig. 2B). We utilized these DEGs of each experimental set for later signature gene identification in condition of AR (Supplementary Table 1).
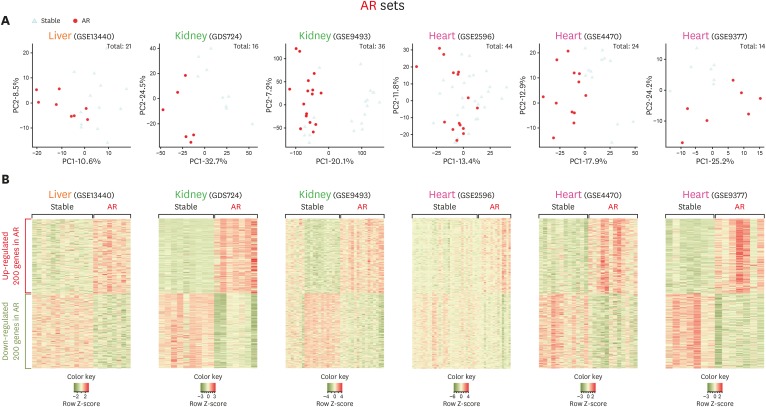
Figure 2
Analysis of PCA and Heatmap visualization of DEGs in AR group sets. (A) PCA analysis of AR microarray datasets obtained from GEO. The organ names of each data are shown at the top with GSE number. Stable condition is visualized in triangle and AR in circle. (B) Heatmap visualization of DEGs in AR group sets. We identified 200 up-regulated and 200 down-regulated genes in AR group.
![]()
Meta-analysis of transcriptome expression of TOL group compared with stable group
As we analyzed AR group, we compared the transcriptome data of TOL group with expression pattern of STA group. In this analysis, we used liver and kidney datasets while we utilized liver, kidney and heart datasets in AR transcriptome. PCA results show that STA and TOL groups were clearly distinguished (Fig. 3A). Intriguingly, kidney profiles containing the large dataset like GSE47755, the expression patterns of TOL group are centrally located compared with those of STA group. In heat-map visualization of 200 up-regulated genes and 200 down-regulated genes, we identified prominent expression pattern of TOL DEGs (Fig. 3B). We used the total 200 DEGs of each direction (up-regulated 200 and down-regulated 200) from each AR and TOL datasets (p<0.05) for identifying the signature genes using the scoring system (Supplementary Table 1).
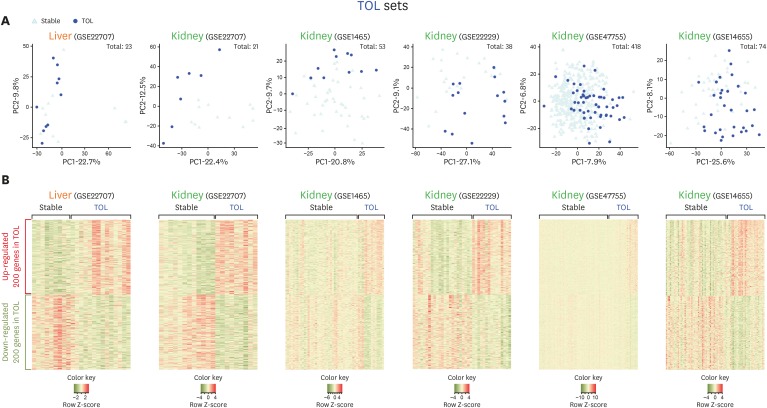
Figure 3
Analysis of PCA and Heatmap visualization of DEGs in TOL group sets. (A) PCA analysis of TOL microarray datasets obtained from GEO. The organ names of each data are shown at the top with GSE number. Stable condition is visualized in triangle and TOL in circle. (B) Heatmap visualization of DEGs in TOL group sets. We identified 200 up-regulated and 200 down-regulated genes in TOL group.
![]()
Scoring system for identifying the global signature genes in AR and TOL
To identify specific signature genes in AR and TOL conditions, we developed the ranked scoring system using overall DEGs in those conditions. Because of different microarray platforms used in meta-analysis, we cannot get consistent scoring system due to the absence of specific genes in a certain microarray platform. To overcome this, we used “base score” which is an identical score that each gene can get maximally. Then we divided the score of each gene by “base score” of each gene (Fig. 4A and 4B). “Score/base score” was used to validate the score rank (Supplementary Table 2). The signature genes were selected by condition of score ≥2 and score/base ≥0.5. In AR, 53 up-signature genes were selected by the scoring system and ISG20, CXCL9, CCL19, CXCL10, and FCER1G were marked as top 5 genes. Total 32 down-signature genes were filtered by scoring system and SORD, MAOA, CRYL1, IL13RA2, and Desmoplakin (DSP) were marked as top 5 genes. In TOL group, 110 up-signature genes were selected and TCL1A, BLNK, MS4A1, EBF1, and FCRL2 were marked as top 5 genes. In case of down-signature genes, 48 genes were selected and PFKFB3, F2RL1, SLC2A14, ANXA3, and SLC26A8 were marked as top 5 genes.
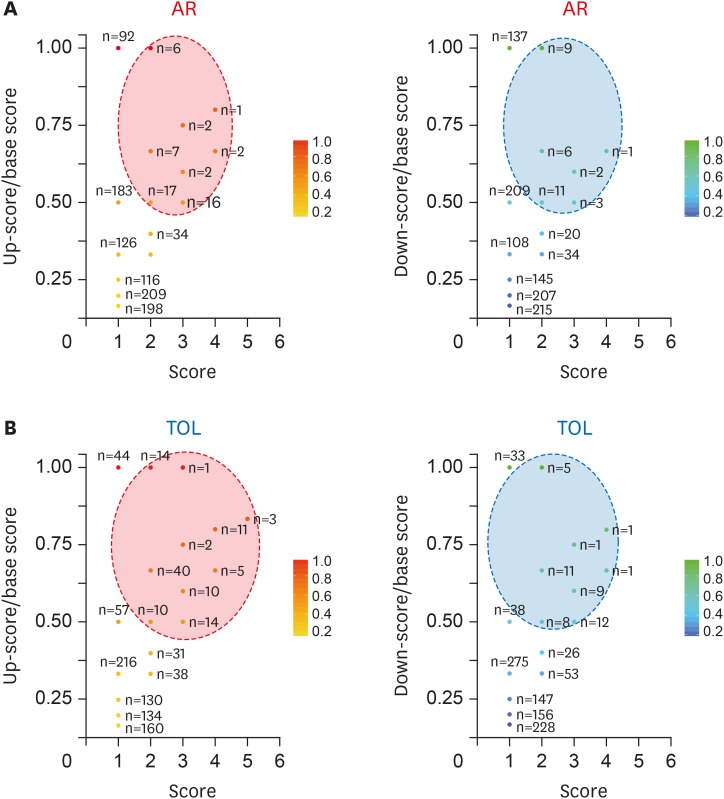
Figure 4
Scoring visualization of AR signature genes and TOL signature genes. (A) Scoring visualization of up-regulated and down-regulated signature genes in AR condition. (B) Scoring visualization of up-regulated and down-regulated signature genes in TOL condition.
Using DEGs of each datasets in AR, we identified the signature genes. Note X axis is a score, while Y is a ratio of up- and down-score/base score. Base score is determined by the total number of array sets containing a specific gene. Dashed circles are the boundary of the signature genes in each panel.
![]()
Expression pattern and validation of signature genes across organs
To validate the signature genes in AR or TOL group, we analyzed expression pattern of top 5 genes in heart and kidney datasets. In AR group, top 5 signature genes such as ISG20, CXCL9, CCL19, CXCL10, and FCER1G are up-regulated in heart (GSE4470 and GSE9377) datasets. Also, Top 5 signature genes displayed up-regulated expression pattern in overall kidney (GSE9493 and GDS724) datasets condition as well. We summarized the AR up-regulated signature gene list (score ≥3) with expression increase in each dataset (Fig. 5A).
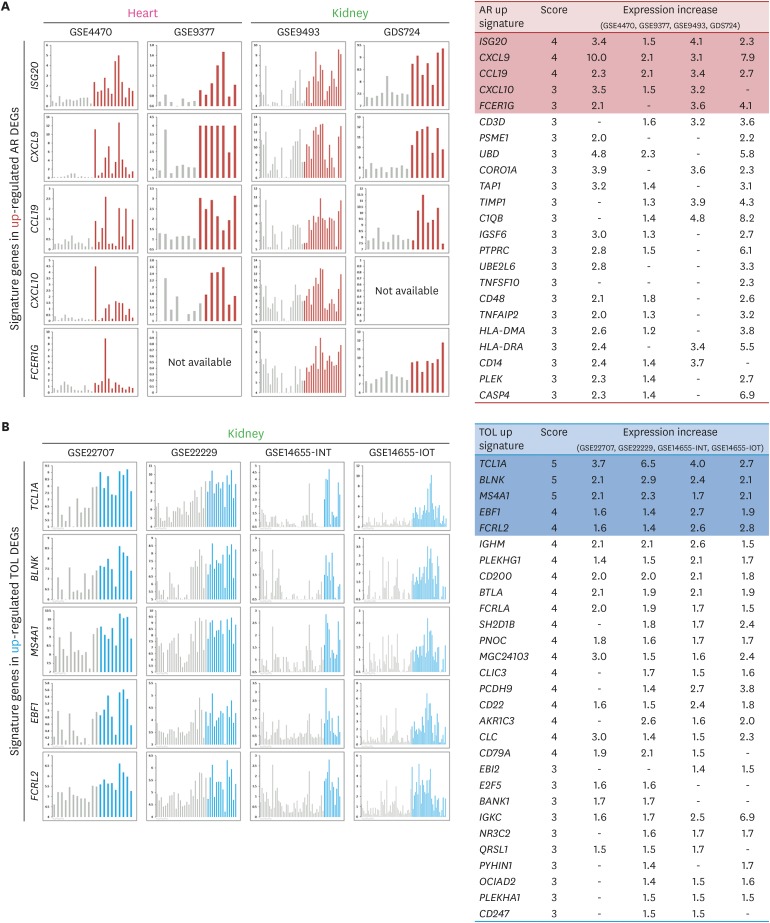
Figure 5
Expression pattern and validation of signature genes across organs. (A) Expression patterns of top 5 genes in the signature genes of AR condition. Table shows the global average expression level of the signature genes in AR sorted by score. (B) Expression patterns of top 5 genes in the signature genes of TOL condition. Table shows the global average expression level of the signature genes in TOL sorted by score.
![]()
In TOL group, top 5 signature genes (TCL1A, BLNK, MS4A1, EBF1, and FCRL2) were up-regulated in kidney (GSE22707, GSE22229, GSE14655-INT, GSE14655-IOT) datasets. We displayed the TOL up-signature gene list (score ≥3) and show the value of expression increase in each dataset (Fig. 5B).
DISCUSSION
In this study, we identified the signature genes in AR and TOL groups compared with normal STA group using 1,252 public available microarray databases (AR: 357 sets, TOL: 895 sets). Meta-analysis of these transplantation related gene sets leads us to specify the unique gene expression patterns in specific disease outcome. For the precise selection of signature genes, we adopted the ranked scoring systems and validate them in other public accessible experimental settings. These signature genes can be utilized as the biomarkers of a transplantation condition which can predict a potential therapeutic intervention.
Making composite datasets of different experimental settings failed to identify a strong association of signature genes because of large gap between each experimental setting. The fact that the gap between experimental hypothesis groups is significantly smaller than the gap between each individual experimental trial is comprehensively known by several other groups (56). It seems to be mainly because of that the experimental methods isolating transcriptome data are quite different from facility to facility as well as of that the collection of sampling varies not only how many hours after transplantation which can influence in the decay of transcriptome molecules, but also the health conditions or reaction tolerance of individual recipient patients (45621). It is important to note that in meta-analysis, the comprehension of the consistent experimental setting and reducing non-hypothesis related specific factors, so called batch effects, are the important parameters to make integration sets.
In case of identifying signature genes that represent the certain disease condition, it is significant that whether those signature genes are globally represent of all circumstantial disease condition or only represent under specific condition. The meaningfulness of the signature genes of medical conditions such as kidney transplantation is also important in terms of organ specific molecular reaction (8910). In our study, however, we are trying to configure the global signature genes in heart, liver and kidney. To overcome the difference between individual batch effects of each experiments, we adopted the ranked scoring system of making composite results in both AR and TOL conditions. The advantage of the scoring system is that it can reduce batch effects efficiently as well as it gives us the global landscape of signature genes (21). Our scoring system is based mainly on the gene sets of each microarray, leading certain genes to be skipped inevitably. To overcome this artefact, we normalized the scores of every signature genes by applying “base score.” This normalization gives not only the insight of global AR and TOL signature gene patterns but the consideration of specific organ condition as well.
After identifying the signature genes, researchers can investigate these genes more using the enrichment analysis (22). The enrichment analysis can decipher the hidden pathways which are strongly related with a query signature gene-set in term of an interaction network (Supplementary Figs. 1 and 2). Accompanying with the proper functional interpretation of gene-set, it is possible to deduce novel insight for the experimental purpose. However, the enrichment analysis is the computational and arithmetic tool, occasionally leading deviated, unconventionally enriched pathways. At the same time, certain pathway groups can be highlighted due to the small number of input driver genes, entailing careful and meticulous supervision. For example, only single gene can make the pathway significant in a specific enriched pathway, resulting in p-value under 0.05 because of unsupervised computational calculation. In this case, careful speculation after analysis is necessary to avoid misinterpretation.
When we apply the network analysis of opposite pathological conditions, we encounter the commonly involved genes or pathways such as B-cell receptor (BCR) pathways in Supplementary Fig. 1. The main meaning of the commonly involved genes or pathways in opposite conditions can be explained by 2 fundamental arguments. First, the enriched pathways do not have the specific direction (positively regulated or negatively regulated for later cascade). This infers that even though certain pathways are highlighted in both conditions, it may have a different outcome in downstream. In common network analysis, it is difficult to decide which direction the enriched pathway is, unless that is specifically notified as positive or negative. Second, there may have the common immunologic system which may be activated by every immune situation like acute rejection or operational tolerance, so called general immune reaction. Though common immunologic system seems to be enhanced by opposite triggering factors, opposite outcome like acute rejection or operational tolerance can happen if down-signaling cascades are finely tuned. In terms of immunological signaling pathway, within certain pathway, there can be several fine-tuned signaling possibilities, may result in totally opposite outcome.
If a certain gene is up-regulated in TOL condition, while the gene is also down-regulated in AR, that gene may have a critical role in driving tolerance condition. The opposite direction of our hypothesis also may give the insight to define an important gene in acute rejection. Applying that strategy in our current signature genes, we cannot find overlap genes up-regulated in AR as well as down-regulated in TOL. We found a gene called DSP is down-regulated in AR as well as up-regulated in TOL, which perfectly suits to our hypothesis. DSP (2324) is a critical protein in the desmosome structures in cardiac muscle and epidermal cells. Though desmosome has a key role in intercellular junction to link adjacent cells tightly, it needs further investigation why DSP is highly up-regulated in TOL circumstances.
Though the high expression of certain genes does not mean the genes are functionally critical in mechanism, to identify the signature genes have several advantages for finding alternative options of transplantation circumstance such as early prediction of rejection, early intervention of immune tolerant drugs, early cessation of them as well as prognostic prediction (2526). We believe that our current study, focused on the signature genes in different immunological circumstance, acute rejection and operational tolerance, will have a certain role in shedding light not only on the mechanistic insight but on the detection of biological markers regardless of their functional involvement.
Here, we identified specific signature gene sets concerned in 2 contrasting immunologic reaction using systems biology approach with bioinformatics tools. Further experimental investigation can elucidate important key players to reveal their exact integrative role in regulation of immune responses.
 XML Download