

 PDF
PDF ePub
ePub Citation
 Print
Print


INTRODUCTION
Although rheumatoid arthritis has been successfully managed by the adoptive transfer of CD4+CD25+ regulatory T cells (Tregs) [1], via heat shock protein (HSP)-mediated immune modulation [2], through an anti-CD28 monoclonal antibody (mAb) [3], and via HSP peptide mucosal immunization [4], the methods presented in previous studies lack defined specificity and may attenuate protective immune responses. The efficacy of human polyclonal CD4+CD25+CD127lo− regulatory T cells (127-Tregs) has been demonstrated in a humanized mouse model of atherosclerosis and in human clinical trials of type 1 diabetes [56], and they have also been proposed as a cell-based immunotherapeutic for rheumatoid arthritis [7], based on the claim that they exert a unique and robust immunosuppressive function enabling the extrinsic control of immune homeostasis and of autoimmunity [8].
However, naïve CD4+CD25+CD45RA+ regulatory T cells (45RA-Tregs) have been advocated as the Tregs of choice for isolation [9] and expansion [10], due to their homogenous expansion and epigenetic stability upon repetitive stimulation [11], in contrast to 127-Tregs. These properties help avoid the isolation of FoxP3+ non-Treg cells. Furthermore, Fritzsching et al. [12] demonstrated that CD45RA+ Treg cells were resistant to CD95L-mediated apoptosis, whereas CD45RA− Treg cells rapidly died after activation. Nonetheless, success of the adoptive transfer of ex vivo expanded thymus-derived regulatory T cells (tTregs) in autoimmune diseases depends more on serendipity rather than on deliberate design, and astronomically huge numbers of Tregs may have to be infused [13].
Therefore, developing a sophisticated strategy for generating antigen-specific Tregs with enhanced specific activity in the target tissue is imperative [14]. Indeed, tTregs specific for defined antigens can be deliberately tailored and may efficiently suppress a polyclonal autoreactive response, especially because the potential for bystander suppression and infectious tolerance [15] can be expected even in the absence of long-term survival of the transferred cells [16].
Periodontal infections have been proposed as a contributing factor to the aggravation of autoimmune diseases such as rheumatoid arthritis [1718], and it has been suggested that an HSP of Porphyromonas gingivalis (P. gingivalis) is a target molecule in the molecular mimicry of infection-triggered rheumatoid arthritis [17]. HSP60 is an appealing target for antigenic mimicry or epitope spreading because it is upregulated and expressed exclusively at sites of inflammation [4]. It can meet the criteria of bystander antigens for antigen-specific immunotherapy through the induction of bystander suppression.
Of particular interest, peptide 19 of P. gingivalis HSP60 (Pep19: TLVVNRLRGSLKICAVKAPG) has been reported as an immunodominant T-cell epitope and cross-reactive B-cell epitope in the periodontitis-atherosclerosis axis [192021]. It is predominantly recognized by the sera of patients with autoimmune diseases [21], and is a potent proatherogenic molecule in infection-triggered atherosclerosis because it upregulates the distinct signaling molecules interferon gamma (IFN-γ and T-bet mRNA for Th1 polarization [22]. The anti-Pep19 mAb is preferentially localized at the site of inflammation in periodontitis and atherosclerotic lesions. Sequential epitope spreading was provoked by Pep19 to peptide 19 of human HSP60 (Hu19) in most healthy human subjects, and to peptide 9 of human HSP60 (Hu9) and to oxidized low-density lipoprotein (ox-LDL) in P. gingivalis-induced chronic periodontitis and atherosclerosis in mice [23]. These findings are strengthened further by our recent publication demonstrating that Pep19 is a potent inducer of the monocyte-mediated oxidation of LDL [24]. Based on the totality of these findings, Pep19 can be proposed as a molecular target for epitope-specific tTreg-based immunotherapeutics for the suppression of infection-triggered autoimmune diseases.
The present study was designed to compare ex vivo expanded peptide 19-specific 127-Tregs (Pep19-127-Tregs) and peptide 19-specific 45RA-Tregs (Pep19-45RA-Tregs) relevant to in vitro suppressive phenotypic markers and in vivo suppression of collagen-induced arthritis when these cells were adoptively transferred into humanized mice.
MATERIALS AND METHODS
Study subjects
Four generally healthy adult male subjects participated in a peripheral blood donor program resulting in a total of 160 mL of blood from each subject: 100 mL from subjects 1 and 2 for the generation of human 127-Tregs from their peripheral blood lymphocytes (PBLs), 100 mL from subjects 3 and 4 for the generation of 45RA-Tregs from their PBLs, an additional 30 mL from subjects 1–4 for the isolation of total PBLs, and an additional 30 mL from subjects 1–4 for the generation of CD14+ dendritic cells (DCs) from peripheral blood monocytes at each different occasion. The study protocol was approved by the Institutional Review Board of Pusan National University Hospital (approval No. PNUDH-2017-003). Human and animal experimental procedures were undertaken in accordance with the Helsinki Declaration. All the participants were informed of the study scope and procedures and signed written informed consent forms were obtained before the initiation of the study.
Construction of synthetic peptides
Of 37 overlapping peptides spanning the entire HSP60 sequence of P. gingivalis and mammalian HSP60, the following peptides were synthesized by 9-fluorenylmethoxycarbonyl solid-phase peptide synthesis (Peptron Inc., Daejeon, Korea): Pep19 from P. gingivalis HSP60, and Hu9 (NPVEIRRGVMLAVDAVIAEL), peptide 14 (Hu14: ELEIIEGMKFDRGYISPYFI), and Hu19 (TLVLNRLKVGLQVVAVKAPG) from mammalian HSP60.
Isolation of 127-Tregs and 45RA-Tregs
Peripheral blood mononuclear cells (PBMCs) were isolated from up to 100 mL of peripheral blood via a Ficoll density gradient (GE Healthcare Bio-Sciences, Milwaukee, WI, USA) within 24 hours of blood collection. Buffy coats were processed for the purification of CD4+ T cells by means of a magnetically assisted sorting system (Miltenyi Biotec, Bergisch Gladbach, Germany). CD4+ T cells were stained with the following cocktail of mAbs used for flow cytometry (obtained from eBioscience, San Diego, CA, USA): cyanine 5 (Cy5)-anti-CD4, fluorescein isothiocyanate (FITC)-anti-CD25, phycoerythrin (PE)-anti-CD127, and PE-anti-CD45RA. The stained Tregs were sorted on the basis of the CD4+CD25+CD127lo− and CD4+CD25+CD45RA+ T-cell phenotypic markers on a BD FACSAria II high-speed cell sorter and were incubated in Optimizer CTS T-cell Expansion SFM (Thermo Fisher Scientific Inc., Rockford, IL, USA) containing 2% heat-inactivated human serum (Sigma-Aldrich, St. Louis, MO, USA). The purity of the sorted Treg populations was 98.4% (range, 96.3%–99.6%).
Stimulation of 127-Tregs and 45RA-Tregs with Pep19-pulsed DCs in a tolerogenic milieu
Monocyte-derived DCs (MoDCs) were generated from CD14+ monocytes from PBMCs. Briefly, monocytes were purified by positive selection with an anti-CD14 antibody coupled to magnetic beads (Miltenyi Biotec). The isolated monocytes were treated with mitomycin C (50 μg/mL, Sigma-Aldrich) for 20 minutes at 37°C. To obtain immature DCs, the CD14+ cells were incubated for 5 days in the complete medium (Corning Inc., Corning, NY, USA) supplemented with 100 U/mL of penicillin, 100 μg/mL of streptomycin (Thermo Fisher Scientific Inc.), and 10% fetal bovine serum (FBS; Gibco, Grand Island, NY, USA) containing 50 ng/mL of granulocyte-monocyte colony-stimulating factor (R&D Systems, Minneapolis, MN, USA), 20 ng/mL of interleukin 4 (IL-4) (R&D Systems), and 20 ng/mL of transforming growth factor beta (TGF-β) (Invitrogen, Grand Island, NY, USA). The morphology of the DCs was examined by optical microscopy. On 5 days of DC culture, the immature MoDCs were washed extensively with Dulbecco phosphate buffered saline (PBS; Invitrogen), and pulsed with Pep19 (10 μg/mL) in a tolerogenic milieu for 5 hours via the addition of a cytokine cocktail consisting of IL-4, granulocyte-macrophage colony-stimulating factor (GM-CSF), TGF-β, and retinoic acid (1 μM, Sigma-Aldrich).
Stimulation of 127-Tregs and 45RA-Tregs with Pep19-pulsed DCs
To establish Pep19-specific Tregs, half of the 127-Tregs and 45RA-Tregs were stimulated with Pep19-pulsed DCs in the following manner. Tolerogenic DCs pulsed with Pep19 (10 μg/mL) were treated with mitomycin C (50 μg/mL) and in vitro co-cultured with half of the 2 sets of responder Tregs via the addition of TGF-β (20 ng/mL, R&D Systems) and exogenous IL-2 (rhIL-2; 20 ng/mL, BD Biosciences, San Jose, CA, USA) in 96-well round-bottom plates (Corning Inc.) for 5 days in the tolerogenic milieu. The resultant Pep19-127-Tregs and Pep19-45RA-Tregs, along with the unstimulated remaining half of the 127-Tregs and 45RA-Tregs, were subject to ex vivo expansion for 2 weeks according to the following expansion scheme.
Ex vivo expansion of Tregs
Nonspecific 127-Tregs, 45RA-Tregs, Pep19-127-Tregs, and Pep19-45RA-Tregs were respectively plated at 2×10⁴ Tregs per well in a 96-well plate (SPL Life Sciences, Pocheon, Korea) and activated with Dynabeads (anti-CD3/anti-CD28-coated microbeads, Life Technologies, Carlsbad, CA, USA) at a bead-to-cell ratio of 2:1. On day 2, the culture medium was supplemented with a high dose of rhIL-2 (20 ng/mL, R&D Systems) and rapamycin (1 nM, Sigma-Aldrich). Rapamycin was added for the first 5 days of culture. The cells were resuspended and incubated in a fresh medium containing rhIL-2 on days 3, 5, 7, 9, 12, 13, and 14. On day 7, the cells were re-stimulated with fresh anti-CD3/anti-CD28-coated beads at a 1:1 ratio. On day 14, the cells were debeaded using a MaxSep magnet.
Phenotypic, functional, and epigenetic analysis of the expanded Tregs
Evaluation of Treg phenotypic markers
The ex vivo expanded Tregs were counted and reanalyzed to investigate the expression of various markers, including CD4, CD25, and Foxp3, by fluorescence-activated cell sorting (FACS), on a BD FACSCalibur instrument after staining with mAb cocktails as described above. Foxp3 was stained with PE-conjugated antibodies purchased from eBioscience. The Cytofix/Cytoperm Kit (BD Biosciences) was used for intracellular staining. Staining procedures were performed in PBS containing 2% of fetal calf serum (FCS) and 1% of human immunoglobulin (Ig; Flebogamma, Grifols, Langen, Germany) to block nonspecific binding. To exclude dead cells, propidium iodide (PI) was added to unfixed samples.
A carboxyfluorescein diacetate succinimidyl ester (CFSE)-based in vitro suppression assay to bystander antigens
Human CD4+CD25− effector T cells (Teffs) were FACS-isolated from autologous PBLs and stained with 5 μM CFSE (Invitrogen) in dimethyl sulfoxide for 10 minutes at 37°C. The cells were incubated in an RPMI 1640 medium containing 10% FBS for 15 minutes at 4°C, centrifuged, and washed twice with PBS. CFSE-labeled autologous human CD4+CD25− Teffs (2×10⁵ cells) were incubated with each expanded Treg (2×10⁵ cells), followed by stimulation in U-bottom plates with various bacterial and bystander self-antigens: Pep19, Hu19, Hu9, Hu14 (10 µg/mL), or ox-LDL (4 µg/mL). We excluded type II collagen in the suppression assay because we limited our analysis to those self-antigens for which epitope spreading was identified in our previous study [23]. T-cell-depleted PBLs were added as antigen-presenting cells (APCs) after treatment with mitomycin C (50 μg/mL). In vitro suppression assays were performed in RPMI 1640 (Corning Inc.) medium supplemented with 5 mM HEPES, 2 mM L-glutamine, 100 U/mL of penicillin, 100 g/mL of streptomycin, 50 mM 2-mercaptoethanol (Invitrogen), 5 mM nonessential amino acids, 5 mM sodium pyruvate (Mediatech, Manassas, VA, USA), and 10% FBS (Gibco). After 4 days of incubation, the sorted CD4+CD25− Teffs were stained with a PE-Cy5-conjugated anti-CD4 mAb for flow cytometric analysis.
Treg proliferation to Pep19 and bystander antigens
Each set of expanded Pep19-127-Tregs and Pep19-45RA-Tregs was incubated with Pep19 and various bystander self-antigens (Hu19, Hu9, Hu14, or ox-LDL) at a concentration of 10 μg/mL or 4 μg/mL. T-cell-depleted PBLs were added as APCs after treatment with mitomycin C as described above. After 4 days of incubation, Tregs were stained with a PE-Cy5-conjugated anti-CD4 mAb for flow cytometric analysis.
Expression of the homing receptors CCR7 and CD62L
Each set of expanded Tregs was examined for the expression of CD62L and CCR7 by staining with a PE-Cy5-labeled anti-CD4 mAb, an FITC-labeled anti-CCR7 mAb (BD Bioscience), and a PE-labeled anti-CD62L mAb (eBioscience) on the BD FACSCalibur instrument after staining with mAb cocktails as described above.
Evaluation of CD95L-mediated apoptosis
For apoptosis induction, each set of expanded Tregs was stimulated with 100 μg/mL of anti-CD95 mAb and 1/10 diluent of CD95L for 24 hours. Unstimulated cells were incubated with a CD95L-free control medium. Cell death was assessed by annexin V/PI costaining (eBioscience).
Epigenetic analysis of the Treg-specific demethylation region (TSDR)
Genomic DNA was extracted from 1×10⁶ expanded Tregs using a DNeasy Blood & Tissue Kit (Qiagen, Hilden, Germany), according to the manufacturer's instructions. The extracted DNA was methylated according to the manual (Imprint DNA Modification Kit, Sigma-Aldrich). DNA demethylation of the TSDR was analyzed using Cosmo Genetech (Seoul, Korea) according to the standard protocol. The percentage of demethylated TSDR was calculated as follows:
TSDR=[mean copy number of non-methylated DNA/(mean copy number of non-methylated DNA+copy number of methylated DNA)]×100
Adoptive transfer of human Tregs into NOD/scid/IL-2Rγ−/− mice
Prior to the adoptive transfer, Tregs were debeaded by washing them out completely from expander beads using a magnetic field and placed in RPMI 1640 with 10% autologous plasma without rhIL-2. After 3 days of resting, the cells were washed out again and resuspended in 250 mL of PBS. Nine NOD/scid/IL-2Rγ−/− mice (6 weeks old, males, purchased from The Jackson Laboratory, Bar Harbor, ME, USA) were reconstituted with donor human PBLs (1×10⁷ cells) via tail vein injection. The mice in group I (n=5) received an adoptive transfer of human PBLs only, without the induction of arthritis, and served as the negative control group. The mice in group II (n=5) were infused with 1×10⁶ Pep19-127-Treg cells, and the mice in group V (n=5) were infused with the same amount of Pep19-45RA-Tregs. The group II and III mice were subjected to Pep19-immunization along with P. gingivalis infection, followed by the induction of arthritis by the injection of type II collagen. We excluded 127-Treg and 45RA-Tregs from the adoptive transfer experiment as these Tregs had not expanded enough in number to be available for adoptive transfer after several rounds of in vitro experiments.
Induction of collagen-induced arthritis
All mice (n=15) were immunized subcutaneously with Pep19 in alum and challenged orally with P. gingivalis in 2% carboxymethyl cellulose 3 times per week for a period of 3 weeks. The mice in group 1 (n=5) were not subjected to the induction of arthritis and served as the negative control. At the commencement of bacterial infection, collagen-induced arthritis was induced in the mice in groups II and III (n=5 per group). Briefly, 100 μg of bovine type II collagen (Chondrex, Redmond, WA, USA) dissolved in 0.1 M acetic acid was emulsified with an equal volume of Freund's complete adjuvant (Sigma-Aldrich). Mice were sensitized by an intradermal injection at the tail base, and bovine type II collagen and Freund's incomplete adjuvant was administered in the same manner 18 days later. Three weeks following the booster injection, all the mice were euthanized by CO2 for the collection of specimens and sera.
Evaluation of the in vivo suppression of arthritis
Whole knee joints from mice were dissected and fixed in 4% paraformaldehyde, decalcified in 10% EDTA, dehydrated, and embedded in paraffin blocks. Slices were stained with hematoxylin and eosin for the assessment of joint inflammation. The severity of arthritis was scored on a scale of 0 to 3: 0=normal; 1=minimal synovial inflammation, with cartilage and bone erosion limited to discrete foci; 2=synovial inflammation and moderate erosion, with normal intact joint architecture; and 3=severe inflammation and severe erosion, with disrupted joint architecture. To estimate whether infused Tregs could ameliorate cartilage destruction, we quantitatively evaluated the degree of proteoglycan depletion by safranin-O staining of articular cartilage. The immunohistochemical localization of CD4+CD25+ Tregs in the arthritic lesions were estimated by staining the specimens with mouse anti-human mAbs to human CD4+ and CD25+ (eBioscience). Clinical disease severity was assessed by quantifying changes in paw thickness. Mouse survival was also assessed in each group during the experimental period.
Expression of Treg markers by splenic Tregs
Splenic CD4+ T cells isolated from each mouse group were incubated respectively with Pep19 and the bystander self-antigens Hu19, Hu9 (10 μg/mL), or ox-LDL (4 μg/mL). T-cell-depleted PBLs were added as APCs after treatment with mitomycin C. After 4 days of incubation, Tregs were stained with an FITC-conjugated anti-CD25 mAb. The T cells were also permeabilized for intracellular staining with PE-conjugated Foxp3 mAb as described above.
RESULTS
The number of ex vivo expanded Tregs
Only 4 healthy subjects were included in the study because a relatively large amount of peripheral blood had to be drawn by venipuncture; 2 of the subjects had samples drawn for the isolation and expansion of 127-Tregs, while the samples from the other 2 subjects were used for 45RA-Tregs. Therefore, all the data were analyzed using descriptive statistics. Half of these 2 subpopulations (i.e., 127-Tregs and 45RA-Tregs) were subject to 2 weeks of ex vivo expansion, while the remaining half were stimulated with Pep19-pulsed DCs to establish Pep19-127-Tregs and Pep19-45RA-Tregs followed by 2 weeks of ex vivo expansion.
The starting number of the freshly isolated Tregs from subjects 1–4, the final number after 2 weeks of ex vivo expansion, and the fold increase are summarized in Table 1. The 45RA-Tregs showed a slightly greater proliferative potential than the 127-Tregs. This tendency was much more pronounced for Pep19-45RA-Tregs than for Pep19-127-Tregs (Table 1).
Table 1
Initial numbers, ex vivo expanded numbers, and fold increase of each Treg subpopulation from study subjects

Treg: regulatory T cell, Pep19: peptide 19, 127-Tregs: CD4+CD25+CD127lo− regulatory T cells, 45RA-Tregs: CD4+CD25+CD45RA+ regulatory T cells.
![]()
Phenotypic and functional analysis of the expanded Tregs
Treg phenotypic markers in the expanded Tregs
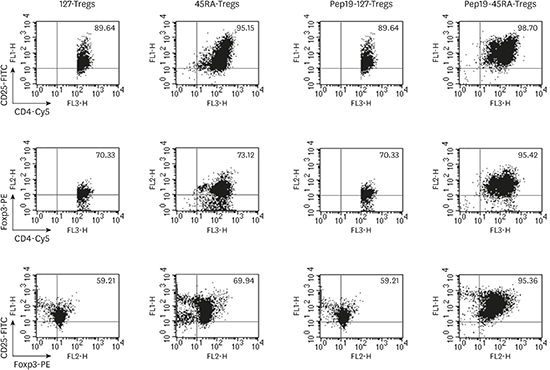
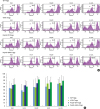
When the expanded Tregs were analyzed for the expression of the suppressive Treg markers CD4, CD25, and Foxp3 by FACS, a similar staining intensity was observed among the 127-Tregs, 45RA-Tregs, and Pep19-127-Tregs. The highest intensity of these markers was seen in the Pep19-45RA-Tregs (Figure 1).
 | Figure 1Fluorescence-activated cell sorting profiles of each representative subject demonstrating the expression of suppressive Treg markers — CD4, CD25, and Foxp3 — in ex vivo expanded 127-Tregs, 45RA-Tregs, Pep19-127-Tregs, and Pep19-45RA-Tregs. While a similar staining intensity was observed among 127-Tregs, 45RA-Tregs, and Pep19-127-Tregs, the highest intensity of these 3 phenotype markers was seen in Pep19-45RA-Tregs.
Treg: regulatory T cell, Pep19: peptide 19, 127-Tregs: CD4+CD25+CD127lo− regulatory T cells, 45RA-Tregs: CD4+CD25+CD45RA+ regulatory T cells, Cy5: cyanine 5.
|
Expression of the homing receptors CCR7 and CD62L
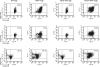
When the intensity of CD62L and CCR7 expression was compared among the expanded Tregs, a slightly greater intensity was found in 127-Tregs and Pep19-127-Tregs than in 45RA-Tregs or Pep19-45RA-Tregs (Figure 2).
 | Figure 2Fluorescence-activated cell sorting profiles of CD62L and CCR7 expression in the expanded Tregs of each representative subject. While 45RA-Tregs and Pep19-45RA-Tregs demonstrated a modest level of expression of CD62L and CCR7, 127-Tregs and Pep19-127-Tregs demonstrated a higher level of expression of these markers.
Treg: regulatory T cell, 127-Tregs: CD4+CD25+CD127lo− regulatory T cells, Pep19: peptide 19, 45RA-Tregs: CD4+CD25+CD45RA+ regulatory T cells, Cy5: cyanine 5.
|
The CFSE-based in vitro suppression assay
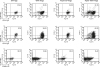
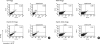
The proliferation of CD4+CD25− Teff subpopulations in response to Pep19 and various bystander self-antigens (Hu19, Hu9, or ox-LDL) was suppressed to a similar degree by the expanded Tregs, while the tendency for suppression was higher for the Pep19-45RA-Tregs (Figure 3). However, no statistically significant differences were found among the tested Treg subsets.
 | Figure 3(A) Fluorescence-activated cell sorting profiles demonstrating the suppressive capability of expanded 127-Tregs, 45RA-Tregs, Pep19-127-Tregs, and Pep19-45RA-Tregs from each representative subject on the Teff proliferative response to Pep19 and the bystander self-antigens Hu19, Hu9, Hu14, and ox-LDL, as analyzed by the CFSE assay. (B) Bar graph demonstration of the mean±standard deviation of the fluorescence-activated cell sorting profiles of all subjects. Suppression of the Teff proliferative response to Pep19 and the various bystander self-antigens was most evident in Pep19-45RA-Tregs.
127-Tregs: CD4+CD25+CD127lo− regulatory T cells, 45RA-Tregs: CD4+CD25+CD45RA+ regulatory T cells, Pep19: peptide 19, CFSE: carboxyfluorescein diacetate succinimidyl ester, Hu: human, ox-LDL: oxidized low-density lipoprotein, Teff: effector T cell.
|
Proliferation of the expanded Tregs in response to Pep19 and various bystander self-antigens
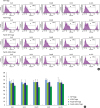
When the proliferative responses of each set of expanded Tregs to Pep19 and the tested bystander self-antigens were analyzed, Pep19-45RA-Tregs showed the highest proliferative response, whereas the other Tregs showed similar proliferative responses to the tested antigens (Figure 4). However, no statistically significant differences were found among the tested Treg subsets.
 | Figure 4(A) Fluorescence-activated cell sorting profiles of expanded 127-Tregs, 45RA-Tregs, Pep19-127-Tregs, and Pep19-45RA-Tregs from each representative subject demonstrating a robust proliferative responses to Pep19 and the bystander self-antigens Hu19, Hu9, Hu14, and ox-LDL. Bar graph demonstration of the mean±standard deviation of the fluorescence-activated cell sorting profiles of all subjects. (B) The proliferative response of Pep19-45RA-Tregs was more pronounced than that of the 3 other kinds of Tregs.
127-Tregs: CD4+CD25+CD127lo− regulatory T cells, 45RA-Tregs: CD4+CD25+CD45RA+ regulatory T cells, Pep19: peptide 19, Treg: regulatory T cell, CFSE: carboxyfluorescein diacetate succinimidyl ester, Hu: human, ox-LDL: oxidized low-density lipoprotein.
|
CD95L-mediated apoptosis
When resistance to CD95L-mediated apoptosis was compared among the expanded Tregs, substantial resistance was observed in 127-Tregs and Pep19-127-Tregs, while higher resistance was observed for 45RA-Tregs and Pep19-45RA-Tregs (Figure 5).
 | Figure 5Fluorescence-activated cell sorting profiles of CD95-mediated apoptosis in expanded Tregs of a representative subject after 24 hours of incubation. While 127-Tregs and Pep19-127-Tregs demonstrated a similar resistance to CD95L-mediated apoptosis, 45RA-Tregs and Pep19-45RA-Tregs exhibited slightly greater resistance.
Treg: regulatory T cell, 127-Tregs: CD4+CD25+CD127lo− regulatory T cells, Pep19: peptide 19, 45RA-Tregs: CD4+CD25+CD45RA+ regulatory T cells, PI: propidium iodide, PE: phycoerythrin, FITC: fluorescein isothiocyanate.
|
Epigenetic analysis of the TSDR of the expanded Tregs
The DNA methylation state of the TSDR remained similarly high in all the expanded Tregs, while the highest Foxp3 protein levels, as determined by FACS, were observed in Pep19-45RA-Tregs (Figure 6). The expression levels of Foxp3 were significantly higher in Pep19-45RA-Tregs than those of 45RA-Tregs and Pep19-127-Tregs (P<0.01) and that of 127-Tregs (P<0.001), while the methylation state of TSDR did not show statistically significant differences among the tested Treg subsets
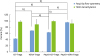 | Figure 6Bar graph representation of the percentage of expanded Tregs in a representative subject expressing the Foxp3 protein and the percent of DNA demethylation in the Foxp3 TSDR. While a similar degree of DNA demethylation in the Foxp3 TSDR was among the Treg groups, the intensity of Foxp3 expression was most pronounced in Pep19-45RA-Tregs.
Treg: regulatory T cell, TSDR: Treg-specific demethylation region, Pep19: peptide 19, 127-Tregs: CD4+CD25+CD127lo− regulatory T cells, 45RA-Tregs: CD4+CD25+CD45RA+ regulatory T cells.
Statistically significant value, a)P<0.01; b)P<0.001.
|
In vivo suppression of arthritis in humanized mice
When the severity of arthritis was scored on a scale of 0 to 3, the mean score±standard deviation of arthritis in groups I, II, and III was 0.6±0.89, 1.2±0.83, and 0.8±0.83, respectively. A lower score was seen in group III than in group II, though the difference did not reach statistical significance, and the severity of arthritis was comparable to the control group (Figure 7A). An analysis of histopathological images demonstrated that synovial hyperplasia, cartilage erosion, and bone abnormalities were more attenuated in group III than in group II. When we qualitatively evaluated the degree of proteoglycan depletion by safranin-O staining of articular cartilage, the homogenous area of cartilage staining substantially decreased in group II, but fully recovered in group III, to a level comparable to that of group I (Figure 7B). The immunohistochemical co-localization of CD4+CD25+ Tregs was most evident in the articular joints in group III (Figure 7C).
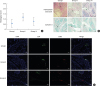 | Figure 7(A) Bar graph representation of the severity of arthritis score of each mouse group on a scale of 0 to 3. (B) The lowest score was seen in the group III mice, which were infused with Pep19-45RA-Tregs. Representative micrographs of articular joints and cartilage stained with hematoxylin and eosin and safranin-O staining of articular cartilage in mice from groups I–III (bar=10 µm). (C) No evidence of proteoglycan loss from articular cartilage (a marker of cartilage destruction) was observed in the mice in groups I and III. The group II mice demonstrated a variable degree of proteoglycan loss from the articular cartilage. Representative micrographs of the immunohistochemical localization of CD4+CD25+ Tregs in articular joints in groups I–III. The homing pattern of CD4+CD25+ Tregs to the site of inflammation was most pronounced in the articular joints in group III (bar=50 µm).
Pep19: peptide 19, 45RA-Tregs: CD4+CD25+CD45RA+ regulatory T cells, Treg: regulatory T cell.
|
The overall mean diameter±standard deviation of the swollen footpad in the surviving mice in groups I, II, and III was 1.1±0.02 cm, 1.23±0.07 cm, and 1.1±0.03 cm, respectively, on day 38 (Figure 8A and B). The inhibition of arthritis onset was observed at an earlier stage in group III than in group II. The overall mean diameter in group III at the day 38 was smaller than in group II, although the difference did not reach statistical significance, while it was significantly smaller than that of group I (control) mice (P<0.05) (Figure 8C). When the survival rates of the mice were calculated in each group during the 38 days of the observation period after the induction of arthritis, groups I, II, and III demonstrated survival rates of 90%, 90%, and 100%, respectively, 38 days after the induction of arthritis. The highest survival rate was observed in group III (Figure 8D).
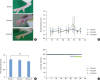 | Figure 8(A) Photographic features demonstrating swollen footpads in a representative mouse from each group. (B) Line graphs depicting the changes in the mean thickness of the swollen footpad at each observation period. (C) Bar graph representing the mean paw thickness (±standard deviation) of each mouse group on day 38. Mice from both groups II and III showed minimal thickness, while the group I mice demonstrated greatest thickness. The value was significantly smaller in group III when compared with that of group I. (D) A diagrammatic plot of the mean survival rate of each mouse group during the observation period. The highest survival rate was seen in the group III mice.
a)Statistically significant value (P<0.05).
|
Expression of Treg markers by splenic Tregs
When the expression of Treg markers CD25 and Foxp3 by splenic CD4+ T cells isolated from mice from groups I–III in response to Pep19 and bystander antigens Hu19, Hu9, Hu14, and ox-LDL was evaluated, these markers were variably expressed in response to the tested antigens in all 3 groups (Figure 9A and B). Statistically significant differences at variable levels (P<0.05, P<0.01, P<0.001, respectively) were found in the expression of Treg markers in response to the tested antigens among the tested mouse groups, except for the cognate epitope spreader antigen Pep19.
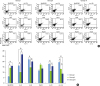 | Figure 9(A) Expression of the Treg markers CD25 and Foxp3 by splenic CD4+ T cells isolated from a representative mouse from each group (I–III) in response to HSP60 from P. gingivalis, Pep19, Hu19, Hu9, Hu14, and ox-LDL as analyzed by fluorescence-activated cell sorting. (B) These Treg markers were variably expressed in response to the tested antigens in all 3 groups. Bar graph representation of the fluorescence-activated cell sorting profiles of CD25+Foxp3+ splenic Tregs in response to various bystander antigens. Statistically significant differences were noted at variable levels among the test groups except for the cognate epitope spreader antigen Pep19.
Treg: regulatory T cell, Pep19: peptide 19, Hu19: peptide 19 of human HSP60, Hu9: peptide 9 of human HSP60, Hu14: peptide 14 of human HSP60, ox-LDL: oxidized low-density lipoprotein.
Statistically significant value, a)P<0.05; b)P<0.01; c)P<0.001.
|
DISCUSSION
Rheumatoid arthritis is an autoimmune disorder characterized by chronic inflammation of the synovial membrane and painful joints, resulting in an accumulation of inflammatory cells that leads to synovitis and articular cartilage destruction [25]. Although the main cause is homeostatic failure of self-tolerance by autoreactive T cells [7], the autoantigens involved in rheumatoid arthritis remain unidentified. Various therapeutic strategies have been proposed, including anti-cytokine or anti-CD3 therapy; stem cell therapy; and Treg-based therapy [26], aimed at restoring the immune homeostasis balanced by Tregs and Teffs. However, no researchers are known to have attempted the adoptive transfer of antigen-specific CD4+CD25+CD127lo− or CD4+CD25+CD45RA− Tregs for the suppression of arthritis in humanized mice. Therefore, the present study is novel because we deliberately stimulated polyclonal or naïve tTregs with a putative epitope spreader, Pep19 from P. gingivalis HSP60 [23]. Pep19 in particular, which is capable of inducing immunological tolerance, has been proposed to offer an attractive strategy for antigen-tailored Treg-based immunotherapy against infection-triggered rheumatoid arthritis. Furthermore, we utilized a humanized mouse model of collagen-induced arthritis for infusion of the activated human Tregs.
The design of this study was based on the following premises. One was that Treg-based immunotherapeutics comprise one of the next pillars of medicine, aimed at restoring the immune homeostasis balanced by Tregs and Teffs [21], and currently constitute an appealing strategy for the suppression of autoimmune diseases and the prevention of transplantation rejection [81527]. The other was that an HSPs is a target molecule in the molecular mimicry of infection-triggered autoimmunity [42123], making it an appealing target for antigenic mimicry or epitope spreading because it is upregulated and expressed exclusively at sites of inflammation [42327]. It can also meet the criteria of bystander antigens for antigen-specific immunotherapy through the induction of bystander suppression [427].
The prerequisites for successful Treg-based immunotherapeutics against autoimmune diseases likely include the identification of specific target Treg subsets optimal for particular antigen delivery [10], the successful epigenetic regulation of Treg stability [2829], and the expression of homing receptors for preferential localization at the site of inflammation or in lymph nodes [13]. Furthermore, the use of antigen-specific Tregs should reduce the risk of off-target immunosuppression, while yielding increased specificity in the target tissue [1530]. Because effective Treg activity depends on both the appropriate Treg phenotype and defined autoantigen specificity [14], the isolation of sufficient numbers of antigen-specific T cells from rare T-cell receptor specificities in the naïve or polyclonal Treg repertoire is a major challenge. It is questionable whether simply putting a large number of these polyclonal cells into a patient, without modifying their specificity or function, would have the desired effect, because the numerous poorly defined specificities of Tregs would lead to the unwanted suppression of beneficial responses [818]. Our approach for generating a novel Pep19-specific Tregs population was essential, because once activated by its cognate antigen, a Treg can suppress conventional T cells within the immediate vicinity regardless of specificity, through a phenomenon known as linked suppression [31].
The proposal that 45RA-Tregs proliferate ex vivo to a greater extent than polyclonal 127-Tregs was shown to be true for isolation and expansion [910], due to their remarkable capacity for homogenous expansion and epigenetic stability upon repetitive stimulation [11]. This postulate became more persuasive when we targeted Pep19-45RA-Tregs as tools for enhancing the expression of suppressive Treg markers and function, whereas 127-Tregs may include FoxP3+ cells producing IL-17 and IFN-γ that do not exert a suppressive effect [9]. The proliferative fraction has been reported to reside within the CD45RA− Foxp3hi activated Treg population [928]. Since naïve Tregs are resistant to CD95L-mediated apoptosis [12], it is interesting that Pep19-45RA-Tregs demonstrated an identical resistance to apoptosis, even though they might have lost the CD45RA marker upon antigen stimulation. This pattern of resistance may derive from the fact that resting CD45RA+ Tregs and activated CD45RA− Tregs represent distinct differentiation statuses of the same T cells [9]. In addition, as we excluded the possibility of contamination by CD45RA+CD25− nonTregs in the initial sorting procedures, the ex vivo expanded Pep19-45RA-Tregs may not have been prone to apoptosis. This finding is further supported by the modest level of expression of the homing receptors CD62L and CCR7 in the Pep19-45RA-Treg subpopulation, suggesting that this subpopulation may be well-equipped to preferentially localize at the site of inflammation [10]. This possibility is further supported by the pronounced in vivo immunohistochemical co-localization of CD4+CD25+ T cells in the articular joints of group III mice that were infused with Pep19-45RA-Tregs. Less pronounced homing of Pep19-45RA-Tregs to the spleen further supports this concept.
Theoretically, naïve 45RA-Tregs or polyclonal 127-Tregs should demonstrate a high level of ex vivo expansion as well as epigenetic stability (demethylation status of TSDR) upon repetitive stimulation [1011]. Indeed, the DNA methylation state of TSDR remained high in the expanded Tregs, indicating the overall stability of the expanded Tregs, which did not necessarily mirror the expression levels of Foxp3 protein. Meanwhile, the highest Foxp3 protein level was observed in the expanded Pep19-45RA-Tregs, as determined by FACS. The prominent epigenetic signature in concert with the high level of Foxp3 in Pep19-45RA-Tregs is likely to be translated into a potent in vivo suppressive function in the humanized model of arthritis when adoptively transferred, as evidenced by the low arthritis score, minimal swollen pad, pronounced immunohistochemical localization at the inflamed sites, and the highest survival rate. The greater in vitro Teff suppression and enhanced Treg proliferation in response to bystander antigens observed for the Pep19-45RA-Tregs may have potentiated the immune homeostatic effects of the Tregs. This interesting phenomenon is compatible with our previous observation that Pep19, a predominant epitope in autoimmune diseases [23], drives epitope spreading into identical bystander self-antigens both in human and mice, demonstrating the high immunoreactivity of this peptide [21]. In light of the above findings, Pep19 can be proposed as a target molecule that drives epitope spreading and bystander suppression in autoimmune diseases, making it an attractive candidate for Treg-based immunotherapy for autoimmunity.
However, the suppressive activity was especially remarkable, because we placed an identical number of Tregs in the CFSE assay, whereas it could have been higher if we had increased the ratio of Tregs. We introduced a CFSE-based suppression assay, in which we circumvented common problems [3132]. First, we decided against the use of bead-coupled reagents as a co-culture stimulus and against a high suppressor-to-responder ratio, which may lead to the overestimation or underestimation of Treg suppressive function. Second, to preclude overestimation, only FACS-sorted CD25hi Tregs were used, rather than CD25+ T cells purified with anti-CD25-antibody-coupled magnetic beads, which are frequently contaminated with CD25+Foxp3− activated effector cells. Third, we exploited the advantages of the CFSE-based assay over a 3H-thymidine-based assay. The latter measures the proliferation of both regulatory and responder cell populations [333435], whereas the former measures the proliferation of well-defined cell populations. Moreover, the latter assay estimates cell proliferation only during the short period of co-culture [33]. Fourth, the suppressive effects of Tregs on Teff proliferation were evaluated in response to specific antigens to verify bystander suppression for subdominant self-antigens.
Pep19-specific Tregs could be established through antigen presentation by antigen-pulsed DCs in a tolerogenic milieu by adjusting a cytokine cocktail (i.e., IL-4, GM-CSF, retinoic acid, and IL-10). Considering that the Pep19 antigen is derived from a bacterial protein, caution was taken not to induce immunogenic DCs to secrete proinflammatory cytokines and to provoke pathogenic Teffs or non-Tregs that may exist within the Treg expansion medium [36].
Obtaining high-fidelity and sufficiently numerous populations of antigen-specific Tregs, while avoiding the outgrowth of contaminating non-Tregs, is crucial for clinical trials of adoptive-transfer-related therapies [37]. To this end, subsequent experiments should include engineering transgenic mice with a T-cell receptor specific for a particular candidate antigen to facilitate the localization of the cells to the target organs [38]. Further, Gratz et al. [39] have proposed that more realistic antigen-specific Treg cell-based immunotherapies must target appropriate Treg subpopulations for the optimal modulation of diverse immune responses and antigens at discrete sites of inflammation. Additionally, the diversity of tissue Tregs may alter their migratory, functional, and homeostatic properties in response to environmental cues [40].
Taken together, targeting the novel epitope spreader Pep19 by human naïve CD45RA+ Tregs and the adoptive transfer of Pep19-45RA-Tregs for the management of arthritis yielded new insights into a potent immunotherapeutic strategy that may help elucidate whether antigen-specific Treg cells can be generated from CD45RA+CD4+CD25high Treg cells for therapeutic interventions in autoimmune diseases, as suggested by Masteller et al. [30]. In conclusion, we propose that human naïve CD45RA+ Treg and the epitope spreader Pep19 may be cellular and molecular targets for innovative antigen-specific Treg vaccinations in a humanized model of rheumatoid arthritis.
 XML Download