

 PDF
PDF ePub
ePub Citation
 Print
Print


INTRODUCTION
Although contact and distance osteogenesis have been defined and described, studies have not clearly elucidated these bone formation mechanisms around implants inserted into bone [1]. Therefore, it remains unclear whether contact and distance osteogenesis act independently or interactively to achieve peri-implant bone healing. However, some limited evidence suggests that they act independently. First, while both types of osteogenesis occur around topographically micro-roughened implant surfaces, this is not true for interfaces with smooth or polished implants; with these implants, bone only forms in the same direction as the old host bone. This suggests that distance osteogenesis can occur in the absence of contact osteogenesis [23]. Second, a study showed that when a micro-roughened implant is placed, there is an initial increase in the adsorption of proteins from the blood on the surface of the implant, and that these proteins direct bone formation from the implant surface toward the host bone [456]. This suggests that, to some degree, contact bone formation may act independently of distance osteogenesis in peri-implant bone healing.
This in vivo study was conducted to test our hypothesis that contact and distance osteogenesis are controlled by independent mechanisms. Microscopically roughened implants were inserted into rabbit bones, half of which were physically separated from the cortical bone by encasement in a titanium (Ti) tube. This allowed us to measure contact osteogenesis alone.
MATERIALS AND METHODS
Sample preparation and implant surface modification
In total, 24 Ti implants that were 3.3 mm in diameter and 10.0 mm long were used in this study. Twelve were from Deep Implant System, Inc. (Seongnam, Korea) and had been subjected to coarse-grit sandblasting and acid etching. These sandblasted and acid-etched (SLA) implants served as control implants. The remaining 12 implants were SLActive implants from Institut Straumann AG (Basel, Switzerland). These modified SLA (modSLA) implants not only underwent grit blasting and acid etching, but were also rinsed under nitrogen protection and then sealed in glass tubes containing isotonic sodium chloride (NaCl). This modification increases the hydrophilicity of the implants, as it yields a hydroxylated/hydrated surface that retains high surface energy. Of the 12 implants in each group, 2 were used for surface analysis and 10 were implanted in rabbit tibiae.
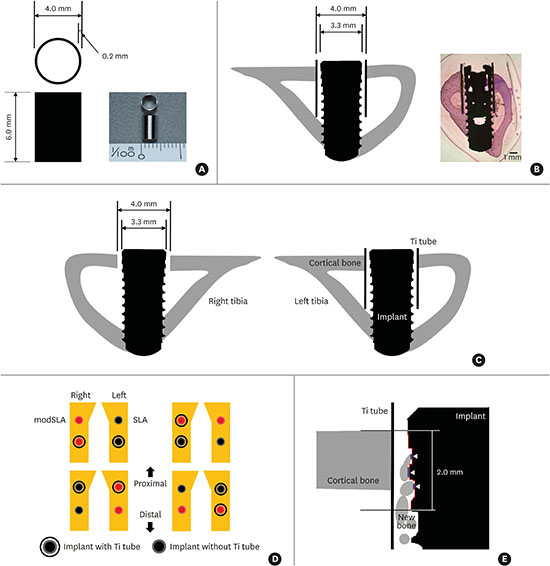
To separate contact and distance osteogenesis physically, half of the SLA and modSLA implants were implanted within grade 4 Ti tubes that were 4.0 mm in diameter and 6 mm long and had a wall thickness of 0.2 mm (Figure 1A). Thus, these Ti tubes had an inner diameter of 3.6 mm. Implantation of a SLA or modSLA implant 3.3 mm in diameter within such a Ti tube therefore left a 0.15 mm gap between the implant surface and the inner Ti tube surface (Figure 1B-D).
 | Figure 1Key features of the in vivo experiment on rabbits. (A) The Ti tube that was used to obstruct the putative influence of distance osteogenesis on contact osteogenesis. The Ti tube is depicted schematically on the left. An actual image is shown on the right. (B) The Ti tube around the implant after both elements were inserted into a rabbit tibia. The resulting structure is depicted schematically on the left. An actual light microscopy image is shown on the right (H&E, bar=1 mm). Note that the implant is bicortically engaged in the tibial bone. (C) Schematic depiction of the implant after insertion with and without the Ti tube. Note that, in this image, there are gaps between the implant and the upper cortical bone in the right tibia and between the Ti tube and the implant inserted in the left tibia. During drilling, we noted that both gaps were filled with blood from the bone marrow and periosteum. This indicates that the gaps may contain various circulating factors such as platelet-derived growth factor. (D) Schematic depiction of the split-plot design with which implants with and without Ti tubes were placed in the 4 pairs of rabbit tibiae. The 4 rabbits used in this study were assumed to be identical. (E) Schematic depiction of how BIC was measured. A 2-mm-long stretch of the cross-sectional implant surface (indicated by the red line) was examined to determine how much of that length was in direct contact with bone: the white arrowheads and blue lines indicate where bone was in contact with the implant surface. The lengths of the blue lines were added up and divided by 2 mm to yield the BIC ratio. For each specimen, the BIC ratios of the right and left sides of the implant were calculated and the average ratio was used in the analyses.
Ti: titanium, H&E: hematoxylin and eosin, BIC: bone-to-implant contact, modSLA: modified sandblasted and acid-etched, SLA: sandblasted and acid-etched.
|
Surface characteristics
Two SLA and modSLA implants and 2 Ti tubes were subjected to surface analysis using field emission scanning electron microscopy (FE-SEM) and energy-dispersive spectroscopy (EDS). The former was used to generate overall surface images (S-4700, Hitachi, Tokyo, Japan), while the latter was used to analyze the components and contents of the modified surfaces (EX220, Horiba Ltd., Kyoto, Japan).
In vivo study and histomorphometry
This study was approved by the Animal Research Committee of Seoul National University, Seoul, Korea. All animal experiments were conducted in accordance with the guidelines of the Institute of Laboratory Animal Resources at Seoul National University (approval number: SNU-130619-4) and the Animal Research: Reporting of In Vivo Experiments (ARRIVE) guidelines for reporting in vivo animal experiments [7]. Five male New Zealand white rabbits (age, 1–2 years; body weight, 2.6–3.0 kg) with no signs of disease were used. All rabbits were anesthetized via an intramuscular injection of tiletamine/zolazepam (15 mg/kg, Zoletil® 50, Virbac Korea Co., Ltd., Seoul, Korea) and xylazine (5 mg/kg, Rompun™, Bayer Korea Ltd., Seoul, Korea). Before surgery, the skin over the proximal tibia was shaved and washed with betadine, after which an antibiotic (Cefazolin, Yuhan Co., Seoul, Korea) was administered intramuscularly. Lidocaine was injected locally into each surgical site. The skin was then incised, and the tibiae were exposed by muscle dissection and periosteal elevation. Drills and profuse sterile saline irrigation were used to prepare implant sites on the flat tibial surface.
In 4 rabbits (the handling of the fifth rabbit is described below), drilling was performed bicortically, with final diameters of 4 mm at the upper cortical bone (to prevent physical involvement, including friction) and 3 mm at the lower cortical bone (to promote stability). If used, the Ti tubes were inserted prior to implant placement; otherwise, implants were installed directly into the tibial bone as shown in Figure 1B. Each of the 4 rabbits received 2 sets of implants: 2 were SLA implants and 2 were modSLA implants. One SLA implant and 1 modSLA implant were inserted within Ti tubes. Thus, in total, 8 SLA and 8 modSLA implants were inserted in the 4 rabbits, and 4 implants of each group were encased in Ti tubes. The implants were inserted into the right and left tibiae of each rabbit (Figure 1C) according to the split-plot design shown in Figure 1D. The muscle and fascia were then sutured with resorbable 4-0 Vicryl sutures, and the outer dermis was closed with a nylon suture.
The rabbits were housed separately after surgery. After a 4-week period of bone healing, they were anesthetized and sacrificed via an intravenous overdose of potassium chloride. The tibiae were exposed, and the implants were surgically removed en bloc with an adjacent bone collar. The implants/bone were immediately fixed in 10% neutral formaldehyde. Histomorphometry specimens were prepared by embedding the implants and bone in light-curing resin (Technovit 7200 VLC, Kultzer, Wehrheim, Germany) [8] and then treating them according to the method described by Donath and Breuner [9]. Thus, undecalcified specimens were ground to a thickness of 50 μm, stained with hematoxylin and eosin (H&E), and subjected to a general histological evaluation under a light microscope (Olympus BX, Olympus, Tokyo, Japan). The image analysis software (Kappa PS30C Imagebase, Kappa Opto-electronics GmbH, Gleichen, Germany) that was associated with the light microscope was used to calculate the bone-to-implant contact (BIC) ratio for each implant. Thus, a stretch of the implant surface measuring 2 mm in length was examined to determine how much of that length was in direct contact with bone. It should be noted that the top of the 2-mm stretch was level with the upper surface of the cortical bone (Figure 1E). The BIC ratios of the left and right sides of each implant were determined. The mean BIC ratio for each implant was then calculated.
Immunohistochemistry
In the fifth rabbit, 4 SLA implants were placed in both tibiae without Ti tubes as described above, except that the final drill was used to make holes 3 mm in diameter and the implants were only engaged at the upper cortex. The rabbit was sacrificed after 10 days, and the implants were removed by counterclockwise rotation after demineralization. Paraffin wax-embedded sections were generated from the bone blocks from which the implants had been removed, and the sections were then subjected to immunohistochemistry according to a standard protocol. Thus, sections were deparaffinized and rehydrated in a graded alcohol series, followed by antigen retrieval in 10 mM Tris/1 mM ethylene diamine tetra-acetic acid (pH 9.0) at 98°C for 20 minutes (microwave oven). The sections were then washed under running tap water for 10 minutes and treated with 0.3% hydrogen peroxide in methanol for 10 minutes to block intrinsic peroxidases; the method followed the protocol that was supplied with a mouse- and rabbit-specific horseradish peroxidase/3,3′-diaminobenzidine (DAB) avidin-biotin complex immunohistochemistry detection kit (ab64264, Abcam®, Cambridge, UK). Subsequently, the sections were blocked using a protein blocking reagent from the same kit and then incubated overnight at 4°C with an anti-rabbit antibody specific for bone morphogenetic protein (BMP)-2 (1:800 dilution, ab6285, Abcam®). The next day, the sections were washed 3 times for 5 minutes in 0.01 M phosphate-buffered saline (PBS) (pH 7.2–7.4) and incubated with a biotinylated goat anti-polyvalent secondary antibody (1:200 dilution, ab64264, Abcam®) at room temperature for 20 minutes. After 3 other 5-minute washes in 0.01 M PBS, the sections were incubated at 37°C for 20 minutes with streptavidin peroxidase from the detection kit. After 3 additional 5-minute washes in 0.01 M PBS, the sections were incubated for 10 minutes at room temperature with a mixture consisting of 20 mL of 2.5% DAB chromogen and 1 mL of DAB substrate from the detection kit. They were then counterstained with hematoxylin, dehydrated through ethanol and xylene, and mounted with Permount under a cover glass. The remaining sections from the bone blocks were subjected to Masson trichrome staining.
Statistical analysis
Statistical analyses were performed using R 3.3.2 statistical software (R Foundation for Statistical Computing, Vienna, Austria). The effect of different implant surfaces and the presence or absence of Ti tubes on the BIC ratio was assessed using 2-way analysis of variance (ANOVA). When the 2-way ANOVA indicated a significant difference between the groups, pairwise multiple comparisons were conducted using the Tukey test. The level of significance was set at P=0.050.
RESULTS
FE-SEM images of the SLA and modSLA Ti surfaces revealed honeycomb-shaped irregularities that were the result of the sandblasting and acid-etching procedures (Figure 2). These are typical features of these surfaces. FE-SEM images of the Ti tube surface revealed machining grooves, which is characteristic of the computer numerical control milling process that was used to manufacture these tubes. The EDS results of the SLA and modSLA surfaces were similar, indicating that they were mainly composed of Ti and oxide. By contrast, the Ti tube consisted of 97.7% Ti.
 | Figure 2FE-SEM of the modSLA and SLA implants and the Ti tube. (A and B) FE-SEM images of the modSLA (A) and SLA (B) surfaces. Both implant types had been blasted with large-grit sand and acid-etched. The modSLA implant was further modified by being rinsed under nitrogen protection and then sealed in glass tubes containing isotonic NaCl. This procedure was conducted to increase the hydrophilicity of the implant. The surfaces exhibited similar micro-topographical features. The procedure intended to increase hydrophilicity had little effect on the modSLA surface topography. (C) FE-SEM images of the Ti tube. The left image shows a machined surface consisting of grade 4 commercially pure Ti. The right image shows a magnification of the left-hand FE-SEM image. It depicts many machined grooves that were etched by computer numerical control milling (white arrowheads). The bars in the left (A, B, C) and right (C) images indicate 20 μm, 20 μm, 1 mm, and 20 μm, respectively.
FE-SEM: field emission scanning electron microscopy, modSLA: modified sandblasted and acid-etched, SLA: sandblasted and acid-etched, Ti: titanium, NaCl: sodium chloride.
|
After in vivo surgery, none of the rabbits exhibited complications in terms of wound healing, implant exposure, or other problems. Histological analyses showed that, 4 weeks after implantation in the absence of Ti tubes, the SLA and modSLA surfaces exhibited excellent osseointegration (Figure 3A and C); in other words, sufficient bone formation was observed around the implants. By contrast, when the Ti tubes were applied, very little bone formed between the implant and the inner surface of the Ti tube. However, mature bone was observed on the outer surfaces of the Ti tubes. This was observed for both the SLA and modSLA implants (Figure 3B and D).
 | Figure 3Light microscopic histological views of the modSLA and SLA implants with and without the Ti tube. Both implant types had been blasted with large-grit sand and acid-etched. The modSLA implant was further modified by being rinsed under nitrogen protection and then sealed in glass tubes containing isotonic NaCl. (A) modSLA without Ti tube. (B) modSLA with Ti tube. (C) SLA without Ti tube. (D) SLA with Ti tube. The red boxes indicate the area on the image that was further magnified on the right. The modSLA and SLA implants without Ti tubes showed good formation of cortical bone; Haversian systems (red arrowheads) are visible around the surfaces of both implants (A and C). By contrast, the modSLA and SLA implants with Ti tubes (blue arrowheads) exhibited little or no bone on their surfaces (B and D). Note that the implant surfaces in (A) and (C) were adjacent to a solid wall of bone. By contrast, the spaces between the implants and Ti tubes in (B) and (D) were empty, which indicates a lack of osteogenesis. In (A-D), the bars in the left, middle, and right images indicate 1,000 μm, 500 μm, and 50 μm, respectively (H&E).
modSLA: modified sandblasted and acid-etched, SLA: sandblasted and acid-etched, Ti: titanium, NaCl: sodium chloride, H&E: hematoxylin and eosin.
|
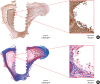
The modSLA implants had significantly lower BIC ratios than the SLA control implants, regardless of whether a Ti tubes was present or absent (P=0.043). Moreover, the implants within Ti tubes had significantly lower BIC ratios than the implants not placed in Ti tubes, regardless of whether the implants were SLA or modSLA implants (P<0.001) (Table 1, Figure 4).
Table 1
BIC ratios of modSLA and SLA implant surfaces after implantation with or without Ti tubes

| Surface | Ti tube | |
|---|---|---|
| Present | Absent | |
| modSLA | 0.018±0.036 | 0.754±0.163 |
| SLA | 0.211±0.156 | 0.830±0.087 |
The values are presented as mean±standard deviation.
BIC: bone-to-implant contact, modSLA: modified sandblasted and acid-etched, SLA: sandblasted and acid-etched, Ti: titanium.
![]()
 | Figure 4Box-plot analysis of the BIC ratios of each group. In terms of BIC ratios, the SLA surface was more biocompatible than the modSLA surface. However, this difference between the surface types was only marginally significant (i.e., the P values were close to 0.05). Notably, the Ti tubes slowed bone formation considerably regardless of the type of surface.
BIC: bone-to-implant contact, modSLA: modified sandblasted and acid-etched, SLA: sandblasted and acid-etched, Ti: titanium.
a)P<0.050, b)
P<0.010.
|
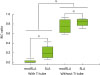
Immunohistochemistry of the tibial bone around the implants 10 days after modSLA and SLA implantation without Ti tubes showed that BMP-2 was mainly present at the bone-implant interface (Figure 5). Moreover, the BMP-2-expressing areas corresponded with the areas that had new bone formation (as determined using Masson trichrome staining) (Figure 5B).
 | Figure 5Immunohistochemistry of the tibial bone 10 days after implants were placed. Modified modSLA and SLA implants were placed in the tibiae of a rabbit. Ten days after surgery, the rabbit was sacrificed, the implants were removed, and tibial bone sections were generated. (A) The sections were stained for BMP-2 expression. BMP-2 staining is shown by the dark brown areas. Note the marked expression of BMP-2 (red arrowheads) at the bone-implant interface. This suggests that BMP-2 produced by old bone may initiate contact osteogenesis. (B) Other bone sections were stained with Masson trichrome to identify areas of new bone formation (blue color, black arrowheads) along the bone-implant interface. These areas correspond to the area of strong BMP-2 expression in (A). The red rectangular areas shown in the left-hand images (bar=1,000 μm) were magnified further in the right-hand images (bar=50 μm).
modSLA: modified sandblasted and acid-etched, SLA: sandblasted and acid-etched, BMP: bone morphogenetic protein.
|
DISCUSSION
The present study focused mainly on contact osteogenesis. We observed that, when the putative influence of distance osteogenesis was reduced by a physical barrier, contact osteogenesis was largely eliminated. This suggests either that only distance osteogenesis occurs around dental implants during bone healing, or that contact osteogenesis is dependent on triggering factors produced during distance osteogenesis. The first possibility is not consistent with studies showing that contact and distance osteogenesis are both evident in the formation of bone around micro-roughened dental implants [23]. Thus, the second possibility seems more likely.
The next question is, do the factors from distance osteogenesis that promote contact osteogenesis derive from the existing bone or from the blood of the bone marrow and periosteum? In relation to this, we noticed during surgery that the gap between the implant and the Ti tube was bathed with circulating blood from the bone marrow and the periosteum [101112]. Nonetheless, the Ti tube seemed to block contact osteogenesis almost completely. This suggests that the triggering factors originate from the existing bone. Indeed, studies have suggested that the key substance that activates contact osteogenesis is not a bioactive protein in the circulation (e.g., platelet-derived growth factor) [1013141516171819202122232425], but BMP-2, which is a host bone-produced factor. The evidence supporting this is that BMP-2 plays a major role during the healing of fractured bone, and that healing after dental implant surgery could be considered to be equivalent to the healing of fractured bone [2627]. Therefore, we suspected that the triggering factor originating from the existing bone is BMP-2. To test this, we used immunochemistry to examine the bone 10 days after implantation. Indeed, we observed BMP-2 expression at the bone-implant interface. This suggests that the activated BMP-2 that is produced by the host bone during distance osteogenesis establishes contact osteogenesis on the implant surface. While further studies verifying and extending these observations are needed, this is the first time that contact osteogenesis has been investigated separately from distance osteogenesis. In addition, molecular-level experimental investigations, such as removing the implants and performing BMP-2 immunocytochemistry, would be helpful in clarifying the relationship between distance and contact osteogenesis.
This study has some limitations. In particular, we only measured the BIC ratio because the implant thread design hampered our ability to measure the bone area. Future studies that allow bone quantity to be measured precisely are needed, especially because such studies may permit identification of the factor or factors that initiate contact osteogenesis. Indeed, such studies will determine how important BMP-2 is in the establishment of contact osteogenesis. Moreover, studies with in vivo experimental models and in clinical settings will help to determine whether distance and contact osteogenesis play distinct dominant roles during different stages of bone healing and regeneration early after implantation.
In conclusion, by physically separating contact and distance osteogenesis, this study showed that the 2 processes act in an interactive fashion. Specifically, we showed that the host bone produces an etiological trigger, probably BMP-2, that initiates contact osteogenesis. The BMP-2 that is produced by host bone in this setting is probably generated during distance osteogenesis. Further studies to confirm these findings are warranted.
 XML Download