

 PDF
PDF ePub
ePub Citation
 Print
Print


INTRODUCTION
Periodontal disease caused by anaerobic Gram-negative bacteria causes inflammation of the gingiva, damage to the periodontal ligament and adjacent tissues, and destruction of alveolar bone. It has recently been discovered that periodontal inflammation is closely associated with systemic disease through the spread of inflammatory factors [1]; the associated systemic diseases include cardiovascular disease, rheumatoid arthritis, diabetes, and premature delivery [23]. Regarding the causal relationship between periodontal disease and systemic disease, many recent studies have investigated bacteria and inflammatory cytokines as mutual risk factors [4].
The general biological mechanism by which periodontal disease influences systemic disease involves the entry of bacteria into the bloodstream through a periodontal pocket. The bacteria that can promote and worsen cardiovascular disease via periodontal disease include anaerobic Gram-negative Porphyromonas gingivalis. These bacteria, along with Prevotella intermedia, have been found in atherosclerotic plaques that give rise to atherosclerosis [56]. This suggests that periodontal pathogens are associated with the formation of atherosclerotic plaques after reaching the heart via the bloodstream.
Cytokines and prostaglandins have been reported to be elevated in patients with periodontal disease [78], and the presence of this condition before delivery could cause early uterine contractions and cervical ripening, leading to premature birth [9].
While periodontal disease is related to cardiovascular disease, low-birthweight babies, and other systemic diseases, few studies have investigated the varying degrees of impact of periodontal disease on systemic disease or the relevance of the severity of periodontal disease. Previous studies have measured the inflammatory area affected by periodontitis in order to understand the impact of periodontal disease on systemic disease [1011], but their methods of measurement and results were not accurate and varied depending on the skill of the practitioner. More widespread periodontal disease promotes blood-mediated reactions to bacteria, symptoms of systemic diseases, and cross-reactivity.
Therefore, evaluating periodontal disease as a risk factor for systemic diseases requires measurement of the affected area of periodontal tissue in order to quantify the inflammatory burden. The inflamed periodontal surface area reflects the surface area of the bleeding-pocket epithelium, and hence it can be used to quantify the inflammatory burden of periodontal disease [12].
Surface measurements of an inflamed area can be useful for establishing the causal relationship between periodontal and systemic disease, and can also provide insight into the biological mechanisms of periodontal disease as a risk factor for systemic disease. In addition, the inflamed area can be an important marker when determining the prognosis and treatment plan for teeth. Numerous recent studies have been performed to quantify the inflamed surface area, but their measurement methods lacked accuracy and precision. One study used micro-computed tomography (micro-CT) to overcome these shortcomings, and also measured the root surface areas (RSAs) using 3-dimensional (3D) data from extracted teeth [13].
Cone-beam computed tomography (CBCT) is a useful nondestructive method for 3D reconstruction that can be used to visualize and measure the morphological structures of teeth. The 3D models reconstructed from CBCT and tomographic images can display the precise anatomical structure of teeth. This 3D technology can be used to establish databases of 3D teeth models for widespread research or educational applications. In addition, CBCT is useful for making real-time clinical diagnoses of patients and developing surgical plans. Combining 3D models obtained from CBCT with 3D printing technology has proven useful in various types of clinical surgery, including orthodontics, teeth strengthening, and reconstruction [14]. Programs that accurately measure the complex structures of 3D models mathematically are available, but no previous studies have attempted to measure the RSA using CBCT technology.
This study used CBCT to obtain 3D data of the teeth of 33 patients in order to measure the inflamed RSA, as well as to obtain measurements of the surface area between the cementoenamel junction (CEJ) and 6 mm below the junction, in the presence of moderate periodontal infection. The results obtained in this study can be used as materials for basic research investigating the relationship between periodontal inflammatory burden and systemic disease.
Go to : 
MATERIALS AND METHODS
Material and subjects
The CBCT data of 33 patients used in this study were obtained from the Department of Oral and Maxillofacial Radiology at Dankook University Dental Hospital. The study was conducted after receiving approval (DUDH IRB 2015-12-022) from the Institutional Review Board of Dankook University Dental Hospital. In total, 924 teeth were used in the study. The selected CBCT images included data from 17 men (51.5%) and 16 women (48.5%) aged from 20 to 35 years, with a mean age of 24.4 years. CBCT data were selected based on whether the anatomical structures between the CEJ and the root apex were intact, but not on teeth length, circumference, or shape. Because the third molars of the maxilla and mandible have a high deformation rate and were absent in some patients, they were excluded from the study. Data from CBCT images that were unclear to the naked eye due to artifacts and where certain teeth were cropped out due to inadequate area settings were also excluded.
The CBCT data were saved as Digital Imaging and Communication in Medicine (DICOM) files (.dcm) using a CBCT scanner (Alphard 3030, Asahi, Kyoto, Japan). The following parameters were used in CBCT scanning: slice increment=0.6 mm, slice thickness=0.6 mm, and matrix=512×512 pixels. DICOM files were imported from the Mimics software (Materialise, Leuven, Belgium) and included images of the maxilla and mandible structures that contained 28 teeth.
3D reconstruction from CBCT
In Mimics, the CBCT images had predefined thresholds (from a minimum of 2,224 to a maximum of 4,095) that were set to correspond to tooth density and the designated area for 3D reconstructions. The images were then reconstructed into 3D structures through smoothing of the calculated 3D parameters (one iteration with a smoothing factor of 1.0).
In each CBCT slide, the teeth were separated from the jaw bone using the region-growing method in the Mimics software. The remaining parts (i.e., other than the teeth) were removed (Figure 1). Twenty-eight teeth were 3-dimensionally reconstructed and grouped in a crisscross manner for easier measurement and separation (Figure 2).
 | Figure 1Process of masking mandibular teeth in CBCT. (A) Thresholding mask based on the general bone value in Mimics (Materialise, Leuven, Belgium). (B) Separating soft tissue and cervical bone in the mandible, and then filling inside the cavity. (C) Extracting teeth from the mandible.
CBCT: cone-beam computed tomography.
|
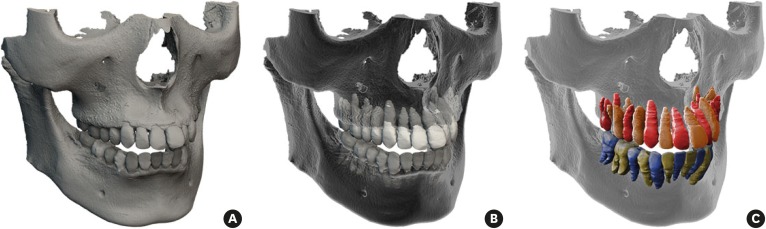 | Figure 2Process of generating the 3D structure of teeth. (A) The 3D skull model was generated using Mimics (Materialise, Leuven, Belgium). (B) The skull and teeth were separated using the region-growing method. (C) The teeth are indicated in red and orange in the maxilla, and green and blue in the mandible. The teeth were extracted and bones were deleted.
3D: 3-dimensional.
|
Design and separation of 3D tooth data
In Mimics, the crown and root of the 3-dimensionally reconstructed teeth were separated; the 3D models were converted into STL files and imported into the 3-Matic program (version 9.0, Materialise) in order to measure the area from the root. The 3-Matic software was used to accurately measure the surface area of the 3D models. The reference point, which was 6 mm below the CEJ, was set based on the diagnostic criterion for periodontal inflammation of a clinical attachment level (CAL) of 6 mm (Figure 3). After identifying and drawing the CEJ using a curve creation method (smooth curve, attract curve, or attach curve in 3-Matic), the crown and the root were separated through surface cutting and the crown was removed (Figure 4). Due to limited CBCT resolution, it was difficult to clearly identify the CEJ in this study; therefore, 2 evaluators who were knowledgeable in dental morphology were asked to identify the junction based on consensus.
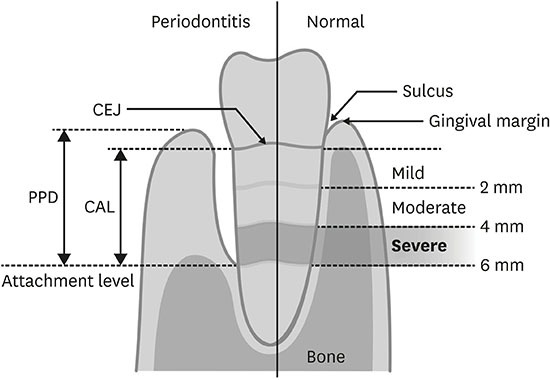
 | Figure 3Evaluation of the CAL in periodontitis. The CEJ is the cervical line between the crown and root. The CAL is the distance from the attachment level to the CEJ. The PPD is the distance from the attachment level to the gingival margin.
CAL: clinical attachment level, CEJ: cementoenamel junction, PPD: probing pocket depth.
|
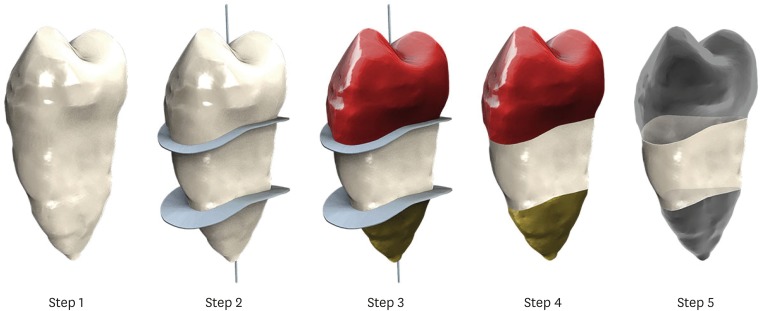 | Figure 4Separation of the RSA at 6 mm below the CEJ. Step 1. Generated using 3-dimensional data from CBCT. Step 2. A root line position is created around the tooth meridian and a cross section of the root at 6 mm below it. Step 3. Teeth are divided into 3 parts based on 2 apical surfaces. Step 4. The root cross section is removed. Step 5. The lower part and crown are removed, except the area 6 mm below the CEJ.
RSA: root surface area, CEJ: cementoenamel junction, CBCT: cone-beam computed tomography.
|
Because each tooth has a CEJ with a different curvature, a cutting plane that divided the surface area into 2 was automatically produced by calculating the average curvature. However, this was different for cases such as molar teeth and double-rooted teeth, where the curvature widened into a radial form as it projected toward the lower part of the root from the CEJ. In these cases, the surface area of the cutting plane was produced based on tangentially extending the CEJ. In order to move the area that now extended 6 mm below the CEJ, the extended area was moved 6 mm vertically from the apex of the root. The cut area and extended/moved area were parallel to each other and were processed using interactive translation in the Mimics software, with the screen coordinate system and the snapping step value set at 6.0. After moving the extended area, the RSA that remained after the separation of the root and the crown was halved by the extended surface area. Any surface that was more than 6 mm from the root was removed.
Measurement of designed 3D data
The 3-Matic software can measure the overall area or the area of a particular surface of a 3D model. All the 3D models of the teeth were reconstructed in Mimics using the same method. The RSA at 6 mm below the CEJ was separated by the cutting plane that extended to 6 mm below the CEJ. Lastly, the RSA at 6 mm below the CEJ was measured with 3-Matic.
Statistical analysis
The collected data were statistically processed using SPSS software version 12.0 (SPSS Inc., Chicago, IL, USA), and are presented here as mean±standard deviation values. The Mann-Whitney nonparametric statistical test was applied, and the cutoff for statistical significance was set at P<0.05.
Go to :
RESULTS
The following values were obtained after using CBCT to reconstruct, modify, and measure the 3D models. Twenty-eight teeth from each patient were converted into 3D models. The roots and the crowns were first separated, and the roots were then separated at 6 mm below the CEJ. The crown was removed and the surface area at 6 mm above the CEJ was removed. The surface area that corresponded to 6 mm below the CEJ was then measured by a computer.
The size of the incisor teeth decreased in the following order: maxillary central incisor >maxillary lateral incisor >mandibular lateral incisor >mandibular central incisor. The surface area of the maxillary left central incisor was the largest (129.58±24.28 mm2) and that of the mandibular left central incisor was the smallest (96.87±16.65 mm2). Among the molars, the surface area of the maxillary first molar was the largest (right: 227.81±32.01 mm2; left: 232.87±31.48 mm2) and that of the mandibular second molar was the smallest (right: 185.47±31.31 mm2; left: 189.58±36.41 mm2). In addition, a comparison of the mean surface area at 6 mm below the CEJ for all 28 teeth showed that the mean surface area of the left first maxillary molar was the largest (232.87 mm2) and that of the mandibular left central incisor was the smallest (96.87 mm2) (Table 1).
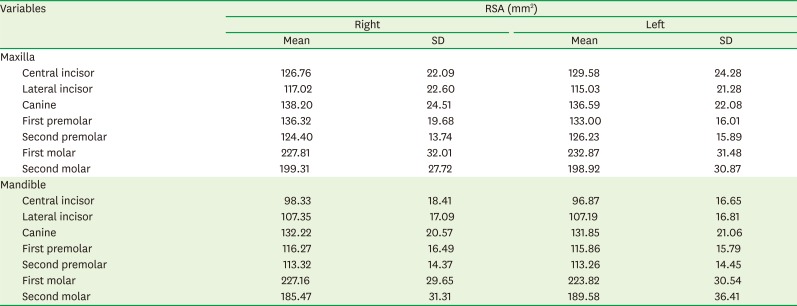
Table 1
Mean remaining RSA at 6 mm in 33 patients
![]()
The mean RSA for all teeth was larger in men than in women. There were remarkable differences in the surface areas of particular teeth between men and women. The mean surface area of the maxillary right first molar differed by 29.91 mm2 between men (242.31 mm2) and women (212.40 mm2), while that of the mandibular left second molar differed by 27.80 mm2 (203.06 vs. 175.26 mm2). The sex difference in surface areas was markedly smaller for the maxillary right second premolar (7.39 mm2: 127.98 mm2 in men and 120.59 mm2 in women) and the mandibular first premolar (3.69 mm2: 118.06 mm2 in men and 114.37 mm2 in women) (Table 2).
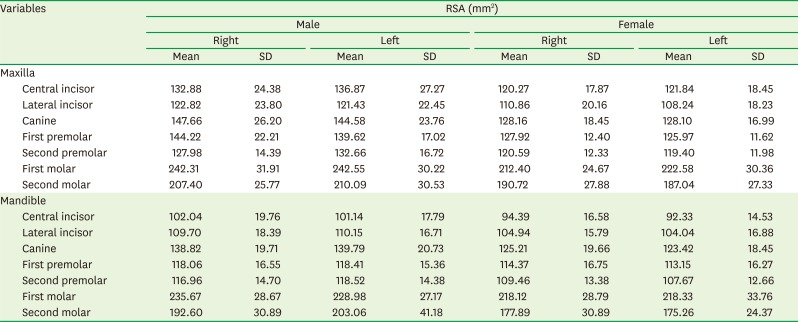
Table 2
Comparison of mean RSA at 6 mm for each tooth type
![]()
The mean surface areas at 6 mm below the CEJ in the teeth of 33 patients were also calculated for men and women separately. The surface area appeared to be largest for the first molar in both the maxilla (right: 242.31±31.91 mm2 in men and 212.40±24.67 mm2 in women; left: 242.55±30.22 mm2 and 222.58±30.36 mm2 in women) and the mandible (right: 235.67±28.67 mm2 in men and 218.12±28.79 mm2 in women; left: 228.98±27.17 mm2 in men and 218.33±33.76 mm2 in women) (Table 2).
The inflammatory burden in the maxilla was significantly higher in men than in women (Mann-Whitney U=78.00, P=0.003) (Table 3).
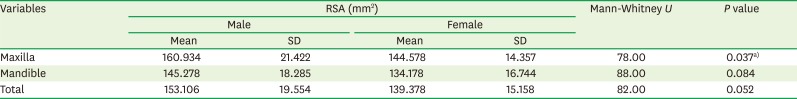
Table 3
Statistical analysis
RSA: root surface area, SD: standard deviation.
a)Statistically significant difference compared to the baseline.
![]()
Go to :
DISCUSSION
Since 2 Finnish studies found that periodontal inflammation was associated with myocardial and cerebral infarction, there have been numerous studies investigating the sources of periodontal infections [1516]. Low-grade chronic systemic infections and inflammation associated with periodontal infection have been found to worsen conditions such as cardiovascular disease [1718], and diabetes [1920]. Circulating oral bacteria can cause inflammation and induce systemic infections beyond the oral area [212223]. Moreover, a medium produced by a local infected region directly causes inflammation in periodontal infection [2425]. Nesse et al. [12] reported that a larger amount of inflamed periodontal tissue increased the likelihood of bacteremia, systemic inflammatory responses, and cross-reactivity. Classifying periodontal infections, which can be a risk factor for other diseases, requires measuring the inflammatory burden, and hence quantifying the inflamed periodontal tissue. The measurement methods used in previous studies were not accurate, as their results varied with the skill of the practitioner. We therefore used CBCT and 3D data to obtain more accurate and precise measurements of the inflamed surface area of teeth and then quantified the inflammatory burden.
The symptoms of periodontal infection include gingival redness, bleeding, foul breath, and pain, with loss of teeth occurring in extreme cases. Periodontal infection occurs when plaque settles beneath the gingiva [2627]. The flaws of the tools used to classify periodontal conditions and to assess the inflammatory burden are shortcomings of the studies that have attempted to investigate the interaction between periodontal infection and systemic disease. The present study aimed to objectively measure the severity of periodontal disease, which acts as a risk factor for other diseases, and to express it as a numerical value. The inflammatory burden as quantified in this study can allow definitive conclusions to be made about the risk of periodontal diseases affecting other systems. In addition, the inflammatory burden can be calculated retroactively using existing research materials, including the CAL, recession, and bleeding-on-probing measurements. Since periodontal infection is a 3D inflammatory process that extends to the connective tissue surrounding the roots of teeth, this study measured the surface area of inflamed roots in 3 dimensions. While it remains unclear how accurate this approach is for quantifying inflamed tissues, the 3D measurement method used in this study can still be considered a tool that measures the quantity of infected tissues more accurately and precisely than previous methods.
Mimics converts 2-dimensional image data stacked after image segmentation into 3D models. 3D models obtained from CBCT data can be accurately measured, and since they are noninvasive, they are useful in the clinical setting and for successful treatment planning [2829]. The present study demonstrated that the RSA could be measured conveniently by producing 3D models of teeth using CBCT and the Mimics software. The CEJ, which divides the crown and the root, is a dividing line that needs to be determined when measuring the surface area of the root, rather than the whole tooth. It is important that the selected contour line precisely corresponds to the CEJ. The surface area of 3-dimensionally reconstructed models, namely the RSA value, is influenced by the contour line. Previous studies have also used CBCT data to create 3D models, but the low resolution of CBCT made it difficult to adjust the contour-line setting [30]. One study measured the surface area by horizontally orienting the CEJ and placing the cutting plane below and parallel to the CEJ [31]. However, this method did not take into account the curved shape of the CEJ, and hence could not accurately measure the RSA. More accurate surface area measurements can be made by precisely setting a contour line that separates the crown and the root based on the CEJ as a boundary, and lowering the contour line while maintaining the curvature of the CEJ. Although the measurements may vary depending on factors such as the CEJ setting according to users, errors that occur during conversion into 3D models, smoothing values, and, more importantly, the CBCT resolution, it can be concluded that Mimics is still the best tool for measuring the RSA.
Accurate measurements require high-resolution 3D models produced using scan data with small intervals. Micro-CT meets these requirements, and is widely used for various kinds of measurements, whereas the resolution of CBCT is lower [32].
During the process of conversion into a 3D model, the size of the model increases slightly due to the voxel size [33]. Micro-CT enables accurate observations of tooth shapes as well as accurate surface area measurements [1334]. However, it is not appropriate for clinical use because it involves higher levels of radiation than CBCT [35]. CBCT is easy to apply for clinical diagnoses, and higher-resolution images can be obtained by applying CBCT separately to each tooth (rather than all the teeth), performing 3D reconstruction on individual teeth, and then connecting the 28 individual teeth together.
This study aimed to perform an accurate analysis of 3D teeth models obtained from CBCT data by utilizing the excellent 3D virtual simulation and high degree of precision of the Mimics software. We obtained 3D data from CBCT image stacks in Mimics, modified and designed the 3D models in detail using 3-Matic, and precisely measured the dental RSAs of all teeth. In addition, unlike previous studies in which teeth were extracted for performing RSA measurements, our study did not involve any tooth extractions. We found that the RSA at 6 mm below the virtual CEJ in patients affected by moderate periodontal inflammation was larger in men than in women. However, such area measurements may differ depending on the age and skeletal type of patients.
Since inflammation in chronic periodontitis patients is spread out not only on the surface of the root, but also extends to surrounding tissues, bone, and other connective tissues, the amount of inflammation cannot be quantified only by root area measurement. Therefore, there is a limit to the precision of the measurement of the amount of inflammation that occurs in periodontitis using only the root surface measurement method outlined in this study. However, we measured surface areas below the CEJ through 3D measurements of the RSA, which is more accurate and simpler than previous methods. In addition, the 3D teeth models used in this study were saved on a computer so that they can be utilized for sectional area measurements and as research material for future studies.
Go to :
 XML Download