

 PDF
PDF ePub
ePub Citation
 Print
Print


INTRODUCTION
The healing of tooth extraction sockets has been extensively evaluated in preclinical and clinical settings [12345]. Most studies have pursued analyses of histological samples or radiographic recordings, or have estimated volumetric changes from study casts. The sequence of events leading to tissue repair and regeneration has been documented in both human biopsies [2] and canine models [3]. Following an extraction, the socket is immediately filled with a fibrin clot, which is subsequently replaced by granulation tissue, connective tissue, and then woven bone, which is ultimately remodeled into mature bone. This sequence of events has been replicated both in human tooth extraction sites and in preclinical canine models.
Most previous studies yielding favorable tissue regeneration in extraction sockets have evaluated healing following the extraction of teeth with stable endodontic and healthy periodontal conditions. In clinical settings, however, the rationale for extraction usually involves teeth with a poor prognosis presenting with difficult-to-treat chronic periodontal and/or endodontic pathology. Clinical observations have suggested that healing in such compromised extraction sites may be significantly delayed compared with the healing process observed following the extraction of teeth from healthy sites [6].
In diseased sites, fibrous scar tissue formation, instead of bone, may be an inevitable outcome even if a strict protocol involving careful debridement and healing intervals extending beyond 12 weeks is used [7]. Such reparative healing, in turn, produces unfavorable clinical conditions for dental implants to acquire primary stability, thus limiting the restorative possibilities. Despite such consequences, studies of extraction sockets with history of periodontal and/or endodontic pathology are rare. The aim of this exploratory study was to evaluate the healing patterns at dental extraction sites with a history of periodontal and endodontic pathology in comparison to the patterns observed at non-compromised healthy sites.
MATERIALS AND METHODS
Animals
Five adult male beagle dogs (OrientBio, Seoul, Korea), with an approximate weight of 10 kg, were used following a protocol approved for this study by the Institutional Animal Care and Use Committee, Seoul National University, Korea (IACUC No. SNU-121204-5-1). All experiments were performed in accordance with Institute of Laboratory Animal Resources, Seoul National University guidelines. The Animal Research: Reporting of In Vivo Experiments (ARRIVE) guidelines [8] were consulted in reporting this research. The study outline is shown in Figure 1. The experiments were performed from March 12, 2010 through September 2, 2011. The animals were individually housed in 0.9×0.8×0.8 m (width×depth×height) indoor runs with an ambient temperature of 23°C±2°C, a relative humidity of 50%±10%, 12–18 air changes per hour, a light/dark cycle of 12/12 hours, and were fed a standard pellet dog-food diet (HappyRang, Seoulfeed Company, Seoul, Korea) with ad libitum access to water throughout the study.
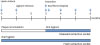 | Figure 1Outline of study: unilateral mandibular 4th premolar teeth in 5 dogs served as experimental units subject to induction of periodontal/endodontic pathology following pulp exposure and ligature enhanced plaque accumulation prior to extraction and subsequent healing (diseased extraction sites). Contralateral 4th premolar teeth served as healthy controls (fresh extraction sites). Block biopsies of the experimental and control sites were obtained at days 1, 7, 30, 60, and 90 post-extraction.
|
Surgical protocol
The animals were anesthetized using an intravenous injection of Zoletil® (0.1 mg/kg, Virbac, Carros, France), Rompun® (2.3 mg/kg, Bayer Korea, Ansan, Korea), and atropine sulfate (0.05 mg/kg, Jeil, Daegu, Korea). Animals additionally received local anesthesia using lidocaine (20 mg/kg, Huons, Sungnam, Korea).
The mandibular 4th premolar teeth in the contralateral jaw quadrants were selected as experimental and control units using a split-mouth design, and each tooth either received mechanical plaque control 3 times per week or underwent a protocol to induce periodontal and endodontic pathology (Figure 2). In short, a #2 carbide round bur was used to expose the pulp tissue, followed by injection of a dental plaque suspension into the site, which was sealed using a temporary restorative material (IRM, Dentsply, York, PA, USA) [9]. Next, indentations were created apical to the cementoenamel junction to facilitate the fixation of wire ligatures and additional silk ligatures soaked with a Porphyromonas gingivalis suspension [10] to induce periodontal lesions. After 4 weeks of interrupted oral hygiene the silk and wire ligatures were removed, followed by an additional 8 weeks of plaque accumulation, at which point the mandibular 4th premolar teeth were extracted with minimal trauma and careful wound debridement, thereby creating diseased and healthy (control) extraction socket sites. An additional animal scheduled for sacrifice day 1 underwent the identical protocol at the 2nd premolar teeth to allow for subsequent analysis using scanning electron microscopy.
Postoperative procedures
Antibiotics and non-steroidal anti-inflammatory drugs were not used during the induction of the periodontal and endodontic pathology. Oral hygiene was performed 3 times per week post-extraction through mechanical plaque control above the cementoenamel junction using curettes and saline irrigation [3]. The animals were euthanized on days 1, 7, 30, 60, and 90 post-extraction, at which time block biopsies including the mesial and distal root areas of both the diseased and healthy sites were collected. Accordingly, 2 sockets were allocated to the infected and non-infected groups at each time of sacrifice.
Sample size calculation
The sample size was calculated to achieve a statistical power of 80%, a type 1 error of 5%, and an assumed difference for the values of 0.6 in the mineralized bone fraction. Based on these parameters, the total number of extraction sockets required to conduct this study was determined to be 20, corresponding to a total number of 5 dogs, with 4 sockets allocated to each animal.
Radiographic recordings
Periapical intraoral radiographs were obtained before disease induction, following ligature removal at 1 month, and immediately prior to extractions at 3 months using Radiovisiographs (Kodak RVG 6100 Digital X-ray Sensor, Eastman Kodak, Rochester, NY, USA). A computer-assisted image-analysis system (PiView STAR™ 5.0, Informer Technologies, Seoul, Korea) was used for the radiographic analysis.
Histologic processing
The block biopsies were fixed in 10% neutral buffered formalin, dehydrated, and embedded in methacrylate resin for histologic analysis using standard techniques. The specimens were sectioned in a mesiodistal direction, processed to a thickness of approximately 3 µm, and stained using hematoxylin and eosin. The most central section from each extraction site was used for the histopathologic analysis.
Scanning electron microscopy
Heparin was applied onto the tissues of the 2nd premolar sites to prevent clot formation, which might have interfered with the scanning electron microscopy analysis of the extraction socket wall. The tissue blocks were fixed in 2.5% (volume/volume) glutaraldehyde and phosphate-buffered saline (pH 7.4) for 20 minutes and rinsed with phosphate-buffered saline twice at 4°C for 20 minutes. Each sample was post-fixed in 1% osmium tetroxide at 4°C for 1 hour, immersed in saturated thiocarbohydrazide at room temperature for 20 minutes, and then dehydrated in a graded ethyl alcohol series (70%–80%–90%–95%–100%, each for 15 minutes). The tissue blocks were dried overnight with hexamethyldisilazane in air. The split extraction sockets were mounted on aluminum stubs, and sputter-coated with a 30-nm layer of gold. Scanning electron microscopy (SEM S4700, Hitachi, Tokyo, Japan) was used to compare bundle bone and Volkmann canals in the apical aspect of the diseased and fresh extraction socket walls. The voltage was set to 15 kV, the type of signal used was secondary electrons, the working distance was 13 mm, and the scan speed was 16 frames/20 sec.
Histopathologic analysis
One calibrated, experienced, masked examiner (JHK) performed the histopathologic analysis (objective ×10/×200) using incandescent light microscopy (DP72, Olympus, Tokyo, Japan), an imaging system (DPController, Olympus), and image-analysis software (Photoshop CS6 extended, Adobe, San Jose, CA, USA) following the methods from a previous study [11]. Based on the hypothesis that the root morphology in the right and left jaws is identical, extraction sockets from the test (diseased) and control (non-diseased, opposite side of the jaw) groups were compared [12]. The margin between the old and new bone was first localized and distinguished for every extraction socket (test and control groups). This junction was identified using the method developed by Araújo and Lindhe [12], who reported that newly formed bone could be differentiated from old bone by the detection of primary and secondary osteons and parallel-fibered bone. The following parameters were evaluated for the mesial and distal extraction socket walls for each section using established routines and measured as a percentage: fibrin clots, inflamed granulation tissue, fibrous connective tissue [1314], bone trabeculae, and bone marrow [2315]. Summary statistics (mean±standard deviation) based on recordings from the mesial and distal extraction socket walls of the 4th premolar roots were used to compare diseased and fresh extraction socket sites. High intraexaminer reproducibility (0.94) was confirmed using the intraclass correlation coefficient.
RESULTS
Radiographic observations
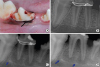
Sclerotic changes around sites developing periapical lesions were apparent at day 30, and became more distinct over time (Figure 2). In contrast, the periodontal lesions did not develop appreciable sclerotic changes despite advanced bone loss.
Scanning electron microscopy observations
Scanning electron microscopy was used to analyze the apical extraction socket walls immediately following extraction. Extraction sockets with a history of periodontal and endodontic pathology showed apparent smoothened bone surfaces with minimal peaks and images of collapsed Volkmann canals. In contrast, fresh extraction socket sites showed more rugged walls, with clear resolution of patent Volkmann canals (Figure 3).
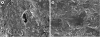 | Figure 3Scanning electron microscopy observation of the apical portion of the alveolar socket walls immediately after extraction of diseased (B) and non-diseased extraction sockets (A). Evidence of Volkmann canals closure in diseased sites suggest deterioration of vascular supply in the infected areas possibly affecting bone remodeling.
|
Histopathologic observations
The histometric evaluation of the diseased and fresh extraction sockets on days 1, 7, 30, 60, and 90 is shown in Table 1. The overall sequence of changes was similar for both groups, beginning with the formation of a fibrin clot, progressing to fibrovascular tissue, and followed by trabecular bone formation. Day 30 saw the initiation of tissue remodeling, which eventually led to the formation of mature osseous tissues with fatty marrow by days 60 and 90.
Table 1
Comparisons of the proportion of tissue components in the healthy and diseased extraction sites over a 90-day healing interval (mean±SD in %)
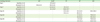
IGT: inflamed granulation tissue, CLOT: fibrin clot, FT: fibrous connective tissue, BT: bone trabeculae, BM: bone marrow, SD: standard deviation.
![]()
Day 1
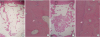
The extraction sockets appeared intact in both groups. In the fresh extraction sites, a well-organized fibrin clot constituted 37.5% of the overall content, whereas an artifactual void comprised the remainder of the socket (62.5%). The corresponding estimates for diseased extraction sites were 26.0% and 38.4%. The severed periodontal ligament showed a perpendicular alignment to the bone surface in the fresh extraction sites, but tended to run parallel in the diseased sites (Figure 4). Granulation tissue displaying an inflammatory reaction, at both the crestal and apical regions, consumed 35.6% of the diseased extraction sites. Osteoclast-like cells and a reduced periodontal ligament were observed adjoining the socket walls (Figure 4), with the number of principal fibers appearing to be smaller in the diseased sites than in the fresh extraction socket sites.
 | Figure 4Overview of fresh (A) and diseased (C) extraction sites day 1. Note large inflammatory cell infiltration coronally and apically in the diseased site (C). Also, note severed periodontal ligament in both groups (B, D). The periodontal ligament aligned perpendicular to the bundle bone in the fresh extraction sites (B: white arrow) whereas alignment appeared parallel to the extraction socket wall (D: white arrow) in the diseased sites. Osteoclast-like cell activity (blue arrows). H&E, original magnification ×16 and ×200.
I-cells: inflammatory cells, CLOT: fibrin clot, PDL: periodontal ligament, BB: bundle bone, H&E: hematoxylin and eosin.
|
Day 7
Epithelial closure of the extraction sites was observed in both groups on day 7. Closure of the bony architecture was less apparent, and continued inward growth of the bone was evident. Fibrous connective tissue radiated inward from the socket walls, replacing a considerable portion of the fibrin clot in both the fresh and diseased extraction sites (Figure 5). However, more prominent residual fibrin clots were present in the fresh extraction sites. Fibrous connective tissue comprised 55.1% of the fresh sites, compared with 58.8% for the diseased extraction sites, without any remarkable differences between the groups. Osteoclast-like activity appeared more pronounced in the diseased extraction sites.
 | Figure 5Overview of fresh (A) and diseased (C) extraction sites day 7. Note resorption of the socket wall in the diseased site (C). Also, note mineral deposition (white arrows) and pronounced osteoclast-like cells (blue arrows) in fresh (B) and diseased (D) sites at a higher magnification. H&E, original magnification ×16 and ×200.
CLOT: fibrin clot, FT: fibrous connective tissue, BB: bundle bone, H&E: hematoxylin and eosin.
|
Day 30
In the healthy extraction sites, trabecular bone formation was observed, with one specimen exhibiting maturation into fatty marrow (Figure 6). Complete soft tissue healing was apparent in the coronal aspect of the socket, but cortex formation was not yet observed. Trabecular bone comprised 43.3% of the overall extraction socket content, while fibrous connective tissue, partially observed in the central region of the socket, comprised 27.4% in the healthy sites. Bone remodeling and marrow formation (29.4%) was observed in the periphery adjoining the socket walls. In contrast, marrow formation was not observed in the diseased extraction sites; fibrous connective tissue and trabecular bone formation comprised 51.5% and 48.5% of the total content, respectively (Figure 6). Appearance of delayed bone formation was evident in the apical aspect of the diseased sites, along with less defined extraction alveoli.
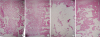 | Figure 6Overview of fresh extraction sites day 30 (A) and 60 (C) and diseased extraction sites day 30 (B) and 60 (D). Note fibrous connective tissue remaining in the central part of the diseased site day 30 (B) and larger portion of bone trabeculae remaining in the central part of the diseased site day 60 (D). H&E, original magnification ×16.
H&E: hematoxylin and eosin.
|
Day 60
A clear delineation of the extraction site borders was no longer visible in either group. Bone remodeling with cortex formation in the coronal aspect of the socket was apparent. In the fresh extraction sites, fatty marrow comprised 78.6% of the socket content, whereas cancellous bone was observed in the center and coronal aspects, exhibiting a density similar to that of the surrounding bone and comprising 21.4% of the content (Figure 6). In contrast, the diseased extraction sockets presented with trabecular bone occupying a majority of the central socket region (53.5%), and less tissue remodeling into bone marrow (46.5%) in the periphery, suggesting a relatively slower healing process (Figure 6). Remnants of the periapical lesion were not discernable.
Day 90
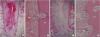
Bone remodeling appeared almost complete in the fresh extraction sites, with fatty marrow comprising 78.9% of the tissue, and cortical bone blending seamlessly with the adjoining pristine bone in the coronal aspect of the extraction socket (Figure 7). Diseased sites contained 65.9% fatty marrow, while the remaining 34.1% of tissues consisted of trabecular bone remnants capped by cortical bone with an appreciable borderline still apparent between neighboring areas of pristine bone (Figure 7).
 | Figure 7Overview of fresh (A) and diseased (C) extraction sites day 90. Note the greater quantity of mature bone marrow formation at (A) vs. delayed healing and retained bone trabeculae at (C). Also, note cortical bone bridge at fresh (B) and diseased (D) extraction sites day 90. Note reversal line between pristine and new bone (white arrows). H&E, original magnification ×16 and ×200.
H&E: hematoxylin and eosin.
|
DISCUSSION
The aim of the present study was to evaluate the healing patterns in tooth extraction sites with a history of periodontal and endodontic pathology using a canine model. The healing dynamics and tissue changes in fresh extraction sockets in the present study concur with those reported in a previous study [3]. However, healing in diseased extraction sockets appeared to be delayed, suggesting that periodontal and endodontic pathology may critically compromise extraction socket healing, affecting bone formation and remodeling.
The present study combined canine models designed to create endodontic [9] and periodontal lesions [10] to produce periodontal and endodontic pathology. In our previous investigation [7], erratic extraction socket healing was classified into 3 categories: pathologies of endodontic, periodontal, and combined periodontal and endodontic origin. The prevalence of periodontal pathology was shown to be the highest (72%), but the manifestation of other lesions, such as combined lesions (11%) and lesions of unknown origin (14%), is difficult to ignore. Moreover, the clinical features found in erratically healed extraction sites are the end results of processes with an ambiguous origin and are very difficult to assess. Therefore, a comprehensive model that may be representative of periodontal and endodontic pathology was designed and used.
Radiographic observations from baseline to extraction showed sclerotic changes in the periapical lesion, with increasing density as healing progressed. These sclerotic changes may be regarded as a protective immune response of the bone to chronic pulpitis or low-virulence infections, which can be diagnosed as condensing osteitis when symptoms become chronic and severe [161718]. These changes in the bone are thought to negatively affect bone marrow formation and to induce atrophy [19].
In the present study, distinct healing patterns were observed in diseased versus healthy sites. The apical regions of diseased sites showed smoothened bone surfaces with minimal peaks and images of collapsed Volkmann canals, in contrast to the patent canals and more rugged extraction socket walls observed in the fresh extraction sites. Since Volkmann canals are a vital component of the alveolar vascular plexus, their occlusion would suggest a significant reduction in the healing capacity of the diseased sites [20]. Moreover, principal periodontal ligament fibers displayed a tendency to run perpendicular to the bundle bone in the fresh extraction sockets, whereas fibers aligned parallel to the bundle bone in the diseased sites. As healing progressed through day 7, granulation tissue with infiltration of inflammatory cells, distinguishable from the granulation tissue found in the fresh extraction sites, was observed in the coronal and apical aspects of the diseased sites. No differences other than an apparently hastened resolution of the fibrin clot in the diseased extraction sites were observed, which is thought to be a result of inflammatory cells acting to accelerate healing. In contrast, healing on days 7 through 30 and 60 showed suggestions of delayed wound healing in the diseased extraction sites. The replacement of fibrovascular tissue with trabecular bone and maturation into bone marrow was delayed. This delay appeared more evident in the late healing phase of the study, on days 60 and 90.
Histometric observations in the present study exhibited differences with an earlier, partially parallel study. At day 30, fibrous tissue content approximated 28% in fresh extraction sites, compared with 12% representing provisional matrix in a previous study [3]. In the diseased sites, however, fibrous tissue approximated 52% of the extraction site, which is considerably less than the figure of 88% reported in the previous study. Moreover, bone marrow formation/maturation appeared slightly advanced in fresh sites where it was first evident on day 30, in comparison to day 60 in the diseased sites. On days 60 and 90, the fresh extraction sites exhibited near-complete tissue maturation, with bone marrow comprising nearly 80% of the socket, and cortical bone overlying the extraction sites. This corroborates the findings of Cardaropoli et al. [3] showing that bone marrow content comprised 63%–85% of the tissue within 60 days. In the diseased extraction sites, however, bone marrow approximated 45% of the tissue on day 60 and 65% of the tissue on day 90, indicating delayed maturation, with remodeling still in progress. On day 90, remodeling in the fresh extraction sites was almost complete, with no definitive borders between the pristine bone and the newly formed cortical bone, whereas the diseased extraction sites displayed a clear demarcation between pristine areas and newly formed bone.
In conclusion, within the limitations of this exploratory study, it can be concluded that local morphologic and other alterations to the alveolar bone due to endodontic and periodontal pathology may contribute to the erratic and delayed extraction socket healing patterns observed in clinical settings [7]. The diseased extraction socket model attempts to simulate such clinical pathology and may be interpreted to suggest that a history of periodontal and endodontic pathology may compromise extraction socket healing, thereby negatively affecting bone formation and remodeling. Nevertheless, further study is necessary to establish this preclinical model to confirm the observations obtained in the present exploratory study.
 XML Download