

 PDF
PDF ePub
ePub Citation
 Print
Print


INTRODUCTION
Oral wound healing is essential to maintain the integrity of the stomatognathic system. Oral wound healing has evolutionarily developed to regenerate oral soft and hard tissues after small injuries, tooth extraction, or invasive therapies, including periodontal surgery and implant placement [1]. Oral wound healing usually occurs faster than skin wound healing, with even less scar formation [2]. Nevertheless, wound healing can be impaired, for example in elderly patients, in patients with diabetes, and after radiotherapy. These are well-described clinical observations, but the underlying pathological mechanisms have not fully been discovered. The pathological mechanisms may at least involve a decreased responsiveness of the cells to the local microenvironment, as defined by growth factors and other conditions such as matrix proteins, pH, and oxygen tension. The molecular control of the coordinated sequence of cellular events during impaired wound healing is beginning to be uncovered.
Transforming growth factor-β1 (TGF-β1) is a pleiotropic growth factor and a key regulator of wound healing events [34]. The 2 TGF receptor types, TGF-β receptor type I (TGF-βRI) and TGF-β receptor type II (TGF-βRII) dimerize in response to ligand binding and signal via the corresponding intracellular receptor kinase [5], ultimately causing the expression of their target genes, including interleukin-11 (IL11) [6], proteoglycan 4 (PRG4) [7], and NADPH oxidase 4 (NOX4) [8]. Oral fibroblasts from the gingiva and other mesenchymal cells change IL11, PRG4, and NOX4 expression upon activation of TGF-β signaling [9]. TGF-β signaling is affected by age, but diabetes has been reported to impact its function in cartilage [10] and microglial cells [11]. Mouse models suggest that dietary fat and aging lead to atypical TGF-β1 signaling in the hypothalamus [12]. Even though there is only indirect evidence from mouse genetic studies that impaired oral wound healing may involve atypical TGF-β signaling [13], it is reasonable to hypothesize that by improving the responsiveness of oral cells to TGF-β, impaired oral wound healing may be overcome.
Epigenetic mechanisms, mainly caused by DNA methylation, are involved in the fine-tuning of gene expression. In line with this general concept, aging [14] and metabolic disorders such as diabetes [15] and osteoporosis [16] have been associated with epigenetic modifications. DNA methylation is catalyzed by DNA methyltransferases (DNMTs), a family of enzymes including DNMT1, DNMT3A, and DNMT3B [17]. DNMTs place a methyl group next to guanosine (CpG) dinucleotides, which are not evenly distributed in the genome, frequently building clusters in the promoter regions of genes [17]. For example, DNA methylation in the only CpG island located in the IL11 gene can predict an individual's response to antidepressant agents [18]. The role of DNA methylation in NOX4 expression remains unclear [19], and CpG islands have not been reported for PRG4. In the present study, we investigated whether inhibitors of DNA methylation supported responsiveness to TGF-β1 in oral fibroblasts.
5-aza-2'-deoxycytidine (5-aza; Decitabine), a drug for the treatment of myelodysplastic syndromes, is an inhibitor of DNMTs, thereby resulting in DNA hypomethylation [20]. 5-aza is thus a valuable tool for in vitro research on the impact of DNA methylation on the cellular response to growth factors, including TGF-β1. For example, inhibition of DNMTs with 5-aza in breast adenocarcinoma cells increased the TGF-β1-induced expression of tropomyosin-1 and the formation of stress fibers [21]. Additionally, 5-aza has been found to decrease the expression of TGF-β1 target genes, such as α-smooth muscle actin in kidney epithelial cells [22], lung fibroblasts [23], and hepatic stellate cells [24]. In addition to changes in the methylation pattern of the promoters of the target genes, 5-aza increased TGF-βRII signaling in human gastric cancer cell lines [25] and TGF-βRII in renal cell carcinoma [26], changing cell sensitivity to TGF-β. Thus, it is reasonable to suggest that 5-aza may also make periodontal fibroblasts more responsive to TGF-β1.
The present study extends pioneering research on epigenetics in periodontal research that has investigated methylation changes in the promoter regions of disease-relevant genes coding for extracellular matrix proteins [27], chemokines and cytokines [282930], and signaling molecules [3132]. The importance of this research is underscored by recent reviews on epigenetics in periodontal disease [3334]. Herein, we aimed to test the hypothesis that inhibition of DNA methylation would increase the expression of TGF-β target genes in oral fibroblasts in vitro.
MATERIALS AND METHODS
Primary gingival fibroblasts
Human gingival fibroblasts were prepared from explant cultures of 3 independent donors after approval of the ethical committee of the Medical University of Vienna (EK Nr. 631/2007). Cells were cultured in a humidified atmosphere at 37°C in growth medium consisting of Dulbecco's Modified Eagle Medium, 10% fetal calf serum, and 1% antibiotics (Invitrogen Corporation, Carlsbad, CA, USA). Cells were plated in growth medium at 30,000 cells/cm2 into culture dishes.
Cell stimulation
The following day, cells were exposed to 5-aza-2'-deoxycytidine (Sigma-Aldrich, St. Louis, MO, USA) at 5 µM with daily medium changes for 72 hours [3536]. This concentration of 5-aza had no negative impact on cell viability, as indicated by the formation of formazan crystals (data not shown). Cells were then exposed to recombinant human TGF-β1 (PeproTech, Rocky Hill, NJ, USA) at 5 ng/mL before the gene expression analysis was performed. Pharmacologic inhibition of TGF-βRI kinase was performed with SB431542 (Calbiochem®, Merck, Billerica, MA, USA) at 10 µM [9].
Quantitative real-time polymerase chain reaction (PCR) analysis
Total RNA was isolated with a High Pure RNA Isolation Kit (Hoffmann-La Roche, Basel, Switzerland). Reverse transcription was performed with Transcriptor Universal cDNA Master (Hoffmann-La Roche). PCR was done with the FastStart Universal SYBR Green Master (Hoffmann-La Roche) on a 7500 Real-Time PCR System (both Applied Biosystems, Life Technologies Corporation, Carlsbad, CA, USA). The primer sequences are indicated in Table 1. The mRNA levels were calculated by normalizing to the housekeeping gene glyceraldehyde 3-phosphate dehydrogenase (GAPDH) using the ΔΔCt method.
Table 1
Primer sequences
IL11: interleukin-11, PRG4: proteoglycan 4, NOX4: NADPH oxidase 4, DNMT: DNA methyltransferase, TGF-βRI: transforming growth factor-β receptor type I, TGF-βRII: transforming growth factor-β receptor type II, GAPDH: glyceraldehyde 3-phosphate dehydrogenase.
![]()
IL11 DNA methylation
DNA extracted from gingival fibroblasts (Hoffmann-La Roche) upon 5-aza treatment was digested by 4 methylation-sensitive restriction enzymes (HpaII, Hin6I, AciI, HpyCH4IV); 5 ng of digested and mock-digested controls were then subjected to PCR amplification using a control PCR (amplifying the imprinted genes H19 and IGF2; the X-chromosomal genes XIST and FMR1; and ABL1 and PITX2, which are non-methylated in non-cancerous DNA) testing for completion of the digestion of non-methylated DNA. Amplification using primers (IL11-forward: CTGGGAGCAGGGGAAGGAGCC and IL11-reverse: CTCTGCCCCTCTCCGCCCAG) targeting the CpG island (hg19: chr19:55880578-55880922) in the IL11 genomic region were used to test DNA methylation changes upon 5-aza treatment. Positive amplification generated from methylated DNA upon restriction confirmed hypermethylation. DNA restriction digestion, control PCR testing the completion of digestion, and IL11-PCR were conducted under conditions described previously [37]. Amplicons were visualized on 2% agarose gels.
Statistical analysis
Experiments were repeated at least twice with cells from 2 to 3 different donors, and the data are reported as the median, minimum, and maximum. The paired t-test was used for analysis, with P values <0.05 considered to indicate statistical significance (Excel, Microsoft Corporation, Redmond, WA, USA). The statistical analyses were based on fold-change values or log-transformed values, as indicated in the respective figures.
RESULTS
TGF-β1 increased the expression of its target genes with and without 5-aza
We first performed an experiment to examine the expression of TGF-β target genes. As expected [9], TGF-β1 considerably increased the expression of IL11 (10.79-fold; P=0.013), PRG4 (12.64-fold; P=0.139), and NOX4 (22.37-fold; P=0.008) without 5-aza; and of IL11 (13.39-fold; P=0.008), PRG4 (25.64-fold; P=0.042), and NOX4 (32.60-fold; P=0.004) with 5-aza (Figure 1, Table 2).
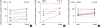 | Figure 1TGF-β1 increased the respective target genes with and without 5-aza. Human gingival fibroblasts were exposed to 5-aza or left untreated for 72 hours, before cells were stimulated with recombinant human TGF-β1. After 24 hours, the gene expression analysis was performed. (A) IL11 (n=10), (B) PRG4 (n=7), (C) NOX4 (n=11); data from individual experiments, denoted with separate colors, indicate the x-fold changes of gene expression in response to TGF-β1 compared to unstimulated cells. P values were obtained from the paired t-test. Statistical analyses were based on fold-change values of single cell donors and experiments. The colors represent data from different cell donors and experiments.
TGF-β1: transforming growth factor-β1, 5-aza: 5-aza-2'-deoxycytidine, IL11: interleukin-11, PRG4: proteoglycan 4, NOX4: NADPH oxidase 4, w/o: without.
|
Table 2
TGF-β1 increased the respective target genes with and without 5-aza

Human gingival fibroblasts were exposed to 5-aza or left untreated for 72 hours in SF medium, before cells were stimulated with recombinant human TGF-β1. After 24 hours, the gene expression analysis was performed. P values reflect the changes of gene expression in response to TGF-β1 compared to unstimulated cells. Statistical analyses were based on fold-change values and the paired t-test.
TGF-β1: transforming growth factor-β1, 5-aza: 5-aza-2'-deoxycytidine, IL11: interleukin-11, PRG4: proteoglycan 4, NOX4: NADPH oxidase 4, min: minimum, max: maximum, SF: serum-free.
![]()
5-aza moderately increased the expression of TGF-β1 target genes
5-aza alone did not significantly increase the expression of IL11 (1.69-fold P=0.070), PRG4 (1.44-fold; P=0.084), or NOX4 (1.11-fold; P=0.352) (Figure 2, Table 3). However, when normalized for TGF-β1 treated cells, 5-aza enhanced the effect of TGF-β1 on IL11 expression 2.37-fold (P=0.045), but not on the expression of PRG4 (2.03-fold; P=0.128) or NOX4 (1.03-fold; P=0.243). In support of these findings, DNA methylation analysis of IL11 revealed that 5-aza treatment caused demethylation of the previously methylated CpG islands (Figure 3).
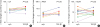 | Figure 25-aza sensitizes cells to TGF-β1 as indicated by IL11 expression. Human gingival fibroblasts were exposed to 5-aza or left untreated for 72 hours, before cells were stimulated with recombinant human TGF-β1. After 24 hours, gene expression analysis was performed. (A) IL11 (n=10), (B) PRG4 (n=7), (C) NOX4 (n=13), with data from different experiments marked with separate colors. Data indicate the x-fold changes in response to 5-aza in untreated and TGF-β1 treated cells, respectively. P values were obtained from the paired t-test. Statistical analyses were based on fold-change values of single experiments. The colors represent data from different cell donors and experiments.
5-aza: 5-aza-2'-deoxycytidine, TGF-β1: transforming growth factor-β1, IL11: interleukin-11, PRG4: proteoglycan 4, NOX4: NADPH oxidase 4, w/o: without.
|
Table 3
5-aza sensitizes cells to TGF-β1 as indicated by IL11 expression

Human gingival fibroblasts were exposed to 5-aza or left untreated for 72 hours, before cells were stimulated with recombinant human TGF-β1 or left in SF medium alone. After 24 hours, the gene expression analysis was performed. P values reflect the ratio of gene expression in response to 5-aza compared to unstimulated cells. Statistical analyses were based on log-transformed values with the paired t-test.
5-aza: 5-aza-2'-deoxycytidine, TGF-β1: transforming growth factor-β1, IL11: interleukin-11, PRG4: proteoglycan 4, NOX4: NADPH oxidase 4, min: minimum, max: maximum, SF: serum-free.
![]()
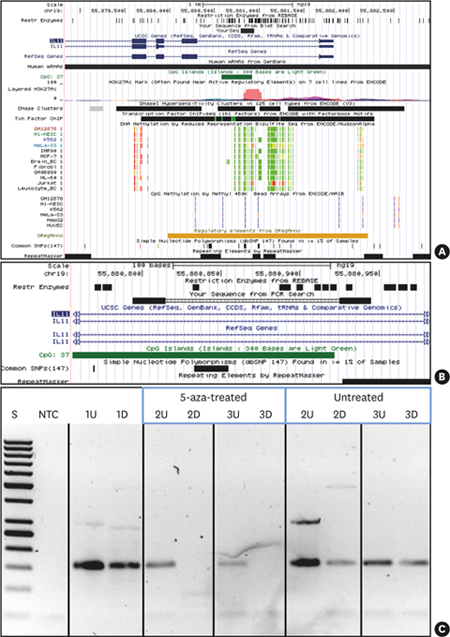
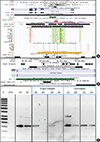 | Figure 35-aza treatment causes demethylation of IL11 CpG island methylation. UCSC genome browser (hg19) view indicating the location of the IL11 CpG island and PCR amplicon investigated. (A) IL11 gene region (UCSC genome browser view; hg19) presenting the targeted CpG island (intron 1 within IL11: dark green) and the PCR product (indicated as black bar denoted “YourSeq”). DNA methylation tracks (methyl reduced representation bisulfite sequencing; light green indicated 0% and red indicated 100% methylated CpGs). Only Jurkat and HeLa show methylation of the IL11 CpG island. (B) detailed location of the IL11 CpG island and PCR amplicon (primers, bold black) and location of methylation-sensitive restriction sites (denoted as “Rest Enzymes”). (C) IL11-PCR DNA methylation testing results. 1, leukocyte DNA from a normal healthy individual (not 5-aza-treated); 2 and 3, fibroblast DNA: 5-aza-treated vs. non-treated as indicated.
5-aza: 5-aza-2'-deoxycytidine, CpG: commonly next to a guanosine, UCSC: University of California, Santa Cruz, IL11: interleukin-11, PCR: polymerase chain reaction, U: undigested, D: digested by methylation-sensitive restriction enzymes, S: 50 bp ladder, NTC: non-template PCR control 1.
|
5-aza increased the expression of TGF-βRII
Making cells more sensitive to a given ligand can involve an increase in the corresponding receptors. As shown in Table 4, 5-aza caused a weak but significant increase in the expression of TGF-βRII (1.40-fold; P=0.009) but not TGF-βRI (1.05-fold; P=0.827). However, TGF-β1 reduced TGF-βRII expression in the presence of 5-aza by 0.41-fold (P=0.011, Tables 4 and 5). Further supporting the involvement of TGF-β signaling, the TGF-βRI kinase inhibitor SB431542 with and without 5-aza impeded the effect of TGF-β1 on the expression of IL11 (P=0.362 and P=0.157, respectively), PRG4 (P=0.388 and P=1.000, respectively), and NOX4 (P=0.612 and P=0.093, respectively) (Table 6).
Table 4
5-aza increases TGF-βRII in gingival fibroblasts, but not in the presence of TGF-β1

Human gingival fibroblasts were exposed to 5-aza or left untreated for 72 hours, before cells were stimulated with recombinant human TGF-β1 or left in SF medium alone. After 24 hours, the gene expression analysis was performed. P values reflect the ratio of gene expression in response to 5-aza compared to unstimulated cells. Statistical analyses were based on log-transformed values with the paired t-test.
5-aza: 5-aza-2'-deoxycytidine, TGF-βRI: transforming growth factor-β receptor type I, TGF-βRII: transforming growth factor-β receptor type II, TGF-β1: transforming growth factor-β1, min: minimum, max: maximum, SF: serum-free.
![]()
Table 5
TGF-β1 increases TGF-βRI without 5-aza and decreases TGF-βRII in the presence of 5-aza

Human gingival fibroblasts were exposed to 5-aza or left untreated for 72 hours in SF medium, before cells were stimulated with recombinant human TGF-β1. After 24 hours, the gene expression analysis was performed. P values reflect the changes of gene expression in response to TGF-β1 compared to unstimulated cells. Statistical analyses were based on fold-change values with the paired t-test.
TGF-β1: transforming growth factor-β1, TGF-βRI: transforming growth factor-β receptor type I, 5-aza: 5-aza-2'-deoxycytidine, TGF-βRII: transforming growth factor-β receptor type II, min: minimum, max: maximum, SF: serum-free.
![]()
Table 6
SB431542 blocks TGF-β1 mediated effects on gene expression

Human gingival fibroblasts were exposed to 5-aza or left untreated in SF medium for 72 hours, before cells were stimulated with recombinant human TGF-β1. After 24 hours, the gene expression analysis was performed. P values reflect the changes of gene expression in response to TGF-β1 compared to unstimulated cells. Statistical analyses were based on fold-change values with the paired t-test.
TGF-β1: transforming growth factor-β1, IL11: interleukin-11, PRG4: proteoglycan 4, NOX4: NADPH oxidase 4, min: minimum, max: maximum, SF: serum-free, 5-aza: 5-aza-2'-deoxycytidine.
![]()
5-aza increased the expression of DNMTs: DNMT1 and DNMT3B
We then investigated whether 5-aza caused the expected compensatory increase in expression of the inhibited DNMTs. 5-aza provoked a significant increase in DNMT1 (1.61-fold; P=0.005) and DNMT3B (1.53-fold; P=0.002), while the increase in DNMT3A failed to reach the level of significance (1.30-fold; P=0.310) (Table 7). Additionally, in the presence of TGF-β1, 5-aza increased DNMT1 (1.41-fold; P=0.015) and DNMT3B (1.54-fold; P=0.067), with the latter not reaching the level of significance.
Table 7
5-aza increases DNMT1 and DNMT3B, with a similar trend in the presence of TGF-β1

Human gingival fibroblasts were exposed to 5-aza or left untreated for 72 hours, before cells were stimulated with recombinant human TGF-β1 or left in serum-free medium alone. After 24 hours, the gene expression analysis was performed. P values reflect the ratio of gene expression in response to 5-aza compared to unstimulated cells. Statistical analyses were based on fold-change values with the paired t-test.
5-aza: 5-aza-2'-deoxycytidine, DNMT: DNA methyltransferase, TGF-β1: transforming growth factor-β1, min: minimum, max: maximum, SF: serum-free.
![]()
DISCUSSION
The study was inspired by research suggesting that not only aging [1438] and diabetes [15], but also diseases marked by chronic inflammation such as periodontal disease [3334], are associated with epigenetic modifications. Impaired oral wound healing may involve methylation, decreasing the responsiveness of cells to growth factors. In particular, the TGF-β1 target genes [21222324] and their respective TGF-β receptors [2526] can be subjected to methylation, thus altering the respective cellular response. Because TGF-β1 is a key player in wound healing, we studied the impact of 5-aza, a DNMTs inhibitor, on the expression of three major TGF-β1 target genes in oral fibroblasts. The main finding of the present study was that 5-aza at least moderately increased the response of gingival fibroblasts to TGF-β1, as indicated by the stronger expression of IL11 in 5-aza-treated cells than was observed in the corresponding controls. The effect of 5-aza on the sensitivity of cells to the respective ligands at least partially involves the increased expression of TGF-βRII in vitro.
If we relate our findings to those of other studies, our data support previous observations that 5-aza modulated the expression of TGF-β target genes in various cell types, including breast adenocarcinoma cells [21], kidney epithelial cells [22], lung fibroblasts [23], and hepatic stellate cells [24]. Consequently, DNA methylation is a central modulator of the TGF-β response in vitro. The present data observed in gingival fibroblasts confirm this observation for IL11. Moreover, our findings that 5-aza increased TGF-βRII expression in gingival fibroblasts are supported by data from renal cell carcinoma [26]. However, it cannot be concluded that 5-aza affects all TGF-β target genes, as only IL11, but not PRG4 and NOX4, was enhanced by the demethylation reagent. Thus, it is unlikely that the moderately higher TGF-βRII levels are particularly relevant, as TGF-β-induced PRG4 and NOX4 expression were not significantly increased by 5-aza. Also reasonable are our data showing an increase of DNMT1 and DNMT3B in response to 5-aza. Taken together, our findings are in line with the basic proposal that demethylation selectively changes the cellular response to TGF-β1, and extend this line of research into the field of periodontal regeneration.
The clinical relevance of our observations remains a matter of speculation. The foundation for this discussion involves detailed knowledge of the role of epigenetic changes in causing age- and disease-related compromised oral wound healing. At present, only limited knowledge has been accumulated on methylation changes in periodontal disease, although relevant results have been obtained regarding extracellular matrix proteins [27], chemokines and cytokines [282930], and signaling molecules [3132]. It is not evident that impaired periodontal regeneration is caused by an inappropriate fibroblast cell response to TGF-β1; however, if this is the case, could this reduction be caused by epigenetic mechanisms? It remains unclear today whether demethylation agents may have a beneficial effect under compromised healing conditions. This possibility also raises questions considering the compensatory feedback response of cells to DNMT blocking. In the present study, 5-aza was used to provoke changes in methylation status in vitro, with no direct clinical implications for possible local oral applications. It should be pointed out that 5-aza, when locally applied, could be harmful to the oral tissue, including the periodontium; thus, the data presented here should be interpreted in the context of an in vitro model.
The present in vitro study has further limitations. First, in vitro studies do not reflect the complex changes of cellular action during the wound healing process and, therefore, should be interpreted as proof-of-principle observations. Second, gingival fibroblasts do not necessarily reflect the responsiveness of other oral cellular types of the mesenchymal lineage, even though it is very likely that, due to the general principles of epigenetics, fibroblasts from the palate and the periodontal ligament would show a similar response. Third, the molecular mechanism of how 5-aza exerts its activity on TGF-β target gene expression has not been fully discovered. However, the question of whether 5-aza changes the methylation status of IL11 promoter regions was at least clearly answered in this study. Fourth, these 3 target genes do not necessarily reflect the complex cellular response to this pleiotropic growth factor. There are possibly other relevant genes sensitive to demethylation reagents in vivo. Finally, 5-aza is not the only DNA demethylation agent, as there are other clinically approved inhibitors of DNMTs. Nevertheless, we selected 5-aza as the most widely used DNMT inhibitor in experimental settings, with clinical approval in oncology. Moreover, gingival fibroblasts served as models for TGF-β responses in oral cells; however, fibroblasts clearly do not represent the complex oral environment, which also contains epithelial cells and the whole spectrum of immune cells. With all of this in mind, the present research must be interpreted with caution.
Our observations, however, can provide a scientific foundation for future research. Interest has emerged in investigating the role of epigenetics in oral wound healing in general, and in particular in periodontal regeneration. For example, topical 5-aza accelerates skin wound healing in rodents [39]. That protocol [39] also increased the expression of TGF-β, and it would be possible to carry out a feed-forward stimulation of this signaling pathway. There is a demand for preclinical studies testing whether 5-aza can support periodontal regeneration following conventional scaling and root planning, and also following regenerative strategies based on local applications of recombinant growth factors and enamel matrix derivatives, particularly because the latter preparations exert a TGF-β-like activity [40]. Also of interest are investigations into the impact of periodontal disease on the methylation status of promoter regions regulating extracellular matrix molecules [29], chemokines and cytokines [30], and signaling molecules [31]. Moreover, the virulence factors of periodontal pathogens such as Porphyromonas gingivalis and Treponema denticola [27] cause epigenetic changes in periodontal cells. Taken together, the data presented here should inspire further research into epigenetics in periodontology, and this information should be used to develop future therapies.
In conclusion, we provide the first insights on the role of 5-aza on TGF-β1-induced IL11 expression in gingival fibroblasts. The findings support the overall proposal that DNMTs are a molecular target for increasing the response of particular TGF-β target genes with a possible role in periodontal tissue regeneration.
 XML Download