Journal List > J Periodontal Implant Sci > v.47(1) > 1108019

Kim, Kang, Park, Kim, Yi, and Kim: Improved accuracy in periodontal pocket depth measurement using optical coherence tomography

Abstract

Purpose

The purpose of this study was to examine whether periodontal pocket could be satisfactorily visualized by optical coherence tomography (OCT) and to suggest quantitative methods for measuring periodontal pocket depth.

Methods

We acquired OCT images of periodontal pockets in a porcine model and determined the actual axial resolution for measuring the exact periodontal pocket depth using a calibration method. Quantitative measurements of periodontal pockets were performed by real axial resolution and compared with the results from manual periodontal probing.

Results

The average periodontal pocket depth measured by OCT was 3.10±0.15 mm, 4.11±0.17 mm, 5.09±0.17 mm, and 6.05±0.21 mm for each periodontal pocket model, respectively. These values were similar to those obtained by manual periodontal probing.

Conclusions

OCT was able to visualize periodontal pockets and show attachment loss. By calculating the calibration factor to determine the accurate axial resolution, quantitative standards for measuring periodontal pocket depth can be established regardless of the position of periodontal pocket in the OCT image.

Graphical Abstract

jpis-47-13-abf001

INTRODUCTION

Non-invasive and early-stage diagnostic tools are important for better prognoses and health care [1]. Among newly developed imaging techniques, optical coherence tomography (OCT) has been anticipated to be a promising diagnostic method. OCT already has been adopted for various applications in some fields of medicine—especially in ophthalmology—since its introduction in 1991 [234567]. In dentistry, the first study using OCT was reported in 1998, and its potential application for imaging in the oral cavity has been proposed in other studies in the literature [89]. The use of OCT in evaluating tooth cracks, microleakage between the tooth and restorative materials, caries lesions, mucosal disease, oral cancer, calculus deposition, gingival thickness, sulcus depth, and periodontal ligament changes along with orthodontic movement has been reported [11011121314151617].
Currently, to assess periodontal disease, periodontal pocket depth and clinical attachment levels are evaluated with periodontal probing, and the alveolar bone level is observed by radiographic imaging. Although periodontal probing is a frequently used clinical examination method, its reliability and reproducibility are inconsistent. Radiographic imaging may underestimate bone loss, which can make early detection difficult [118].
OCT is a non-invasive, non-radioactive, high-resolution imaging technique that can serve as an alternative diagnostic method [19]. Previous studies using OCT have obtained images of healthy periodontal tissue and measured gingival sulcus depth within the normal range, but not in compromised periodontal tissue. Considering that periodontal pocket depth may be measured differently depending on the position of periodontal pocket in the OCT image, a quantitatively computed method needs to be devised.
The purpose of this study was to examine whether the deep sulcus could be satisfactorily visualized by OCT equipment and to suggest quantitative methods for measuring sulcus depth.

MATERIALS AND METHODS

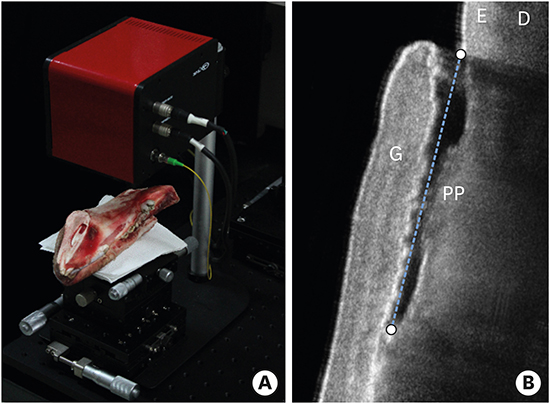
A swept-source OCT system (Oz-tec Co. Ltd., Daegu, Korea) was employed in this study. The central wavelength was 1,310±10 nm at a 50-kHz sweep rate, and the average output power was 16 mW. The system captured 500 frames per second, with an axial resolution in air of 8 μm/pixel and a lateral resolution of 10.03 μm/pixel. To evaluate the detectability of periodontal pocket depth under the gingiva, the mandible of the porcine model was sectioned, aiming to preserve the dental structures and periodontal tissues (Figure 1A). The porcine sample was stored in saline and lightly air-dried before OCT imaging. Artificial gaps measuring 3 mm, 4 mm, 5 mm, and 6 mm in depth between the gingival tissue and the tooth surface were created using a periodontal probe marked to measure the depth of periodontal pockets.
Figure 1
The porcine mandibular sample positioned for OCT imaging acquisition (A) and the OCT images obtained of the target area (B) showing the dental structures.
OCT, optical coherence tomography; G, gingiva; E, enamel, D, dentin; PP, periodontal pocket.
jpis-47-13-g001
OCT images of periodontal pockets at various depths were captured as raw data and averaged to improve the quality of the images using software package (MATLAB, MathWorks, Natick, MA, USA). After image processing of the obtained OCT images, we attempted to measure the periodontal pocket depth. Lateral resolution of the OCT image is a fixed value according to the objective lens of the probe, while the resolution in the axial direction depends on the properties of the materials through which the light is transmitted [20]. Therefore, it was necessary to measure the actual axial resolution in order to determine the exact sulcus depth.
To calculate the real axial resolution, we acquired the OCT image of a calibration phantom of known length between the gingiva and the tooth of the bone sample. The axial resolution, α, could be determined using the following equation for calculating the distance between 2 points.
d=α2·x2-x12+β2·y2-y12jpis-47-13-e001
The (x1, y1) and (x2, y2) coordinates corresponded to the 2 end points of the phantom in the 2-dimensional OCT image. As mentioned above, the lateral resolution, β, was 10.03 μm, and the actual length of the calibration phantom, d, was 3 mm. To acquire the accurate axial resolution, the α values were averaged by performing several calculations, changing the angle between the calibration phantom and the optical axis.
Subsequently, we measured periodontal pocket depth in the OCT images using this equation with corrected axial resolutions. Periodontal depth was defined as the distance between the gingival margin and the bottom of periodontal pocket [18]. The mean and standard deviation were calculated 15 times for each case and compared with the actual depth.

RESULTS

Enamel layer (E) is shown overlapping with the dentin (D), and periodontal pocket is indicated by a dotted line between the detached gingiva (G) and the tooth (Figure 1B). The length of the dotted line was measured as periodontal pocket depth.
Figure 2A shows the porcine sample prepared for calibration of the axial resolution of the OCT image with the calibration phantom inserted between the gingiva and the tooth surface. Figure 2B and C are the images taken when the calibration phantom was aligned with the optical axis and the angle between the calibration phantom and the optical axis was 20°.
Figure 2
The porcine sample for calibration of the axial resolution of the OCT image and the calibration phantom between the gingiva and the tooth surface (A). OCT images of the sample with 0° (B) and 20° (C) of imaging inclination.
OCT, optical coherence tomography
jpis-47-13-g002
Figure 3A shows the manual probing of periodontal pocket depth of the porcine sample, and the obtained values were 3 mm, 4 mm, 5 mm, and 6 mm for each sample. The average sulcus depth measured by OCT was 3.10±0.15 mm, 4.11±0.17 mm, 5.09±0.17 mm, and 6.05±0.21 mm for Figure 3B-E, respectively. These values were similar to those obtained by manual periodontal probing.
Figure 3
Measuring the periodontal pocket depth of a porcine sample by manual probing (A) and the OCT images of each sample at the depths of 3 mm (B), 4 mm (C), 5 mm (D), and 6 mm (E).
OCT, optical coherence tomography.
jpis-47-13-g003

DISCUSSION

Periodontitis is an inflammatory reaction caused by bacterial infection that leads to attachment loss of the connective tissue and ultimately to alveolar bone loss [21]. The degree of attachment of periodontal tissue is an important parameter for assessing periodontal status, and a minimum diagnostic threshold was suggested by utilizing clinical attachment level and periodontal probing depth [22].
In this study, periodontal attachment loss was intentionally induced, and it was confirmed that periodontal pocket could be identified by the OCT imaging technique. Furthermore, a unique contribution of this study is that it presented a novel quantitative method of calculating the periodontal pocket depth considering the axial resolution of light passing through the gingiva.
Previous studies related to the diagnosis of periodontal disease by OCT have mainly focused on qualitative aspects and observed tissue contour, gingival sulcus, calculus deposition, and connective tissue attachment [23]. Because the resolution in the axial direction is affected by the medium through which the light passes, it is necessary to calculate the axial resolution in the gingiva. In addition, in order to be used in clinical practice, the optical probe should be applied not only to the anterior area but also to the posterior area and to each side of the teeth; thus, the axial resolution needs to be taken into consideration to obtain reliable values in any position.
Quantitative measurements in OCT images can be widely applied to diagnose periodontal status. Measuring the degree of attachment level helps to assess the severity of periodontal disease and monitor improvements in treatment. Gingival thickness can be measured to determine the soft-tissue biotype, which can affect tissue response and treatment planning [24]. Soft-tissue dimension is important for the successful treatment of dental implant and aesthetic restoration [2526]. They can also be used to harvest grafts during root coverage procedures and to evaluate results during wound healing period.
As current diagnostic methods have some drawbacks, OCT technology can complement them. Conventional periodontal probing has inherent limitations in reliability and reproducibility due to various sources of error, including the instrument, the patient, the examiner, and disease status [27282930]. Moreover, periodontal probe often penetrates into gingival connective tissue, which is discomforting to patients. A comparison of patient perceptions of gingival sulcus depth measurement using a conventional probe and OCT showed that none of the subjects who underwent OCT felt discomfort, since the device was non-invasive [18]. While the buccal and lingual surfaces are obscured and cannot be seen in 2-dimensional radiographs, OCT imaging—a so-called “optical biopsy”—can visualize them by direct transmission. Because periodontal attachment loss precedes radiologically observed alveolar bone loss, early detection can be achieved using OCT images capable of showing the microstructure of periodontium [3132].
From the results of this study, it can be concluded that OCT could visualize periodontal pockets and show attachment loss. By calculating the calibration factor to determine the accurate axial resolution, a quantitative standard measuring periodontal pocket depth can be established regardless of the position of periodontal pocket in the OCT image. Within the limit of this study, OCT showed corresponding periodontal pocket depth with manual probing and its diagnostic potential for periodontitis.

Notes

Funding This research was supported by the Bio & Medical Technology Development Program of the National Research Foundation funded by Ministry of Science, ICT and Future Planning (NRF-2016M3A9E2925364) and the Technology Innovation Program (10052089) funded by the Ministry of Trade, Industry and Energy of Korean government.

Author Contributions Conceptualization: Won-Jin Yi, Tae-Il Kim; Data curation: Won-Jin Yi, Tae-Il Kim; Formal analysis: Hee-Jung Park; Funding acquisition: Won-Jin Yi, Tae-Il Kim; Investigation: Sul-Hee Kim, Se-Ryong Kang, Hee-Jung Park, Jun-Min Kim; Methodology: Won-Jin Yi, Tae-Il Kim; Project administration: Won-Jin Yi, Tae-Il Kim; Resources: Sul-Hee Kim, Se-Ryong Kang, Hee-Jung Park, Jun-Min Kim; Software: Jun-Min Kim, Se-Ryong Kang; Supervision: Tae-Il Kim; Validation: Won-Jin Yi, Tae-Il Kim; Visualization: Jun-Min Kim, Se-Ryong Kang; Writing - original draft: Sul-Hee Kim, Se-Ryong Kang, Hee-Jung Park, Jun-Min Kim; Writing - review & editing: Won-Jin Yi, Tae-Il Kim.

Conflict of Interest No potential conflict of interest relevant to this article was reported.

References

1. Mota CC, Fernandes LO, Cimões R, Gomes AS. Non-invasive periodontal probing through fourier-domain optical coherence tomography. J Periodontol. 2015; 86:1087–1094.
crossref
2. Huang D, Swanson EA, Lin CP, Schuman JS, Stinson WG, Chang W, et al. Optical coherence tomography. Science. 1991; 254:1178–1181.
crossref
3. Adhi M, Duker JS. Optical coherence tomography--current and future applications. Curr Opin Ophthalmol. 2013; 24:213–221.
4. Sattler E, Kästle R, Welzel J. Optical coherence tomography in dermatology. J Biomed Opt. 2013; 18:061224.
crossref
5. Kirtane TS, Wagh MS. Endoscopic optical coherence tomography (OCT): advances in gastrointestinal imaging. Gastroenterol Res Pract. 2014; 2014:376367.
crossref
6. Ferrante G, Presbitero P, Whitbourn R, Barlis P. Current applications of optical coherence tomography for coronary intervention. Int J Cardiol. 2013; 165:7–16.
crossref
7. Cheng HM, Guitera P. Systematic review of optical coherence tomography usage in the diagnosis and management of basal cell carcinoma. Br J Dermatol. 2015; 173:1371–1380.
crossref
8. Colston BW Jr, Everett MJ, Da Silva LB, Otis LL, Stroeve P, Nathel H. Imaging of hard- and soft-tissue structure in the oral cavity by optical coherence tomography. Appl Opt. 1998; 37:3582–3585.
crossref
9. Feldchtein F, Gelikonov V, Iksanov R, Gelikonov G, Kuranov R, Sergeev A, et al. In vivo OCT imaging of hard and soft tissue of the oral cavity. Opt Express. 1998; 3:239–250.
10. Imai K, Shimada Y, Sadr A, Sumi Y, Tagami J. Noninvasive cross-sectional visualization of enamel cracks by optical coherence tomography in vitro . J Endod. 2012; 38:1269–1274.
crossref
11. Ishibashi K, Ozawa N, Tagami J, Sumi Y. Swept-source optical coherence tomography as a new tool to evaluate defects of resin-based composite restorations. J Dent. 2011; 39:543–548.
crossref
12. Shimada Y, Sadr A, Burrow MF, Tagami J, Ozawa N, Sumi Y. Validation of swept-source optical coherence tomography (SS-OCT) for the diagnosis of occlusal caries. J Dent. 2010; 38:655–665.
crossref
13. Di Stasio D, Lauritano D, Romano A, Salerno C, Minervini G, Minervini G, et al. In vivo characterization of oral pemphigus vulgaris by optical coherence tomography. J Biol Regul Homeost Agents. 2015; 29:39–41.
14. Tsai MT, Lee CK, Lee HC, Chen HM, Chiang CP, Wang YM, et al. Differentiating oral lesions in different carcinogenesis stages with optical coherence tomography. J Biomed Opt. 2009; 14:044028.
crossref
15. Hsieh YS, Ho YC, Lee SY, Lu CW, Jiang CP, Chuang CC, et al. Subgingival calculus imaging based on swept-source optical coherence tomography. J Biomed Opt. 2011; 16:071409.
crossref
16. Kao MC, Lin CL, Kung CY, Huang YF, Kuo WC. Miniature endoscopic optical coherence tomography for calculus detection. Appl Opt. 2015; 54:7419–7423.
crossref
17. Baek JH, Na J, Lee BH, Choi E, Son WS. Optical approach to the periodontal ligament under orthodontic tooth movement: a preliminary study with optical coherence tomography. Am J Orthod Dentofacial Orthop. 2009; 135:252–259.
crossref
18. Fernandes LO, Mota CC, de Melo LS, da Costa Soares MU, da Silva Feitosa D, Gomes AS. In vivo assessment of periodontal structures and measurement of gingival sulcus with optical coherence tomography: a pilot study. J Biophotonics. Forthcoming. 2016.
19. Agrawal P, Sanikop S, Patil S. New developments in tools for periodontal diagnosis. Int Dent J. 2012; 62:57–64.
crossref
20. Fujimoto JG. Optical coherence tomography for ultrahigh resolution in vivo imaging. Nat Biotechnol. 2003; 21:1361–1367.
crossref
21. Armitage GC. Clinical evaluation of periodontal diseases. Periodontol 2000. 1995; 7:39–53.
crossref
22. Savage A, Eaton KA, Moles DR, Needleman I. A systematic review of definitions of periodontitis and methods that have been used to identify this disease. J Clin Periodontol. 2009; 36:458–467.
crossref
23. Xiang X, Sowa MG, Iacopino AM, Maev RG, Hewko MD, Man A, et al. An update on novel non-invasive approaches for periodontal diagnosis. J Periodontol. 2010; 81:186–198.
crossref
24. Kao RT, Pasquinelli K. Thick vs. thin gingival tissue: a key determinant in tissue response to disease and restorative treatment. J Calif Dent Assoc. 2002; 30:521–526.
25. Thoma DS, Mühlemann S, Jung RE. Critical soft-tissue dimensions with dental implants and treatment concepts. Periodontol 2000. 2014; 66:106–118.
crossref
26. Lee A, Fu JH, Wang HL. Soft tissue biotype affects implant success. Implant Dent. 2011; 20:e38–47.
crossref
27. Grossi SG, Dunford RG, Ho A, Koch G, Machtei EE, Genco RJ. Sources of error for periodontal probing measurements. J Periodontal Res. 1996; 31:330–336.
crossref
28. van der Velden U, de Vries JH. The influence of probing force on the reproducibility of pocket depth measurements. J Clin Periodontol. 1980; 7:414–420.
crossref
29. Badersten A, Nilvéus R, Egelberg J. Reproducibility of probing attachment level measurements. J Clin Periodontol. 1984; 11:475–485.
crossref
30. Watts TL. Probing site configuration in patients with untreated periodontitis. A study of horizontal positional error. J Clin Periodontol. 1989; 16:529–533.
crossref
31. Hsieh YS, Ho YC, Lee SY, Chuang CC, Tsai JC, Lin KF, et al. Dental optical coherence tomography. Sensors (Basel). 2013; 13:8928–8949.
crossref
32. Goodson JM, Haffajee AD, Socransky SS. The relationship between attachment level loss and alveolar bone loss. J Clin Periodontol. 1984; 11:348–359.
crossref
TOOLS
ORCID iDs

Sul-Hee Kim
https://orcid.org/http://orcid.org/0000-0001-8475-881X

Se-Ryong Kang
https://orcid.org/http://orcid.org/0000-0002-0016-1790

Hee-Jung Park
https://orcid.org/http://orcid.org/0000-0002-6789-9247

Jun-Min Kim
https://orcid.org/http://orcid.org/0000-0003-3443-4862

Won-Jin Yi
https://orcid.org/http://orcid.org/0000-0002-5977-6634

Tae-Il Kim
https://orcid.org/http://orcid.org/0000-0003-4087-8021

Similar articles