

 PDF
PDF ePub
ePub Citation
 Print
Print


INTRODUCTION
The junctional epithelium (JE) on the tooth surface is the only epithelium in which keratinocytes physiologically cover solid foreign substrates in the human body. The JE consists of human gingival keratinocytes (HGKs) and seals the gap between the teeth and the gingival connective tissue to protect against the invasion of bacteria or toxins. The JE, which originates from the reduced enamel epithelium covering the erupting tooth, attaches to the enamel surface, which has a relatively smooth topography [1]. However, after tooth eruption, the substrate to which the JE attaches is altered by various physicochemical factors. Abrasion as a result of tooth brushing or chemical erosion may roughen the tooth surface to varying degrees [2]. The downward migration of the JE from the harder enamel surface with aging extends the JE to the rougher root surface, and also exposes the softer root surface [34]. Abrasion or erosion, though mild on the harder enamel surface, can be severe on the softer root surface. JE may also develop on root surfaces that are roughened during periodontal treatments. Scaling or root planing may make deep scratches during the removal of calculus or debris from the root surfaces [56]. In addition, in the progression of pathological peri-implantitis or marginal bone loss after dental implant therapy, the JE also migrates from the surface of the relatively smooth abutment to the fixture, which has a roughened surface, mostly due to acid-etching or titanium blasting to promote osseointegration [78]. Thus, the behavior of HGKs on rough substrates is crucial for understanding the physiology and pathology of the epithelial seal between the tooth and the gingiva. Numerous studies have already investigated the responses of mesenchymal cells, such as osteoblasts, to rough substrates [78]. However, the influence of substrate roughness on HGKs remains largely unknown, although the responses of the epithelial keratinocytes to substrate roughness would be expected to be distinct from those of mesenchymal cells. Epithelial cells cannot secrete extracellular matrix onto substrates, whereas mesenchymal cells can secrete extracellular matrix to reduce the influence of the substrate topology. Thus, it is probable that epithelial keratinocytes are affected by the surface topology differently than mesenchymal cells.
Because the intercellular junctions of keratinocytes are essential for the establishment of an epithelial barrier against the invasion of bacteria or toxins, the development of intercellular junctions of gingival keratinocytes on rough substrates may be one of the most important subjects in periodontal research [1]. In particular, the JE that develops on a solid surface is regarded as a major route through which bacteria invade the gingival tissue, resulting in gingivitis or periodontitis. However, to the best of our knowledge, no previous study has investigated the intercellular junctions of oral keratinocytes on rough substrates. Because E-cadherin is the major component of the intercellular junction of the epithelial seal in the JE [9], the present study investigated the influence of substrate roughness on E-cadherin junction (ECJ) development in HGKs and revealed that the ECJs of HGKs developed slowly or defectively on rough substrates compared with smooth substrates. In addition, the present study also demonstrated that F-actins, which re-organize during ECJ development, were closely associated with the slow or defective development of ECJs in HGKs on rough substrates.
Go to : 
MATERIALS AND METHODS
Preparation of rough substrates
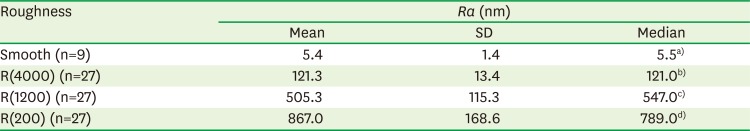
Rough polystyrene substrates were prepared for the HGK culture according to our previously described methods [10]. Hydrophobic polystyrene culture dishes were rubbed with silicon carbide papers (#4000 for the low-nanometer dimension, #1200 for the mid-nanometer dimension, and #200 for the high-nanometer dimension) under wet conditions for 3–4 minutes. In our previous reports, we showed that the roughness value rapidly increased during the first 2 minutes after the beginning of the rubbing and then remained stable [10]. Biases in the orientation of the scratches were reduced by moving the silicon papers in multiple directions. The substrate roughness was measured using an atomic force microscope (XE-100, Park Systems, Suwon, Korea). Three samples were obtained from each polystyrene dish. The roughness value of each sample was measured at 3 points. The roughness value of the smooth culture dish was measured at 3 points in each hydrophobic polystyrene dish. Substrates with the following average roughness (Ra) were obtained: 121.3±13.4 nm by rubbing with #4000 silicon carbide papers, 505.3±115.3 nm by rubbing with #1200 silicon carbide papers, 867.0±168.6 nm by rubbing with #200 silicon carbide papers, and 5.4±1.4 nm for the smooth dishes (Table 1, Figure 1). The Ra value of the enamel surface has been reported to be in the range of 37.0–127.9 nm [1112]. The Ra value of the root surface has been reported to be in the range of 0.41–1.12 µm [4]. Various methods of root planing have been reported to produce a root surface roughness in the range of 0.35–4.90 µm depending on the instruments used [451314]. The plates with an Ra value corresponding to a high-nanometer dimension (867.0±168.6 nm) and a mid-nanometer dimension (505.3±115.3 nm) were rougher than the enamel surface and within the range of the Ra reported on the untreated root surface or the root surface after root planing. Thus, the substrates with an Ra value corresponding to a low-nanometer dimension (121.3±13.4 nm) represented enamel surface that has been roughened physiologically to a greater or lesser extent. Acid-etching produces a roughened enamel surface in the range of 150–450 nm [1112]. The substrates with an Ra corresponding to a high-nanometer dimension (867.0±168.6 nm) and a mid-nanometer dimension (505.3±115.3 nm) represented untreated root surfaces or root surfaces after root planing. The 3 types of culture dishes with varying levels of roughness produced by this method showed a significant difference in the Ra (P<0.05). The substrates were coated with fibronectin (0.2–0.4 mg/mL) to facilitate cell adhesion because rubbing the surface exposed the hydrophobic polystyrene.
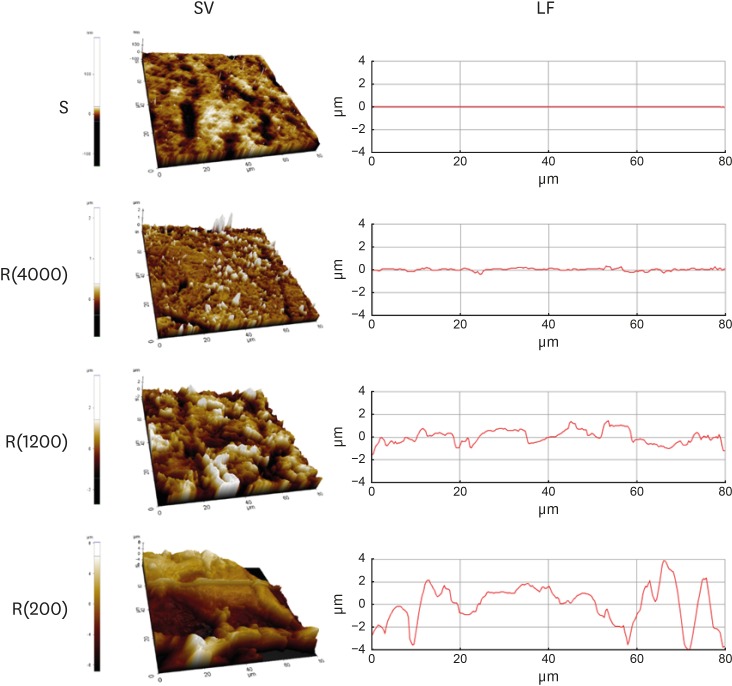 | Figure 1Model substrates. Substrates prepared in polystyrene dishes with varying levels of roughness were analyzed using atomic force microscopy. SV and LF of the substrates with varying levels of roughness.
SV: surface views, LF: line profiles, S: smooth culture dish, R(4000): prepared with #4000 sandpaper, R(1200): prepared with #1200 sandpaper, R(200): prepared with #200 sandpaper.
|
Table 1
Roughnesses of the susbtrates for cultures of HOK-16B cells
| Roughness | Ra (nm) | ||
|---|---|---|---|
| Mean | SD | Median | |
| Smooth (n=9) | 5.4 | 1.4 | 5.5a) |
| R(4000) (n=27) | 121.3 | 13.4 | 121.0b) |
| R(1200) (n=27) | 505.3 | 115.3 | 547.0c) |
| R(200) (n=27) | 867.0 | 168.6 | 789.0d) |
Data were analyzed using Kruskal-Wallis test (P=0.001). Pairwise comparisons were then performed using Mann-Whitney test for post hoc multiple comparisons at Bonferroni-adjusted alpha value (0.05/6=0.0083).
Ra: average roughness, SD: standard deviation, Smooth: smooth culture dish, R(4000): prepared with #4000 sandpaper, R(1200): prepared with #1200 sandpaper, R(200): prepared with #200 sandpaper.
a,b,c,d)A different group from other 3 groups according to post hoc multiple comparison of Mann-Whitney test, at Bonferroni-adjusted alpha value (0.05/6=0.0083).
![]()
Reagents
Antibodies for glyceraldehyde 3-phosphate dehydrogenase (GAPDH), c-Jun N-terminal kinase (JNK), phospho-c-Jun N-terminal kinase (p-JNK: Thr183/Tyr185), E-cadherin, ×10 cell lysis buffer, and horseradish peroxidase (HRP)-linked anti-rabbit immunoglobulin G (IgG) were purchased from Cell Signaling Technology (Waltham, MA, USA). Fluorescein isothiocyanate-labeled phalloidin (FITC-phalloidin), SP600125 (a JNK inhibitor), anisomycin (a JNK activator), puromycin, and 4′, 6-diamidino-2-phenylindole dihydrochloride (DAPI) were obtained from Sigma-Aldrich (St. Louis, MO, USA). Cy3-conjugated anti-rabbit IgG antibody was obtained from Jackson ImmunoResearch (West Grove, PA, USA). The JNK small hairpin RNA (shRNA) (shJNK) plasmid was purchased from Santa Cruz Biotechnology (Santa Cruz, CA, USA). Lipofectamine LTX and Plus reagents were obtained from Invitrogen (Carlsbad, CA, USA). psPAX2, a virus packaging vector, and pMD2.G, an envelope protein vector, were gifts from Dr. Zang-Hee Lee (Seoul National University, Seoul, Korea). Y-27632 (Tocris Cookson, Avonmouth, UK) was used to inhibit the activity of Rho-associated kinase (ROCK). Gibco 0.25% trypsin-EDTA was obtained from Fisher Scientific (Pittsburgh, PA, USA).
Cell cultures and transfections
The HOK-16B cell line was a gift from Dr. N. H. Park (School of Dentistry, University of California, Los Angeles, CA, USA), and comprised a line of cells immortalized from periodontally healthy human retromolar gingival tissue [15]. The HOK-16B cells were cultured in keratinocyte growth medium (KGM) supplemented with bovine pituitary extract, hydrocortisone, recombinant human epidermal growth factor, gentamicin and amphotericin-B (GA-1000), recombinant human insulin (Lonza, Basel, Switzerland), and 1% penicillin. The transfection of cells was performed as described previously [9]. Briefly, HOK-16B cells were cultured in a culture medium containing lentiviral particles generated in HEK293T cells that had been transfected with the shJNK1/2 plasmid together with pMD2.G and psPAX2, using the Lipofectamine LTX and Plus reagents.
Field emission scanning electron microscopic observation
Cells were fixed with 5% paraformaldehyde and coated with palladium after freeze-drying or drying with a graded alcohol series. Surface images of the cells cultured on various substrates were obtained by field emission scanning electron microscopy (FE-SEM) (S4700, Hitachi, Tokyo, Japan).
Immunoblotting
Immunoblotting was performed according to the standard protocol. Briefly, the cells were lysed with a lysis buffer (150 mM NaCl, 1% deoxycholate, 20 mM Tris-HCl [pH 7.5], 1 mM EDTA, 1% Triton X-100, 1 mM EGTA, 2.5 mM sodium pyrophosphate, 1 mM glycerophosphate) containing a protease inhibitor mixture comprising 1 mM Na3VO4, 10 mM NaF, and 1 mM PMSF protease inhibitor (Boehringer Mannheim, Indianapolis, IL, USA), 1 µg/mL of leupeptin, and 1 µg/mL of aprotinin phosphatase inhibitors (Calbiochem, La Jolla, CA, USA). Cell lysates boiled in sample buffer were size-separated through sodium dodecyl sulfate-polyacrylamide gel electrophoresis and transferred to polyvinylidene difluoride membranes. The membranes were blocked with 5% skim milk and incubated with primary antibodies overnight at 4°C. Then, the membranes were incubated with secondary antibodies in 5% skim milk for 1 hour at room temperature. The blots were developed using an enhanced chemiluminescent HRP substrate (Invitrogen). Images of the immunoblotting were digitized to compare the strength of the expression levels of targeted molecules using Image J (National Institutes of Health [NIH], Bethesda, MD, USA). The quantified relative strengths of the expression levels of the target molecules were obtained from the immunoblotting images using the Gels menu in Image J.
Immunocytochemistry
Immunocytochemistry was performed according to the standard protocol. Briefly, cells were fixed with 4% v/v paraformaldehyde and permeabilized in 0.5% v/v Triton X-100. The cells were incubated with a primary antibody against E-cadherin for 2 hours. Then, cells were treated with Cy3-conjugated anti-rabbit IgG antibody. F-actin was stained with FITC-phalloidin. The nucleus was stained with DAPI. Images of the stained cells were acquired using an LSM 700 confocal laser-scanning microscope (CLSM) (Zeiss, Oberkochen, Germany). In addition, images of the staining for E-cadherin and F-actin were merged to examine the co-localization of E-cadherin and F-actin.
Statistical analysis
Statistical analyses were performed in MedCalc version 17.2 for Windows (MedCalc Software, Ostend, Belgium). Since the quantitative data collected in the present study did not show a normal distribution by the Kolmogorov-Smirnov test for normality, the nonparametric Kruskal-Wallis test, followed by post hoc multiple comparison with the Mann-Whitney test at a Bonferroni-adjusted alpha value, was used for the comparison of multiple groups according to the guidelines presented in the MedCalc software (MedCalc Software).
Go to :
RESULTS
Limited and delayed spreading of oral keratinocytes on rough substrates
HOK-16B cells, which are HGKs, were examined by FE-SEM to compare the spreading of the cells seeded on substrates with varying levels of roughness. Intriguingly, the surfaces of the cells initially attached to the substrates were rich in membrane folding and furrows of various dimensions, regardless of the type of substrate to which the cells were attached (Figure 2A). These characteristic folds and furrows became gradually unfolded at the bottom of the cell, where the cell membrane connected with the substrate (Figure 2B). The hidden membrane located deep between the furrows appeared to unfold in order to supply the cells with additional cell membrane, which was required for the cells to spread on the substrate.
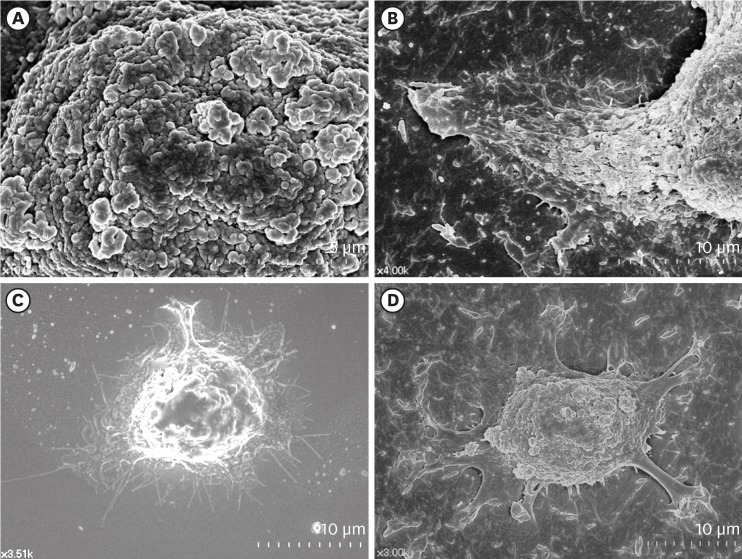 | Figure 2Surface structures of HGKs attached to smooth substrates or substrates of low-nanometer dimensions (Ra=121.3±13.4 nm). Cells were processed for observation by FE-SEM 10 hours after cell seeding. (A) Membrane folding and furrows are rich on the surface of the underside of the cell bodies on the rough substrate (bar=5 µm). (B) Membrane folding and furrows gradually fade toward the end of the cell process, which is extended from the cell body on the rough substrate (bar=10 µm). (C) The cells on the smooth substrate display circumferential lamellipodia rich in filopodia (bar=10 µm). (D) Several cell processes extend from the cell body on the rough substrate. Except for the end of the cell processes, the margin of the cell membrane is linear without filopodia. The surface of the cell body is rich in membrane folding and furrows (bar=10 µm).
HGK: human gingival keratinocyte, Ra: average roughness, FE-SEM: field emission scanning electron microscopy.
|
The initial spreading of the cells differed between the cells cultured on rough substrates and those cultured on smooth substrates. A few cytoplasmic processes extended from the bodies of the cells on the rough substrates, whereas circumferential lamellipodia extended from the onset of cell spreading on the smooth substrates (Figure 2C and D). Fewer cytoplasmic processes extended as the substrate roughness increased (Figure 3). The cell processes of the HGKs on the rough substrates gradually developed into lamellipodia of varying widths depending on the roughness of the substrate (Figures 3 and 4). Finally, the cells developed circumferential lamellipodia after the provisional stage of developing cell processes on the rough substrate with a low-nanometer dimension (Ra=121.3±13.4 nm) (Figure 3). In contrast, the cells maintained narrow lamellipodia throughout the whole stage on substrates with a greater roughness (Ra=505.3±115.3, 867.0±168.6 nm) (Figures 3 and 4).
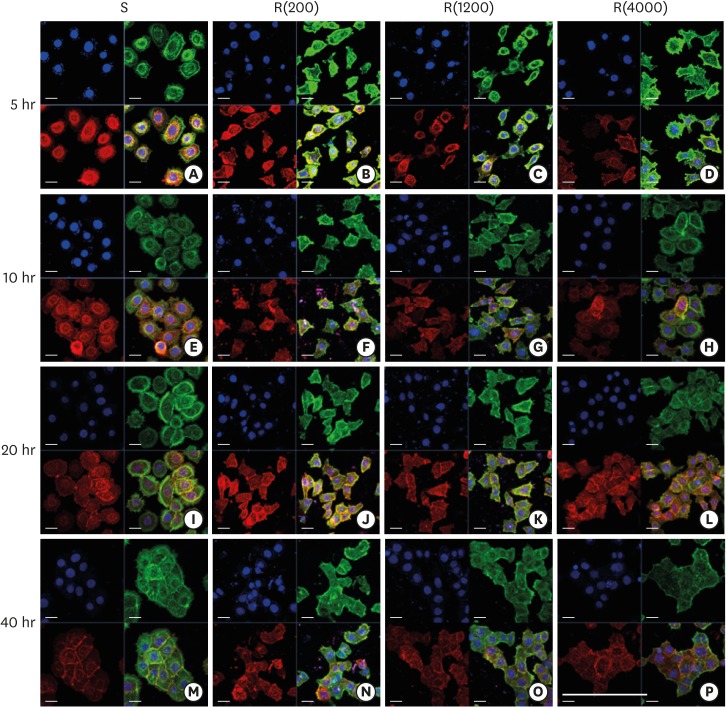 | Figure 3Development of the ECJs of HGKs depends on the substrate roughness in vitro, as shown by confocal laser-scanning microscopy. ECJ development was followed by immunocytochemical staining for the expression level of E-cadherin (red) at 5, 10, 20, and 40 hours after cell seeding. F-actin (green) was stained with FITC-phalloidin. Nuclei were stained with DAPI (blue). The lower right picture in each set of 4 pictures is a merged image of the E-cadherin, F-actin, and nuclei images. Refer to the results section for details regarding ECJ development (short bar=20 µm, long bar=160 µm).
ECJ: E-cadherin junction, HGK: human gingival keratinocyte, FITC: fluorescein isothiocyanate-labeled, DAPI: 4′, 6-diamidino-2-phenylindole dihydrochloride, S: smooth culture dish, R(4000): prepared with #4000 sandpaper, R(1200): prepared with #1200 sandpaper, R(200): prepared with #200 sandpaper.
|
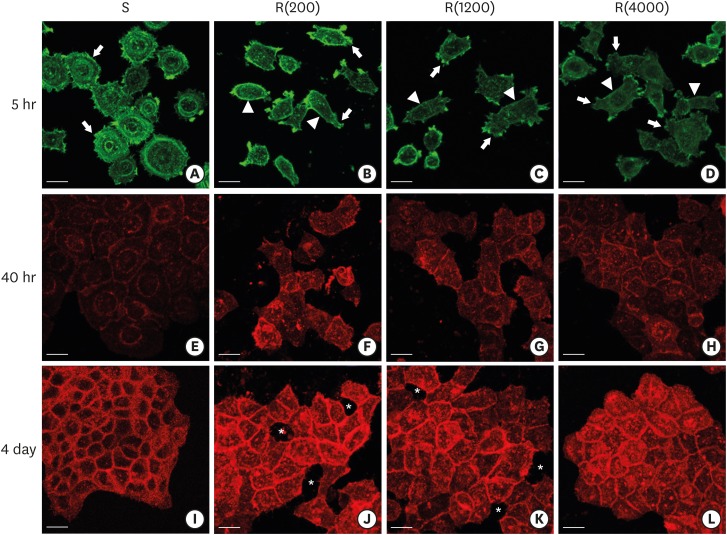 | Figure 4Development of the ECJs of HGKs depended on the substrate roughness in vitro, as shown by confocal laser-scanning microscopy. (A-D) F-actin (green) in HOK-16B cells cultured on the substrates with varying levels of roughness for 5 hours was stained with FITC-phalloidin to identify cortical actin (arrow heads) or lamellipodia (arrows). (E-H) E-cadherin (red) in HOK-16B cells cultured on substrates with varying levels of roughness for 40 hours was immunohistochemically stained to examine how ECJ development depended on the roughness of the substrates. (I-L) E-cadherin (red) of HOK-16B cells cultured on substrates with varying levels of roughness for 4 days were immunohistochemically stained to examine how ECJ development depended on the roughness of the substrates. Intercellular gaps (*) are clearly present between cells in (J) and (K). Refer to the results section for details regarding ECJ development (short bar=20 µm). Ra=121.3±13.4, 505.3±115.3, and 867.0±168.6 nm for R(4000), R(1200), and R(200), respectively.
ECJ: E-cadherin junction, HGK: human gingival keratinocyte, FITC: fluorescein isothiocyanate-labeled, Ra: average roughness, R(4000): prepared with #4000 sandpaper, R(1200): prepared with #1200 sandpaper, R(200): prepared with #200 sandpaper, S: smooth substrate.
|
Defective intercellular junction development in HGKs cultured on rough substrates
Scattered individual HGKs aggregated and developed intercellular junctions through contacts between the ends of lamellipodia of various sizes. Cell spreading characteristics were reflected in the development of the intercellular junctions. The cells surrounded by circumferential lamellipodia made relatively long and tight cell-cell junctions (CCJs) through contacts between the wide surfaces of circumferential lamellipodia on the smooth substrate (Figures 3 and 4). The HGKs rapidly aggregated to form compact islands on the smooth substrates. The HGKs that developed circumferential lamellipodia on the rough substrate with low-nanometer dimensions also formed long intercellular junctions, as observed in the cells on the smooth substrates (Figures 3 and 4). However, the HGKs required more time to form compact islands on the rough substrate with low-nanometer dimensions than on the smooth substrate because these cells had an extra-provisional stage in which cell processes were extended before the development of the circumferential lamellipodia (Figure 3). In contrast, the cells extending narrow lamellipodia on the rough substrates with mid- or high-nanometer dimensions (Ra=505.3±115.3, 867.0±168.6 nm, respectively) developed defective intercellular junctions (Figures 3and 4). The development of the intercellular junctions did not appear to strongly promote the formation of compact aggregates by the cells. Therefore, the cells on the rough substrates with mid- or high-nanometer dimensions did not establish compact aggregates, and wide intercellular gaps between the cells remained (Figures 3 and 4).
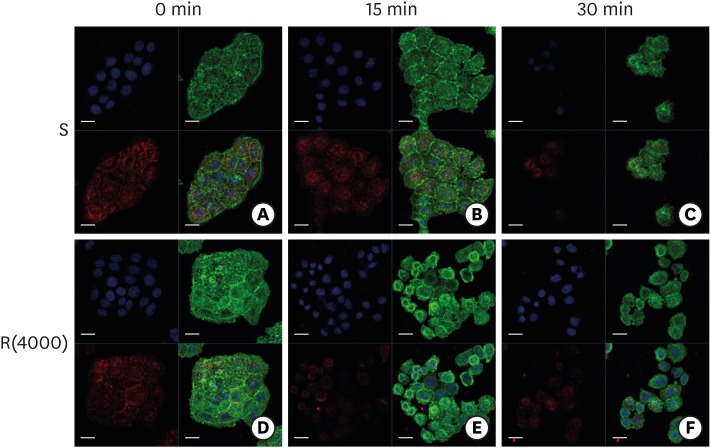
In HGKs, the intercellular junctions were ECJs; E-cadherin could be strongly detected by CLSM (Figures 3 and 4). An examination of the cell clusters by CLSM confirmed the development of the defective ECJs in cells cultured on substrates with high levels of roughness. The cells cultured on the smooth substrate or the rough substrate with low-nanometer dimensions rapidly formed compact islands that were surrounded by tight ECJs (except for the free membranes of the cell cluster); in contrast, the clusters of cells cultured on the rougher substrates were slow to develop ECJs. A larger percentage of the cell membranes remained without ECJs in cells cultured on the rougher substrates when examined at the early stage of the cell culture (Table 2). The area that was not covered by cells increased with increasing substrate roughness. After a longer culture time of up to 4 days, the cells on the smooth substrate and the rough substrate with low-nanometer dimensions became more compact (Figure 4). However, the cells on the highly rough substrates remained loosely aggregated. These results indicate that cells cultured on moderately rough substrates overcame the roughness when cultured for longer periods of time, but the cells on highly rough substrates were not able to overcome this roughness, even after a long culture period.
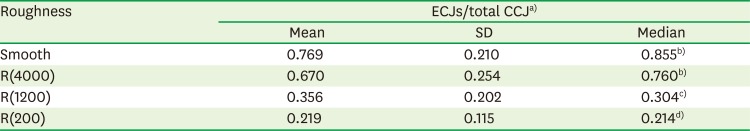
Table 2
Development of ECJs of HOK-16B cells depending on the substrate roughness in vitro
| Roughness | ECJs/total CCJa) | ||
|---|---|---|---|
| Mean | SD | Median | |
| Smooth | 0.769 | 0.210 | 0.855b) |
| R(4000) | 0.670 | 0.254 | 0.760b) |
| R(1200) | 0.356 | 0.202 | 0.304c) |
| R(200) | 0.219 | 0.115 | 0.214d) |
Data were analyzed using Kruskal-Wallis test (P=0.001). Pairwise comparisons were then performed using Mann-Whitney test for post hoc multiple comparison at Bonferroni-adjusted alpha value (0.05/6=0.0083) (n=30).
ECJs: E-cadherin junctions, CCJ: cell-cell junction, SD: standard deviation, Smooth: smooth culture dish, R(4000): prepared with #4000 sandpaper, R(1200): prepared with #1200 sandpaper, R(200): prepared with #200 sandpaper.
a)Quantitative ECJs developmental value was obtained by dividing the length of ECJs by the length of total CCJ per cell; b,c,d)A different group from other 2 groups (P<0.001) according to Mann-Whitney test for post hoc multiple comparison at Bonferroni-adjusted alpha value (0.05/6=0.0083). There is no significant difference between smooth and R(4000) (P=0.128).
![]()
Next, we examined whether the defective development of the ECJs in cells cultured on the rough substrates with mid- or high-nanometer dimensions resulted from a reduced chance of cell contacts forming due to the wider spaces between the cells, which were less spread out (Figure 5). Compared with ECJ development in the cells cultured on the smooth substrate, ECJ development in the cells cultured on the substrate with a high roughness was defective even though the cells were cultured at a high density, permitting unconstrained cell contacts. These results confirm that on the rough substrate, the cell membranes of HGKs were less adhesive than those of cells on the smooth substrate.
 | Figure 5ECJ development in HGKs seeded at a high density on smooth or rough substrates was examined using confocal laser-scanning microscopy. ECJ development was followed by immunocytochemical staining for the expression level of E-cadherin (red) at 5, 10, and 20 hours after cell seeding. F-actin (green) was stained with FITC-phalloidin. Nuclei were stained with DAPI (blue). The lower right picture in each set of 4 pictures is a merged image of the E-cadherin, F-actin, and nuclei images. (A, D, G) Cells on the smooth substrates were cultured under normal conditions. Cells on the rough substrates with high-nanometer dimensions, R(200), were cultured under normal conditions (B, E, H) or JNK inhibition by 1 µM SP (C, F, I). (H) Arrows indicate the wide intercellular gaps remaining between the cells on the rough substrate with a high-nanometer dimension despite the high density of the culture (bar=20 µm). Ra=867.0±168.6 nm for R(200).
ECJ: E-cadherin junction, HGK: human gingival keratinocyte, FITC: fluorescein isothiocyanate-labeled, DAPI: 4′, 6-diamidino-2-phenylindole dihydrochloride, JNK: c-Jun N-terminal kinase, S: smooth substrate, SP: SP600125, Ra: average roughness, R(200): prepared with #200 sandpaper.
|
Low stability of ECJs in cells cultured on rough substrates
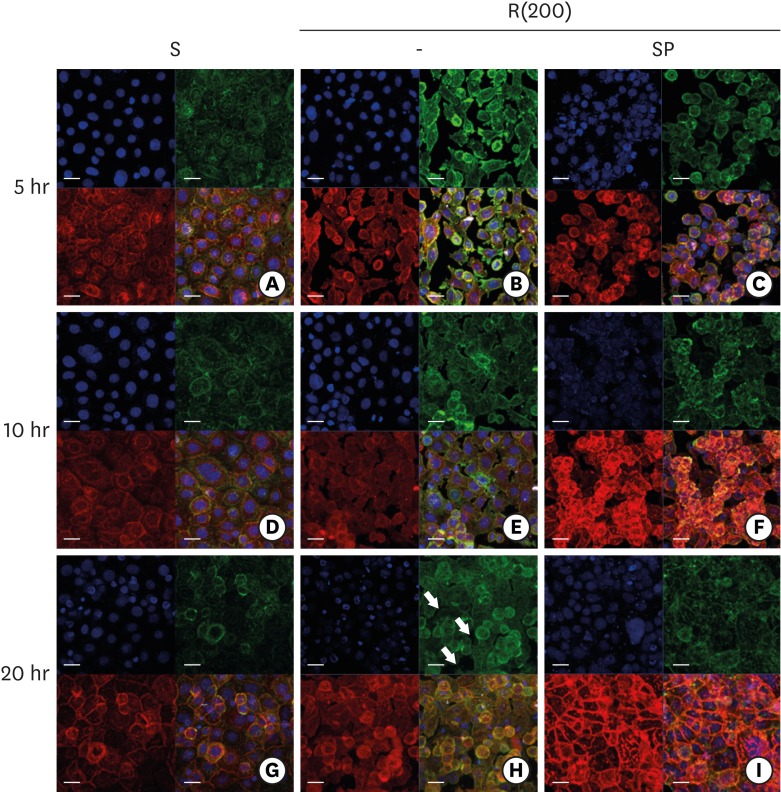
Next, we examined whether there was a difference in the stability of the ECJs in cells cultured on the smooth substrate and those cultured on rough substrates. Compact cell aggregates formed in cells cultured for 4 days on the smooth and moderately rough substrates and were treated with EDTA or trypsin-EDTA, which are known to activate RhoA-ROCK and to dissociate intercellular ECJs [16]. These treatments disrupted the intercellular junctions of the cells cultured on the rough substrates earlier than in the cells cultured on the smooth substrate (Figure 6). These results indicate that intercellular ECJs were more vulnerable in HGKs cultured on rough substrates than in those cultured on smooth substrates, although the cells assembled compact cell aggregates on both substrates.
 | Figure 6Dissociation of ECJs after calcium depletion. HGKs were treated for the indicated times with 0.25% trypsin-EDTA after culturing for 4 days on the smooth substrate (A-C) or the rough substrate with low-nanometer dimensions (D-F). ECJ development was followed by immunocytochemical staining for the expression level of E-cadherin (red) at 0, 15, and 30 minutes after calcium depletion. F-actin (green) was stained with FITC-phalloidin. Nuclei were stained with DAPI (blue). The lower right picture in each set of 4 pictures is a merged image of the E-cadherin, F-actin, and nuclei images (bar=20 µm).
ECJ: E-cadherin junction, HGK: human gingival keratinocyte, FITC: fluorescein isothiocyanate-labeled, DAPI: 4′, 6-diamidino-2-phenylindole dihydrochloride, S: smooth substrate, R(4000): prepared with #4000 sandpaper.
|
Role of JNK in ECJ development in HGKs cultured on rough surfaces
In a previous report, we showed that JNK downregulated ECJ development in HGKs [9]. Thus, we examined whether defective ECJ development in the cells cultured on the rough substrates was associated with JNK activity. The expression level of p-JNK was assessed by immunoblotting for p-JNK in cells cultured on substrates with varying levels of roughness. The expression levels of p-JNK were higher in the cells cultured on the rough substrates than in the cells cultured on the smooth substrate, although the difference in JNK activity decreased with time after cell seeding, excluding those on the rough substrates with high-nanometer dimensions (Ra=867.0±168.6 nm) (Figure 7A). The finding of reduced JNK activity after the initial culture phase suggests that JNK primarily influenced the initial stage of ECJ development.
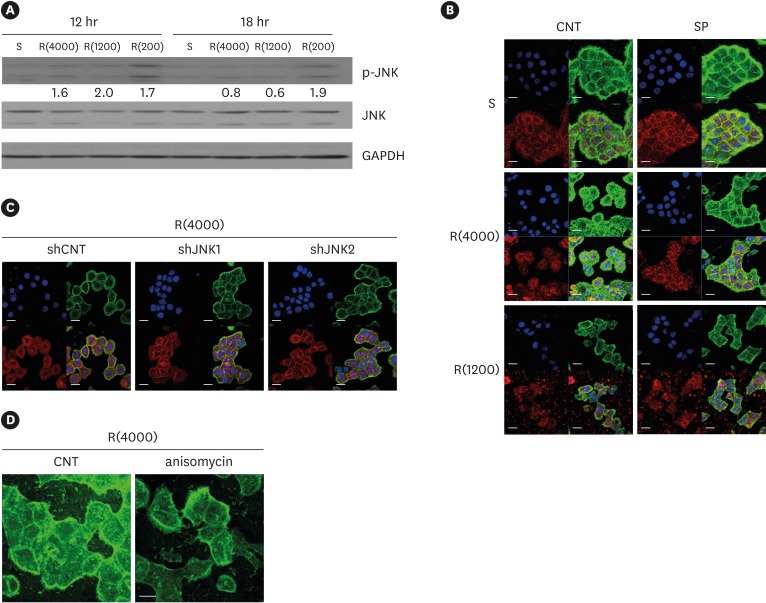 | Figure 7Influence of JNK on ECJ development. (A) HGKs were cultured on substrates with varying levels of roughness. Then, the expression levels of p-JNK were compared by western blotting. Values under the blots for p-JNK indicate the relative expression level of p-JNK to the total JNK for each group, which was analyzed using Image J. (B) HGKs were treated with SP (1 µM) to inhibit JNK activity for 24 hours in culture starting 12 hours after cell seeding on the smooth and rough substrates. CNT indicates the control culture without treatments with SP. (C) HGKs transfected using lentiviruses expressing shJNK1/2 to selectively inhibit JNK1/2 activity were re-plated for 24 hours on the rough substrate with low-nanometer dimensions (Ra=121.3±13.4 nm). ECJ development was followed by immunocytochemical staining for the expression level of E-cadherin (red). F-actin (green) was stained with FITC-phalloidin. Nuclei were stained with DAPI (blue). The lower right picture in each set of 4 pictures is a merged image of the E-cadherin, F-actin, and nuclei images. shCNT, scrambled shRNA. (D) HGKs were treated with anisomycin (20 ng/mL) to activate JNK for 20 hours in culture starting 3 days after cell seeding on the rough substrates. CNT indicates the control culture without treatments with anisomycin (bar=20 µm). Ra=121.3±13.4, 505.3±115.3, and 867.0±168.6 nm for R(4000), R(1200), and R(200), respectively.
S: smooth substrate, SP: SP600125, JNK: c-Jun N-terminal kinase, ECJ: E-cadherin junction, HGK: human gingival keratinocyte, CNT: carbon nanotube, Ra: average roughness, p-JNK: phospho-c-Jun N-terminal kinase, shRNA: small hairpin RNA, FITC: fluorescein isothiocyanate-labeled, DAPI: 4′, 6-diamidino-2-phenylindole dihydrochloride, R(4000): prepared with #4000 sandpaper, R(1200): prepared with #1200 sandpaper, R(200): prepared with #200 sandpaper.
|
Next, the effect of JNK inhibition on ECJ development was examined. The treatment of the cells with SP600125, a pharmacological inhibitor of JNK, clearly promoted ECJ development in the HGKs cultured on the rough substrate with low-nanometer dimensions and on the smooth substrate (Figure 7B). The knockdown of JNK1 or JNK2 via lentiviral transfection of shRNA JNK1 or shRNA JNK2 into the cells also promoted ECJ development in HGKs cultured on the rough substrate with low-nanometer dimensions (Figure 7C). In addition, involvement of JNK in the regulation of ECJ development was further confirmed by showing that anisomycin, a pharmacological activator of JNK, disrupted the ECJs of the cell aggregates (Figure 7D). These results suggest that the delay in ECJ development may have been associated with JNK activity in the cells cultured on the rough substrate. However, the responsiveness of ECJ development to JNK regulation was observed in HGKs cultured on the rough substrate with a low-nanometer dimension, but not in HGKs cultured on substrates with higher levels of roughness. There was no acceleration of ECJ development in response to JNK inhibition in the cells grown on substrates with higher levels of roughness (Figure 7B). These results indicate that the physical barrier of the very rough substrates could not be overcome by the biological regulation of JNK activity when the cells were scattered at a low density. However, ECJ development in response to JNK inhibition in the cells grown on the substrates with greater levels of roughness was clearly upregulated when the cells were cultured at a high density to reduce the distance between cells (Figure 5). These results suggest that JNK inhibition can be used to promote ECJ development when oral keratinocytes are packed into the JE on rough surfaces with high-nanometer dimensions.
Next, the association between the activity of JNK and regulatory F-actins, such as cortical actin, in ECJ development was examined to investigate the downstream effects of JNK in the regulation of ECJ development, which are largely unclear. Due to its stiffness, plasma membranes lined with cortical actin have been hypothesized to suppress the development of intercellular junctions [171819]. The F-actin of HGKs was stained with phalloidin to determine whether cortical actin was associated with the development of defective ECJs in the cells grown on the rough substrates. On the smooth substrates, as soon as the cells began to spread, they rapidly extended circumferential lamellipodia devoid of cortical actin (Figure 4). These circumferential lamellipodia were rich in filopodia instead of cortical actin. In contrast, in the HGKs grown on rough substrates, cortical actin without filopodia was prominent in the smooth plasma membrane, except at the ends of the cell processes at the onset of cell spreading (Figure 4). In HGKs on the rough substrate with low-nanometer dimensions, cortical actin disappeared from the circumferential lamellipodia, which were slow to develop (Figure 3). However, most of the cortical actin shell remained at the plasma membranes of the HGKs cultured on the substrates with higher levels of roughness, except at the ends of the cell processes, where small lamellipodia-like cytoplasmic extensions developed. ECJs developed only at the margins of the cells in which cortical actin was absent (Figure 3). The thickness and proportion of the plasma membrane that was lined with cortical actin increased as substrate roughness increased. Thus, the cells grown on rougher substrates appeared to require longer periods of time to contact the adhesive membranes of the other cells. These observations confirm that the primary requirement for ECJ development in HGKs is the disassembly of the stiff cortical actin shell beneath the plasma membrane to increase plasma membrane pliability [171819].
The cells in which JNK activity was inhibited by treatment with SP600125 or the transfection of shJNK1/2 did not develop cortical actin during ECJ development, regardless of the roughness of the substrates (Figure 8). In contrast, the cells in which JNK activity was upregulated by anisomycin developed thick cortical actin (Figure 8). The cells in which JNK was constitutively activated by anisomycin did not spread even on the smooth substrates. These cells maintained the spherical morphology of the cells suspended on the smooth substrates, which suggested that their cortical tension was extremely high. Interestingly, the effect of anisomycin, which induced the formation of thick cortical actin, was reversed by inhibiting actomyosin contraction via ROCK inhibition (Figure 8). HGKs co-treated with anisomycin and Y-27632 developed ECJs. Together, these results indicate that the cortical actin shell regulated ECJ development in HGKs, and that JNK activity was associated with the development of this stiff F-actin structure.
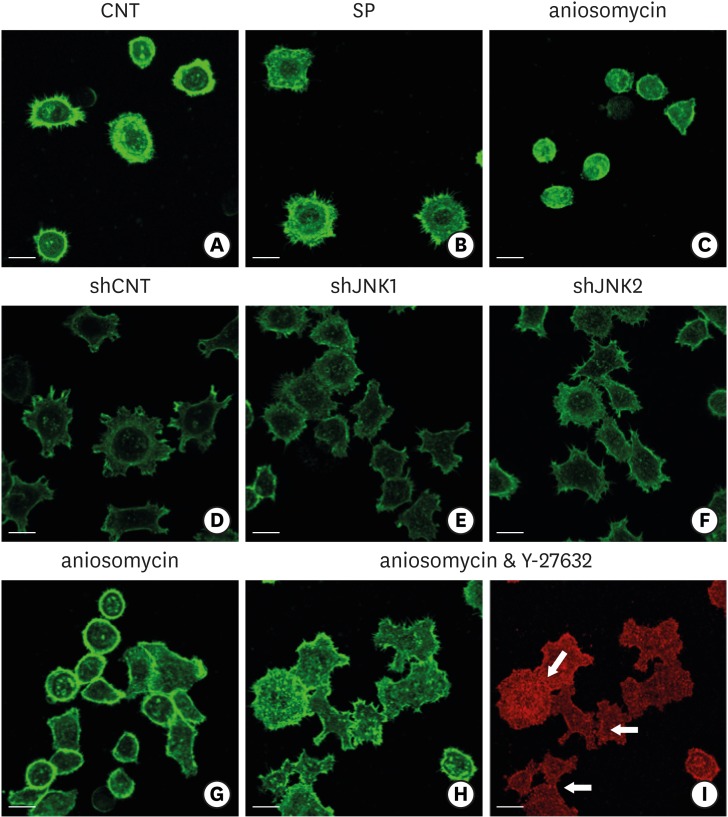 | Figure 8Influence of JNK on the organization of F-actin during ECJ development. (A-C) The development of cortical actin was assessed using CLSM after treating the cells with SP (1 µM) (B), or anisomycin (20 ng/mL) (C) for 20 hours from the start of cell culture on the smooth substrate. CNT (A) indicates the control culture without treatments regulating JNK activity. F-actin was stained with FITC-phalloidin (bar=20 µm). (D-F) Cortical actin development was assessed using CLSM after HGKs infected with lentiviruses expressing shJNK1 (E) or shJNK2 (F) to selectively inhibit JNK1 or JNK2 were cultured for 8 hours on the rough substrate with low-nanometer dimensions (Ra=121.3±13.4 nm). Control cells (shCNT) (D) were cultured after transfection with scrambled shRNA. F-actin was stained with FITC-phalloidin (bar=20 µm). (G-I) Cortical actin development and ECJ development (arrows) were assessed using CLSM after treating the cells with anisomycin (20 ng/mL) (G) or co-treating the cells with anisomycin (20 ng/mL) and Y-27632 (20 µM) (H, I) for 20 hours from the start of cell culture on the smooth substrate. F-actin (green) was stained with FITC-phalloidin. ECJ development was followed by immunocytochemical staining for the expression level of E-cadherin (red) (bar=20 µm).
JNK: c-Jun N-terminal kinase, ECJ: E-cadherin junction, CNT: carbon nanotube, Ra: average roughness, SP: SP600125, CLSM: confocal laser-scanning microscopy, FITC: fluorescein isothiocyanate-labeled, sh: small hairpin.
|
Go to :
DISCUSSION
The development of ECJs with wide intercellular gaps in cells on highly rough substrates has the clinical implication that HGKs in the JE may develop defective CCJs if they are placed on either a surface that has been significantly roughened by root planing therapy or the surface of a rough fixture exposed due to peri-implantitis or marginal bone loss. The results of the present study also suggest that defective ECJs may develop in JE that physiologically relocates to the rougher root surface as a result of apical migration from the smoother enamel surface. Such defective CCJs of the JE on highly rough surfaces may not provide an adequate barrier against bacteria or toxins, compared with those on the surface of smoother enamel or abutments. Another implication related to the ECJs of HGKs is that these junctions are less stable in the cells on rough substrates than in the cells on smooth substrates. These results suggest that the ECJs in the JE located on a rough surface of the root after periodontal surgery, due to peri-implantitis, or in cases of marginal bone loss may be more vulnerable to the stimuli imposed by bacterial toxins or cytokines than the ECJs in the JE located on the smooth surfaces of natural tooth enamel or the smooth surface of dental implant abutments. These weaknesses of ECJs can be associated with the induction of inflammation, delayed healing after surgery, or the aggravation of inflammation near the rough surfaces of teeth roots or implant fixtures. Therefore, reducing the surface roughness of the root as much as possible may ensure a better seal by the JE upon treatment for periodontitis.
The present study demonstrated that the development of cell junctions in HGKs was closely associated with the dynamics of actin filaments, which have been well characterized in various cells. Disassembling the cortical actin bundle was found to be the first step in ECJ development and was concomitant with the development of lamellipodia in HGKs. The cortical actin bundle, which is localized beneath the plasma membrane, has been reported to make the plasma membrane stiff and thus non-adhesive in the development of the cell junction [171819]. In the present study, the dynamics of the cortical actin in HGKs varied depending on the substrate roughness. The cortical actin bundle disappeared in the marginal cell membranes of the circumferential lamellipodia on both the smooth substrate and the rough substrate with a low-nanometer dimension. Thus, the extensive development of linear, long cell junctions occurred throughout the entire margin of each circumferential lamellipodium, resulting in compactly aggregated cells without intercellular gaps. In contrast, the cells were partially spread on the substrates with higher levels of roughness, and they extended several cell processes rather than circumferential lamellipodia. Thus, short ECJs developed through contacts between the narrow lamellipodia-like ends of the cell processes, where the cortical actin was disassembled. Consequently, loose aggregates of cells formed with wide intercellular spaces on the rougher substrates.
The dynamics of F-actin systems depend on the roughness of the substrate, suggesting that their regulation may promote ECJ development on rough substrates. We targeted JNK in order to regulate F-actin systems and thereby to promote ECJ development in cells grown on rough substrates. JNK activity has been reported to be involved in the organization of F-actin bundles in endothelial cells and epithelial cancer cells, and its inhibition has been found to result in the poor development of cortical actin bundles and central stress fibers in endothelial cells [2021222324]. In addition, we previously demonstrated that JNK regulates ECJ development in HGKs [9]. The present study shows that JNK inhibition promoted the loss of cortical actin, along with ECJ development. In contrast, JNK activation induced the development of thick cortical actin, which inhibited both cell spreading and ECJ development. The dependency on cortical actin in the regulation of the ECJ by JNK was further confirmed by showing that cells treated with anisomycin lost the thick cortical actin bundle and developed ECJs when ROCK activity was inhibited to release the tension imposed by cortical actin. All of these results suggest that reducing JNK activity promotes ECJ development by downregulating the development of the regulatory cortical actin bundle. Thus, JNK will be a target for the promotion of ECJ development on rough substrates. In addition to the disorganization of cortical actin, enhancing the contacts between cells seemed to be necessary to promote ECJ development on the rough substrates with mid- or high-nanometer dimensions, which was demonstrated in the cells cultured at high density on the rough substrates with high-nanometer dimension.
In summary, the present study demonstrated that HGKs on rough substrates developed delayed or defective intercellular junctions with wide intercellular gaps compared with HGKs on smooth substrates. HGKs developed tight intercellular junctions devoid of wide intercellular gaps on smooth substrates and on rough substrates with low-nanometer dimensions (Ra=121.3±13.4 nm). Remarkably, HGKs developed intercellular junctions with wide intercellular gaps on rough substrates with mid- or high-nanometer dimensions (Ra=505.3±115.3, 867.0±168.6 nm). Notably, the stability of the ECJs was low on the rough substrates, as demonstrated by the rapid destruction of the cell junction following calcium depletion. Because the root surface after root planing and most recently marketed fixture surfaces are rough surfaces with high-nanometer dimensions, the results of the present study strongly suggest that there is a risk that patients will develop a JE that forms a poorly protective barrier after apical migration of the JE, periodontal therapy, peri-implantitis, or marginal bone loss. The present study also demonstrated that regulating the activity of JNK promoted the development of the ECJs of HGKs through regulating the dynamics of the F-actin system, especially the cortical actin shell, on rough substrates with mid- or high-nanometer dimensions.
Go to :
 XML Download