

 PDF
PDF ePub
ePub Citation
 Print
Print


INTRODUCTION
Dental implant restoration for a missing tooth is now a routine procedure due to its high predictability and reliability. Although a high survival rate is expected as a result of developments in the field of implants, peri-implant disease and the importance of managing peri-implant health is attracting interest.
Peri-implant disease is classified as peri-implant mucositis, which refers to reversible inflammation of the peri-implant soft tissue, or peri-implantitis, which is inflammation of the soft tissue and concomitant irreversible loss of the supporting bone. Therefore, verifying bone loss is essential for diagnosing peri-implantitis.
In clinical situations, intraoral and panoramic radiographs are the imaging tools most commonly used to identify the peri-implant bone level. Although these techniques are readily available and can be performed quickly and cost-effectively, they have also been suggested to have limited diagnostic accuracy [1]. Because intraoral and panoramic radiographs are 2-dimensional images, the buccal and lingual surfaces are obscured and only the bone level of the proximal surfaces can be evaluated. In addition, it has been reported that in these radiographs, the interproximal bone level tends to be underestimated in the implants and in the teeth [234]. Cone-beam computed tomography (CBCT) can be a complementary modality as a 3-dimensional imaging technique, but it is expensive, involves a high dose of radiation, and shows metal artifacts that may degrade visibility [5].
Efforts are continuing to develop better diagnostic tools, and optical coherence tomography (OCT) is a potential technique [6]. OCT utilizes an optical source to obtain a high-resolution image non-invasively without irradiation. Various applications of OCT are being studied both in medicine and in dentistry [7]. In several studies using OCT for periodontal diagnosis, images of normal periodontal tissue were obtained and evaluated [7891011]. In a previous study by our group, we formed artificial periodontal pockets in a porcine model and confirmed that quantitative measurements of pocket depth could be made by OCT [12].
The aim of this experimental study was to visualize and identify peri-implant bone defects in OCT images and to obtain quantitative measurements of the defect depth.
MATERIALS AND METHODS
Sample preparation
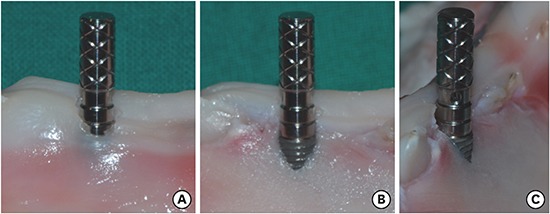
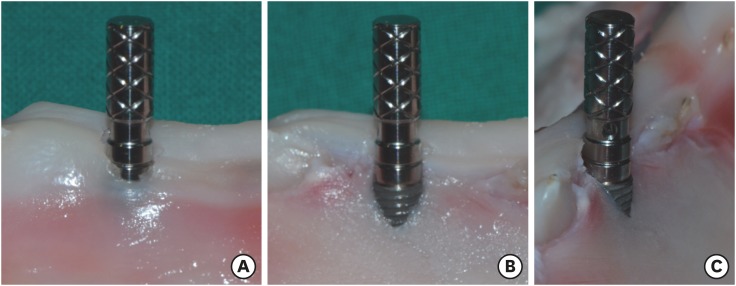
Porcine mandibles were obtained from a butcher shop and sectioned, preserving the dental structure and periodontal tissue. To evaluate the bone defects non-invasively, implants were placed using the flapless technique. The implant sites were prepared by intentionally forming dehiscence defects in the coronal part, and the depth of the resulting defects varied from shallow to deep. Fifteen bone-level implants (Dentium Superline, Dentium Co., Ltd., Seoul, Korea) were placed in 4 mandibles and parallel pins were connected (Figure 1A). The porcine samples were immersed in saline and lightly air-dried before OCT imaging.
OCT image acquisition and quantitative measurements
The OCT system used in this study was a multipurpose commercially available system (Oz-tec Co., Ltd., Daegu, Korea) with a swept laser source. The central wave length of the sweep source was 1,310±10 nm at a 50 kHz sweep frequency, and the average output power was 16 mW. The system captured 500 frames per second with an axial resolution in the air of 7.56 μm and a lateral resolution of 10.03 μm [12].
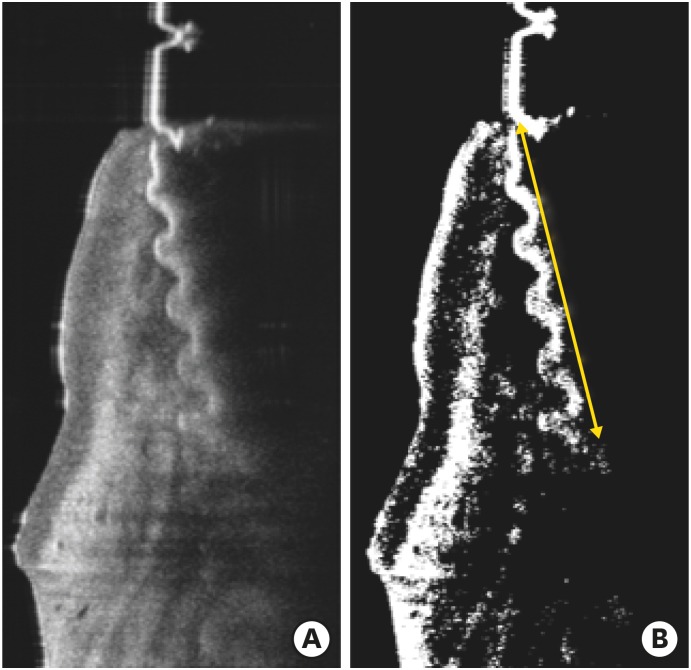
The OCT images of the porcine samples were stored as raw data and averaged to improve the quality of images using a software package (MATLAB, MathWorks, Natick, MA, USA) [12]. For implants surrounded by bone, the fixture body was not visible in the OCT images because the OCT light source could not penetrate the alveolar bone. Only the threads of the fixture could be seen at the bone defect site, so the depth of the peri-implant bone defect could be measured through the length of the visible threads. The threads of the fixture were detected in the OCT images by the universal image threshold using Otsu's method (Figure 2) [13]. Because the actual physical distance of the pitch of the implant was known, the length of the visible threads in the OCT images could be calculated numerically.
Figure 2
Detection of threads of the implant fixture in an OCT image. (A) is a raw OCT image of the sample and (B) is a calibrated image by the universal threshold using Otsu's method. The length of the visible threads, indicated by the yellow line, was considered the depth of the bone defect.
OCT: optical coherence tomography.
To compare the data measured from the OCT images to the actual bone defects, the flap was elevated (Figure 1B and C) and the defect depth was measured with a digital caliper (Bluebird, Seoul, Korea). Five measurements were made for each sample using both methods.
Data analysis
This study used the paired t-test to compare the bone defect depth for 15 porcine samples in which OCT and caliper measurements were made, and the intraclass correlation coefficient (ICC) was used to evaluate the reliability of the OCT method.
To verify the concordance between the 2 methods, a Bland-Altman plot was generated. This is a scatter plot in which the means of and differences between each pair of measurements are calculated for each subject; then, the means are plotted on the x-axis and the differences are plotted on the y-axis. This method is frequently used in studies comparing 2 examination methods, because it is very useful for investigating repeatability and reproducibility, as well as disagreement between the 2 methods. In a Bland-Altman plot, 3 horizontal lines are typically drawn parallel to the x-axis, with the middle line indicating the mean of the differences between measurements, while the lines positioned on either side of this middle line represent the upper and lower 95% limits of agreement [13]. Values mostly located within this interval indicate a narrow distribution of the differences between measurements, suggesting close agreement between the 2 test methods.
Statistical analysis was performed using SPSS version 19.0 (IBM Corp., Armonk, NY, USA) and the significance level was set at less than 0.05.
RESULTS
The OCT images obtained from the porcine samples after implant placement are shown in Figure 3. The mean values of the defect depth measured by OCT were 3.53 mm (A), 4.17 mm (B), 4.73 mm (C), and 7.17 mm (D), respectively. The corresponding mean values measured by a digital caliper were 3.35 mm (A), 4.12 mm (B), 4.43 mm (C), and 6.74 mm (D) (Figure 3). The average defect depth measured by a digital caliper was 4.88±1.28 mm, and the average defect depth measured by OCT was 5.11±1.33 mm. The average measurement by OCT was 0.23 mm greater, and this was a significant difference (P<0.001) (Table 1). The ICC calculated for the reliability of the measurements using OCT was high, with a 95% confidence interval (CI) close to 1 (Table 2).
Figure 3
OCT image acquisition in the porcine samples. The mean values of the defect depth measured by OCT were 3.53 mm (A), 4.17 mm (B), 4.73 mm (C), and 7.17 mm (D), respectively. The corresponding mean values measured by a digital caliper were 3.35 mm (A), 4.12 mm (B), 4.43 mm (C), and 6.74 mm (D).
OCT: optical coherence tomography.
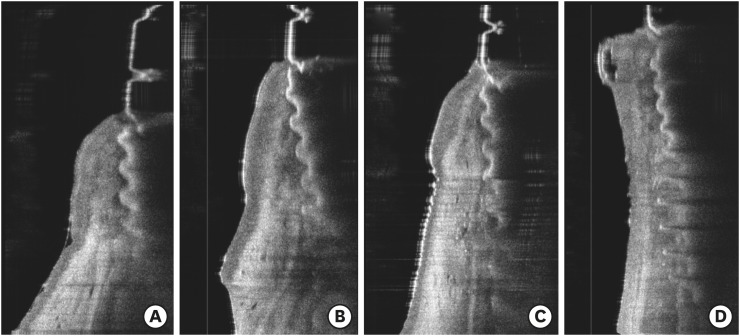
Table 1
Comparison of the defect depths measured by OCT and a digital caliper

| Method | No. | Mean±SD | Difference | P value |
|---|---|---|---|---|
| Caliper | 75 | 4.88±1.28 | −0.230±0.318 | <0.001 |
| OCT | 5.11±1.33 |
Table 2
Coefficients and 95% intraclass correlation confidence intervals for OCT measurements compared with caliper measurements

| Method | ICC | 95% CI |
|---|---|---|
| Caliper | 0.99 | 0.976–0.991 |
| OCT |
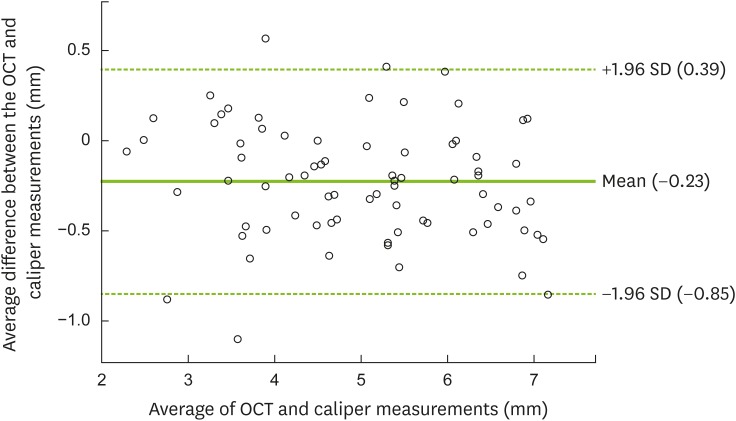
The Bland-Altman chart is a method for observing agreement between 2 measurements. The difference between the 2 measurements and the average of each measurement are taken as 2 axes, and the degree of agreement is generally evaluated through the number of points outside the 95% CI. In the Bland-Altman analysis, the mean value of the difference between the OCT and caliper measurements for bone loss was −0.23, and the limits of agreement (mean±2 standard deviation [SD]) were 0.39 for the upper limit and −0.85 for the lower limit, respectively. Most of the measured values were within the threshold of the 95% CI (Figure 4).
Figure 4
Bland-Altman plot of the estimated amount of bone loss, showing differences between measurements made using calipers and OCT. The bold solid line is the mean of the average caliper and OCT values. The dotted horizontal lines indicate 95% limits of agreement, as the mean of the 2 values minus 1.96 SDs and the mean plus 1.96 SDs, mean±(1.96×SD).
OCT: optical coherence tomography, SD: standard deviation.
DISCUSSION
Maintaining stability of the peri-implant crestal bone level is essential for the long-term success of an implant. Adell et al. [14] were the first to report marginal bone loss, and a large portion of the loss occurred during the first year of loading, after which it occurred to a very small extent. According to the 1986 proposal of Albrektsson et al. [15], vertical bone loss of 0.2 mm per year after the first year of loading can be considered successful, and this criterion is still used.
However, progressive bone loss beyond that range can lead to implant failure. A peri-implantitis lesion can be more destructive than a periodontal lesion, potentially extending to the bone marrow [16]. Clinically, the progression of some peri-implant lesions appears to be accelerating. Continuous monitoring of the crestal bone level, which allows the early detection of disease and appropriate treatment, is of the utmost importance to maintain the health of the peri-implant tissue [17].
Although the probing pocket depth is used as the most basic parameter for diagnosis, it has limits in terms of quantitative evaluations. In addition to inherent drawbacks such as low reproducibility of the insertion position, angle, and force, the presence and contour of the abutment and prosthesis affect the measurements [18]. Moreover, probing has the disadvantage of causing discomfort to the patient and can be more painful around implants than around teeth [19].
Radiographs are a crucial diagnostic tool for confirming bone loss, but the current technique is insufficient for estimating bone loss until at least 1.0 mm, which implies that early detection is difficult [20]. Two clinical studies comparing periapical radiography and surgical assessments for measuring peri-implant bone loss showed underestimation of 1.3 mm and 2.3 mm, respectively [34]. In a meta-analysis, when peri-implant bone defects were assessed by CBCT and intraoral radiography, the accuracy was comparable and clinically acceptable, but not high based on sensitivity and specificity of 60% [5].
In this study, dehiscence defects were intentionally formed and implants were simultaneously placed without flap elevation in porcine mandibles. In the OCT images, the portion of the fixture surrounded by the bone was not presented, while the fixture in the bone defect was revealed. Therefore, peri-implant bone loss could be confirmed with OCT imaging and the depth of the bone defect could be measured non-invasively through the length of the visible threads. The average defect depth measured by a digital caliper was 4.88±1.28 mm, while the corresponding value of the OCT measurements was 5.11±1.33 mm. The higher values of the OCT measurements, by as much as 0.23 mm, may be considered clinically insignificant, but this was nonetheless a statistically significant difference. An explanation for this difference is that very thin bone areas that were sufficiently transparent in the coronal portion was penetrated by the optical beam in OCT imaging and regarded as bone loss. In addition, the ICC and the Bland-Altman plot for evaluating the reliability of the OCT measurements showed high agreement with measurements made using a digital caliper after flap elevation. Follow-up studies are needed to determine whether similar results can be obtained even in in vivo clinical conditions.
In defining peri-implantitis, at the Eighth European Workshop of Periodontology meeting, 2 mm of vertical difference from the expected crestal bone level after remodeling was referred to as the threshold level [21]. Various thresholds of radiographic bone loss in the range of 0.4 mm to 5.0 mm have been used to diagnose peri-implantitis in different studies [22]. A diagnostic tool that precisely expresses the condition of the region and enables accurate quantitative measurements will be necessary to establish criteria for peri-implantitis. The OCT technique, which can visualize tissue detail at high-resolution, may be a candidate for a future diagnostic tool.
Within the limitations of this study, it can be concluded that OCT images can be used to visualize the peri-implant bone level and to identify bone defects. The potential of quantitative non-invasive measurements of the amount of bone loss was also confirmed.
 XML Download