

 PDF
PDF ePub
ePub Citation
 Print
Print


INTRODUCTION
Attrition, abrasion, erosion, and cusp fracture are generally considered causes of tooth wear. Regardless of etiology, tooth wear represents a degradation of the tooth enamel structure due to the combined effects of these mechanisms. Clinicians should examine the level of tooth wear with specific criteria to make a proper diagnosis of a patient's oral health.
Many ways of measuring tooth wear, including qualitative and quantitative methods, have been developed. Typically, qualitative methods are conducted by trained clinicians in intraoral or dental cast examinations. The advantages of these methods are that they are intuitive, rapid, and do not require specific space or equipment. Eccles [1] introduced the erosion index, which allows for a broad interpretation. Smith and Knight [2] proposed a more comprehensive tooth wear index concept that included attrition, abrasion, and erosion. Based on this concept, other indices were introduced. Hooper et al. [3] proposed a new tooth wear index (NTWI) for incisal and occlusal wear. Since then, many qualitative methods have been suggested for assessing erosion [4] and the status of restorative materials [56].
The disadvantages of qualitative methods are that they are more subjective and require guidelines for training and calibration to ensure the reliability of the data [23]. Moreover, the diversity of these indices leads to a lack of standardization and problems in making direct comparisons of results across studies. In contrast, quantitative methods combined with 3-dimensional (3D) reconstructed virtual dental models have many advantages. When researchers quantitatively measure the status of wear, they require less training and no calibration. The results are expressed as ratio scale numbers, not on an ordinal scale. Therefore, sophisticated statistical analyses are possible. Moreover, 3D scanner technology and dedicated software have been further developed and are easy to use.
Generally, clinicians consider that the lingual cusps of the maxilla and the buccal cusps of the mandible wear more rapidly because they are functional cusps [7]. Focusing on faster-worn cusps could increase the accuracy of measurements. Therefore, if the wear of the main functional cusps is measured separately, more reliable results can be obtained, although measuring all cusps can yield more comprehensive results [8].
We previously developed new quantitative methods using virtual models for the measurement of tooth wear, but these methods had limitations. For example, too many points were imprinted, the definitions of the parameters were not easy to understand, and evaluating the wear condition of each separated cusp was impossible. Therefore, the purpose of this study was to develop and evaluate easier and more intuitive quantitative parameters using cusp area and volume.
Go to : 
MATERIALS AND METHODS
Study design
The subjects of this study were the same virtual models used in our former study [9]. Briefly, 90 maxillary and mandibular dental casts were prepared and rendered as virtual 3D models and stored on a hard disc as CAD image files. The same age group classification and data from NTWI scoring were also reused. Intra- and inter-observer reproducibility of the NTWI scoring was obtained by kappa statistics and percentage agreement scores (PASs) in the former study. The study design was approved by the Institutional Ethics Review Board of Seoul National University School of Dentistry (IRB identification No. S-D20150008). Patients were informed about the survey and provided written informed consent.
Reconstruction of virtual 3D models
The dental casts were scanned repeatedly 10–20 times with an Opto TOP-HE 3D scanner (Breuckmann GMBH, Meersburg, Germany). After scanning, information about the full-mouth dental casts, including undercuts, was obtained. Digital dental casts were combined and rendered as 3D models using Rapidform XO software (INUS Technology, Seoul, Korea). The 3D models were then measured and analyzed with Rapidform 2004 software (INUS Technology).
Area and volume measurement processes
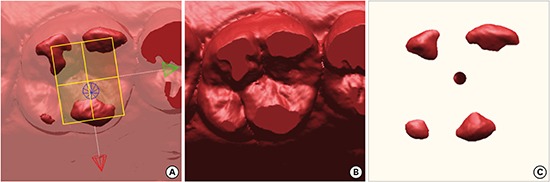
The highest point of each cusp was marked as a reference on the first molar of the virtual models using the automatic recognition function of the software. A virtual occlusal plane was generated with these reference points (Table 1). In the maxilla, only the mesiobuccal cusp point (MBCP), mesiolingual cusp point (MLCP), and distobuccal cusp point (DBCP) were used for the plane because the level of the distolingual cusp point (DLCP) was quite low and small in size. This is the same concept that was used with the buccal occlusal plane (BOP) in the former study (Figure 1). In the mandible, the MBCP, MLCP, DBCP, and DLCP were used via the least squares method of the software. The plane was then lowered vertically by 0.2, 0.4, 0.6, and 0.8 mm to create the offset planes. The area and volume of each cusp were then measured and added together at the levels of 0.2, 0.4, 0.6, and 0.8 mm for the respective cusps (Figure 2). The area and volume at the level of 0.2 mm, for example, were abbreviated as 0.2A and 0.2V.

 | Figure 1Reference points and virtual occlusal plane. (A) a: MBCP, b: DBCP, c: MLCP. (B) Virtual occlusal plane. (C) Offset planes at 0.2 mm intervals.MBCP: mesiobuccal cusp point, DBCP: distobuccal cusp point, MLCP: mesiolingual cusp point.
|

Table 1
Reference points and virtual occlusal planes in the maxillary and mandibular first molars
MBCP: mesiobuccal cusp point, MLCP: mesiolingual cusp point, DBCP: distobuccal cusp point, DLCP: distolingual cusp point.
![]()
Intra- and inter-observer reproducibility
Intra- and inter-observer reproducibility for NTWI scoring was determined in the former study. The intra-class correlation (ICC) and the standard deviation of measurement error (SDME) for the area and volume data were calculated in 10 samples using the methods described in the former study.
Statistical analysis
All the data were sub-grouped according to age and NTWI score groups. The mean±standard deviation of each subgroup was calculated, and 1-way analysis of variance (ANOVA) was performed, followed by the Duncan test as a post hoc analysis for testing subgroup differences. Non-parametric Spearman ρ coefficients were calculated between all parameters and the age and NTWI groups.
To compare the differential features of each cusp, the 0.6A level in the maxilla was selected. The wear rate at 0.6A of each cusp across the age and NTWI groups was expressed as a percentage. In addition, non-parametric Spearman ρ coefficients were calculated between the 0.6A values of each cusp of the maxilla and the age and NTWI groups. The statistical analysis was performed using statistical software (SPSS version 11.5, SPSS Inc., Chicago, IL, USA).
Go to :
RESULTS
Since the subjects of this study were the same virtual models used in our former study, the same age group classification and NTWI scoring system were also reused. The intra- and inter-observer reproducibility of the NTWI scoring was previously checked by kappa statistics and PASs in the former study.
The reproducibility of the quantitative measurements with new parameters was determined by the ICC and SDME. The ICC was very high (over 0.99) and the SDME was low (0.32–0.62 for area and 0.07–0.33 for volume), which demonstrated that the inter-observer differences were negligible. These parameters exhibited good reproducibility, although the 0.2A and 0.2V measurements showed the worst values.
The means and standard deviations of each parameter are presented according to the age and NTWI groups (Tables 2 and 3) with the significance results from 1-way ANOVA. In all age groups, all parameters for the maxilla and mandible were significantly different between the groups and according to the post hoc Duncan test, except for 0.2A in the mandible and 0.2V in both the maxilla and mandible. In the NTWI groups, the 0.6A and 0.8A values of the maxilla were different in every group and the 0.6A and 0.8A values of the mandible were different in 4 groups according to the post hoc Duncan test. The findings from this study were more promising than the results reported in our former study. The Spearman ρ coefficients for correlations between the wear parameters and the age and NTWI groups are shown in Table 4. All the parameters were statistically significant (P<0.01). The scores of the 0.6A and 0.8A measurements in both the maxilla and mandible were higher than the parameters investigated in our former study, such as the buccal cusp angle.
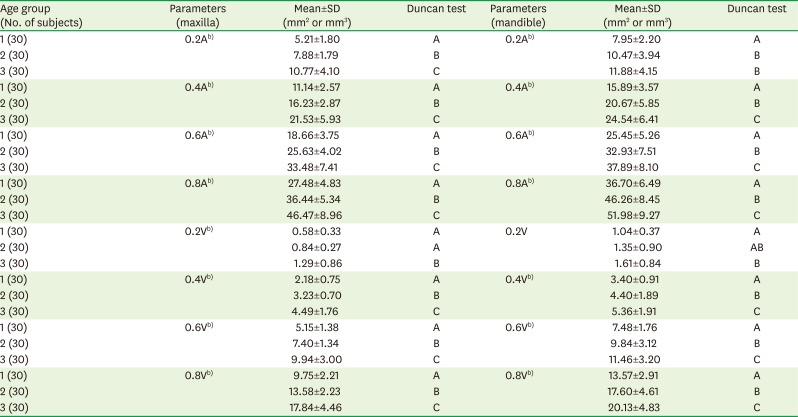
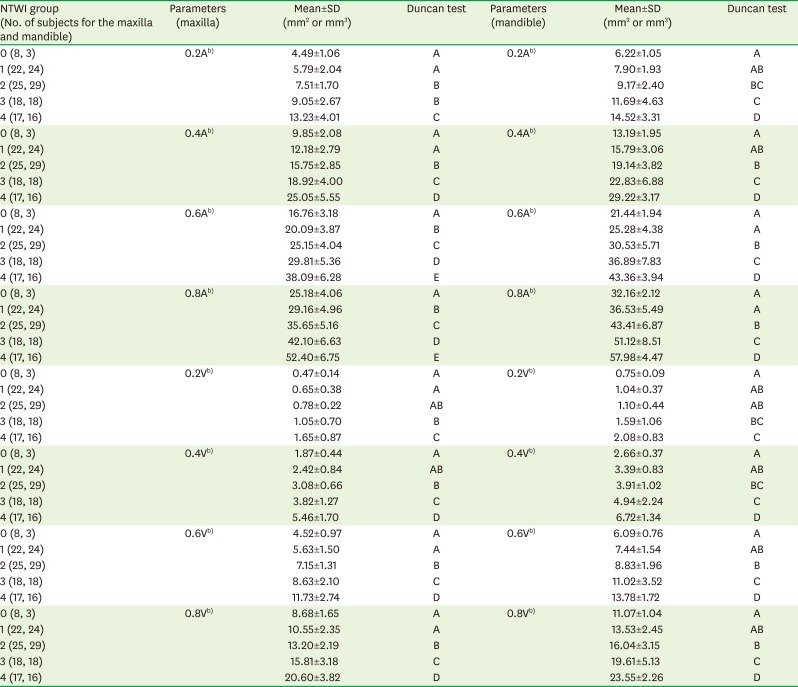
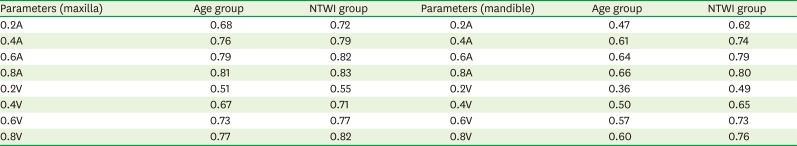
Table 2
Means and standard deviations for the parameters across age groupsa)
SD: standard deviation.
a)The same letters indicate a non-significant difference between the groups based on the post hoc Duncan test. Statistical significance was tested by 1-way analysis of variance among the groups; b)P<0.01.
![]()
Table 3
Means and standard deviations for the parameters in the NTWI groupsa)
NTWI: new tooth wear index, SD: standard deviation.
a)The same letters indicate a non-significant difference between the groups based on the post hoc Duncan test. Statistical significance was tested by 1-way analysis of variance among the groups; b)P<0.01.
![]()
Table 4
Spearman ρ coefficients between wear parameters and the age and NTWI groups
![]()
The mesiobuccal cusp (MBC) and distobuccal cusp (DBC) did not exhibit a difference in the 0.6A measurements in the maxilla, while the mesiolingual cusp (MLC) showed a statistically significant difference (P<0.01) from the MBC and DBC in the paired t-test. In the mandible, every cusp showed a statistical difference (P<0.01) in the 0.6A measurements (Tables 5 and 6).
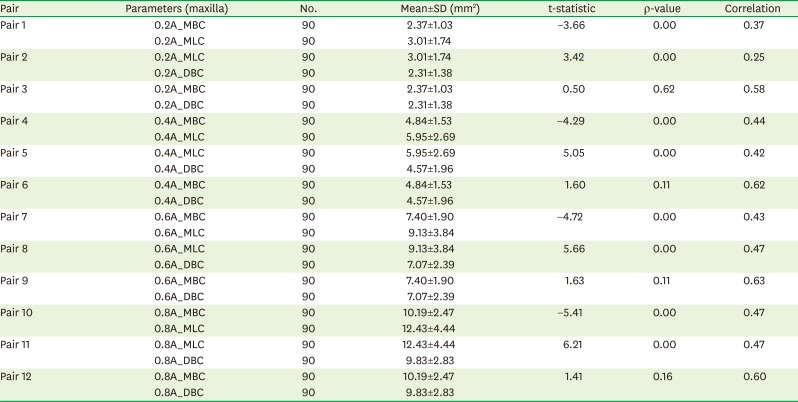
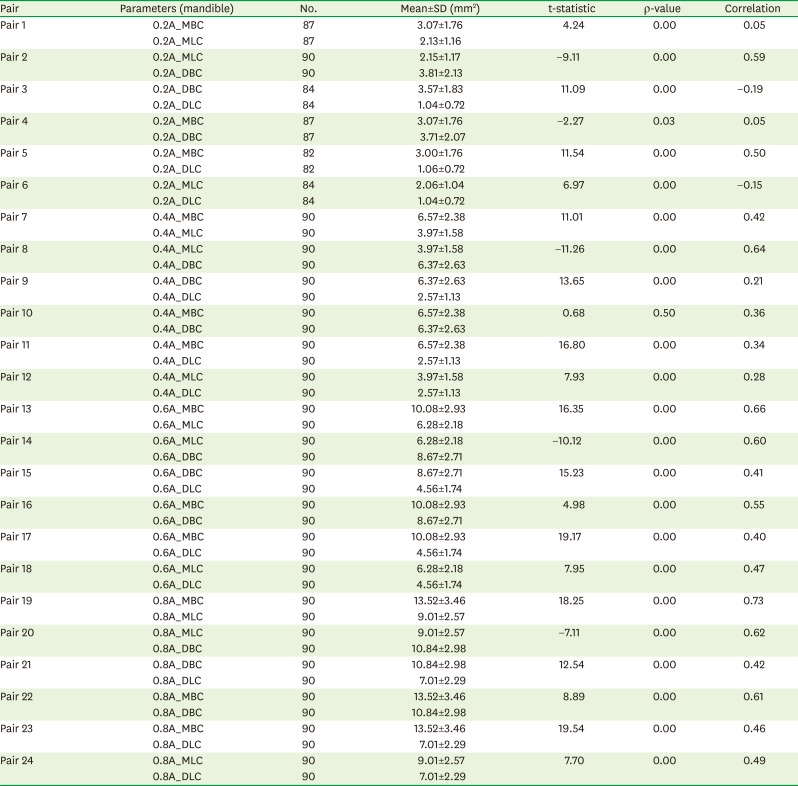
Table 5
Comparisons between the MBC, MLC, and DBC areas of the maxilla using the paired t-test
![]()
Table 6
Comparisons between the MBC, MLC, DBC, and DLC areas of the mandible using the paired t-test
MBC: mesiobuccal cusp, MLC: mesiolingual cusp, DBC: distobuccal cusp, DLC: distolingual cusp, SD: standard deviation.
![]()
In the maxilla, the MLC exhibited the highest percentage change in the 0.6A measurements within the age and NTWI groups, in comparison to the other cusps (Table 7), while the changes in all the cusps were similar in the mandible (Table 8).
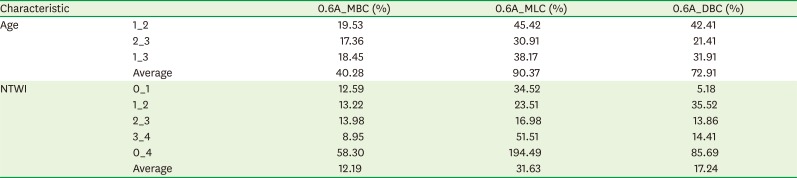
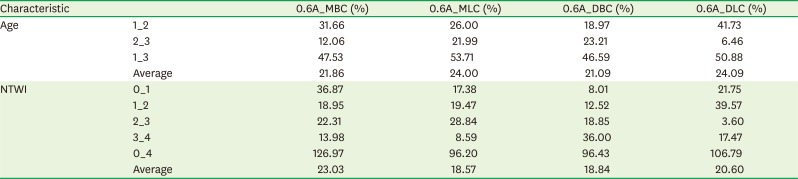
Table 7
Rate of increase of the maxillary cusps in the 0.6A measurements within the age and NTWI groups
![]()
Table 8
Rate of increase of the mandibular cusps in the 0.6A measurements within the age and NTWI groups
NTWI: new tooth wear index, MBC: mesiobuccal cusp, MLC: mesiolingual cusp, DBC: distobuccal cusp, DLC: distolingual cusp.
![]()
Table 9 displays the Spearman ρ coefficients between the total area and each cusp area in the 0.6A measurements. In the age groups, the MLC showed the highest score in groups 1 (under 11 year) and 2 (from 23 to 39 year), while the DBC exhibited the highest score in group 3 (from 40 to 75 year). In the NTWI groups, the DBC showed a consistently high score, while the MLC was not significantly different in groups 3 (moderate wear) and 4 (severe wear).
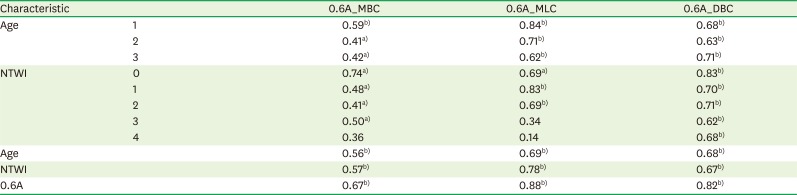
Table 9
Spearman ρ coefficients between the total area and each cusp area within the age and NTWI groups
NTWI: new tooth wear index, MBC: mesiobuccal cusp, MLC: mesiolingual cusp, DBC: distobuccal cusp.
a)P<0.01; b)P<0.05.
![]()
Go to :
DISCUSSION
In this study, quantitative analytical parameters were newly developed and evaluated. Although the authors had already developed and evaluated the distance and angle parameters, the initial versions were not simple or intuitive and made isolated cusp analysis impossible.
As the tooth undergoes wear, the tip of the cusp gradually becomes blunt, making the cusp height lower than before. As a result, the total tooth crown height is lowered and the horizontally sectioned area and volume of the tooth are enlarged. Previous studies have measured crown height from the cementoenamel junction to the cusp tip [10]. Errors can be introduced through this method by the direction of the measurements and subjective judgment. Other sophisticated quantitative measurement methods use depth gauge and moiré fringe patterns, even though equipment-dependent limitations remained [1112]. The concept of the depth gauge method was applied in our former study to the deepest point distance, while this study used a method similar to the moiré fringe pattern method. The main difference between the moiré fringe pattern method and the method used in this study is that not only the cusp height was measured, but the area according to the cusp height was also determined, which was impossible using the traditional analog technique. Butler [13] demonstrated a similar technique by using the occlusal plane and a protractor to measure the angle of the helicoidal plane, even though a slight variation in alignment resulted in angle differences. Other quantitative methods use in vitro devices that have been developed to test the physical characteristics and clinical usefulness of dental materials [14], and attempts have been made to obtain reliable and repeatable results by simulating the environment of the oral cavity. However, if different devices are applied, different results could be obtained with the same materials [15]. Because internationally accepted in vitro methods do not exist, there are many limitations in examining tooth wear conditions [16].
Therefore, we developed and evaluated new parameters [9]. These parameters assessed distances and angles involving at least 2 cusps simultaneously. However, they were somewhat conceptual and difficult to understand without figures, making the interpretation of each cusp wear tendency impossible. The new parameters presented in this study use the nature of cusp wear itself, along with the sectioned area and volume. Wear facets have been measured through the morphometric analysis of molar crowns [17] or by using the occlusal fingerprint analysis method [18], which took into account the projected cusp area to reference the cervical plane. This method required the area of the occlusal plane floor and was not suitable for detecting longitudinal changes in wear. Regarding the volume analysis, we attempted to measure the amount of cusp wear using a surface matching algorithm that required datasets and a long study period [19]. Even very small differences in the amount of wear in the matching models resulted in significant errors. To overcome these problems, new parameters were developed using the occlusal plane.
For evaluation, the measured data were subdivided into age and NTWI groups following our former study. Comparing the results with the former study, this study showed a more distinct difference between the groups in the ANOVA test, especially for the maxilla parameters in the NTWI groups. In the former study, no parameters could differentiate every group. Although the cusp plane height from the central pit had the most powerful discriminatory capacity, it was higher in the more worn group (NTWI score 1) than in the score 0 group. The 0.6A and 0.8A values of this study exhibited a clear difference between NTWI scores 0 and 1. While 0.6A and 0.8A only differentiated 4 groups in the mandible, they did not discriminate between NTWI scores 0 and 1. This may have been due to the small number of cases of NTWI score 0 (3 cases) and the differential wear pattern of the lingual cusp of the mandible [9]. The Spearman ρ coefficients between the wear parameters and the age and NTWI groups also exhibited a similar tendency. The 0.6A and 0.8A values showed higher coefficients than in the former study. Therefore, this study presents an improved method for tooth wear research.
Another advantage of this method is the ability to present the differential wear status of each cusp. First, each cusp area was statistically compared using the paired t-test. The MBC and DBC of the maxilla did not differ from each other through all the slice heights. This demonstrated that the cusp sizes were similar and that the MLC was larger than the other cusps, as expected. The MBC was the largest in the mandible, followed by the DBC, MLC, and DLC, in the order of decreasing area. However, this result does not directly correspond with the real cusp size, especially in older subjects, because of tooth wear tendencies. Typically, the buccal cusps of the mandible exhibit worn and rounded tips with relatively unworn lingual incline surfaces, while the lingual cusps show relatively sharp tips and worn buccal inclines. Therefore, the parameters used in this study correspond to tooth wear tendencies.
Generally, the maxilla exhibited clearer results than the mandible, and the 0.6A and 0.8A values showed clearer results than the other parameters. However, the 0.8A value could not be measured in some cases, so the 0.6A values of the maxilla were selected for a focused analysis. The MLC in the 0.6A measurements showed a high coefficient for all NTWI groups, although it was low for groups 3 and 4. This may be related to the wear rate in groups 3 and 4. The gap between these groups was 51.51%, in contrast to 8.95% and 14.41% for the MBC and DBC in the 0.6A measurements, respectively. The area differences between age groups 1 and 3 and NTWI groups 0 and 4 were 90.37% and 194.49%, respectively. Moreover, the MLC in the 0.6A measurements exhibited a statistically significant difference (P<0.01) with MBC and DBC in the paired t-test. These results indicate that the amount of wear of the MLC was greater than that of the MBC and DBC, which is connected with differential wear patterns between the buccal and lingual cusps. This finding was suggested by the former study, and the current study presents further evidence regarding differences in functional and non-functional cusp wear. Our findings agree with those of other studies that reported that functional cusps experienced wear more rapidly than other cusps [720].
The average life expectancy of humans is increasing with the development of medical technology and improvements in living conditions. The geriatric population is growing rapidly in many countries. In North America, people over 65 years experienced pathological wear 3 times more than young people [21]. Additionally, as more people are becoming interested in living a healthier and happier life, demands for medical care have suddenly increased.
Although this study has limitations because of its cross-sectional design, it suggests better quantitative parameters and analytical tools for the characteristics of cusp wear. Therefore, these results may be helpful for clinicians and researchers who are investigating tooth wear.
Go to :
 XML Download