

 PDF
PDF Citation
 Print
Print


INTRODUCTION
Osteoporosis increases the risk of fracture, which can increase morbidity and mortality.1 Thus, osteoporosis prevention is better than treatment.2 In addition, osteoporosis is multifactorial, and its reported risk factors include advanced age, women, low body mass index (BMI), smoking, family history, lifestyle changes, and medical history.23 Many women experience rapid bone loss in the postmenopausal period. In postmenopausal women, reproductive factors such as age at menarche, breastfeeding, and number of pregnancies have been suggested as risk factors of osteoporosis, although this has been the subject of controversy.45 Moreover, the effect of maternal age on bone mineral density (BMD) in a woman's later life is unclear.678
In this study, we investigated the relationships between osteoporosis and reproductive factors such as age at first and last childbirth, parity, age at menopause, and lactation in Korean postmenopausal women by using data from the 2010–2012 Korean National Health and Nutrition Examination Survey (KNHANES).
METHODS
Database and study subjects
The subjects were obtained from the KNHANES of the Division of Chronic Disease Surveillance of the Korea Centers for Disease Control and Prevention. The KNHANES, which is a nationwide, population-based, cross-sectional health examination survey, can be used to monitor the general health and nutritional status of the Korean population.9 The survey was conducted by trained investigators and comprised three components: a health interview, a health examination, and a nutrition survey. For the survey performed between 2010 and 2012, target participants were selected from the 2009 National Census Registry by means of a stratified, multistage, probability sampling design that was based on geographic area, sex, and age. KNHANES uses a rolling sampling design; hence, the samples from each year are independent and homogeneous. Selected samples are weighted to ensure that they represent the non-institutionalized female civilian population in Korea. All participants in this survey signed informed consent forms.
Participants and definition
Among all individuals who participated in the survey between 2010 and 2012 (n = 25,534), the current study included only postmenopausal women participants (n = 4,546). Women who had no childbearing history or for whom data were missing were excluded. In total, 1,328 women were included in this study. Previous studies of postmenopausal women have demonstrated that obesity is protective against osteoporosis. Thus, we divided participants into two obesity groups: general obesity and non-general obesity, which were based on BMI. In addition, we subdivided the participants into non-abdominal obesity and abdominal obesity groups based on waist circumference (WC).
The physical examination provided measurements of height, weight, and WC by using standard procedures. Height and WC were measured to the closest 0.1 cm. WC was measured midway between the costal margin and the iliac crest at the end of a normal expiration. Weight was measured to the closest 0.1 kg, and BMI was calculated with the formula: BMI = weight (kg)/height (m2). BMD was measured in central skeletal sites (femoral neck [FN] and lumbar spine [LS], L1–L4) by using dual-energy X-ray absorptiometry (DXA; DISCOVERY-W; HOLOGIC, Marlborough, MA, USA). The DXA results were analyzed by applying the standard techniques in Korean Society of Osteoporosis and Hologic Discovery software (version 13·1). The diagnosis of osteoporosis was based on the BMD measurement obtained from the DXA results for the FN, and LS according to the World Health Organization (WHO) diagnostic classification criteria.10 Osteoporosis is defined by the WHO as a BMD 2.5 standard deviations or more below the mean peak bone mass (i.e., average of a young, healthy adult, race- and sex-matched reference population) as measured by DXA.11 General obesity is defined as a BMI ≥ 25 kg/m2 in Asian participants.1213 The presence of abdominal obesity, a measure of metabolic syndrome, was based on a WC > 80 cm.
Self-reported questionnaires were used to determine smoking status, alcohol consumption, exercise, education, and income status, and reproductive factors such as number of pregnancies, menopausal status, oral contraceptive (OC) use, hormone replacement therapy, age at first childbirth, and age at last childbirth. Menopause was defined as having no menstruation during the past 12 months. Regular exercise meant that the participant engaged in moderate exercise for longer than 30 minutes at a time at least five times per week or in intense exercise for longer than 20 minutes at a time at least three times per week. Heavy drinkers were defined as those who drank over 30 g pure alcohol per day. Current smokers were those subjects who currently smoked and had smoked at least 100 cigarettes in their entire lives. Income level was stratified based on age and sex, with the lowest income level corresponding to the lowest quartile of family income. In this survey, data regarding glucocorticoid treatment were not included.
Statistical analysis
We used t-tests or χ2 tests to identify differences in baseline clinical characteristics between the osteoporosis groups. Data are presented as mean ± standard error values for continuous variables and as percentage ± standard error for categorical variables. Multivariate regression was used to identify associations between childbearing age and osteoporosis after adjustment for age, smoking, alcohol consumption, exercise, income, educational level, number of pregnancies, OC use, and breastfeeding. Statistical analyses were performed by using SAS version 9.3 (SAS Institute, Cary, NC, USA). A P value < 0.05 was considered to be statistically significant.
RESULTS
In total, 1,328 women (mean age 63.2 ± 0.4 years) in a menopausal state were included in the study. Of these women, 468 (35.24%) were diagnosed with osteoporosis, 651 (75.7%) were diagnosed with osteopenia, and 209 (24.3%) had normal bone density. There were significant differences between the osteoporosis and non-osteoporosis groups in age, BMI, WC, parity, ages at last and first childbirth, age of menarche, daily calcium intake, exercise, education level, income, history of OCs, history of breastfeeding, and history of hormone replacement therapy. In the osteoporosis group, the mean age was older, BMI was lower, WC was smaller, parity was higher, maternal age at first childbirth was younger, maternal age at last childbirth was older, and age of menarche was older than in the non-osteoporosis group.
Table 1 displays the clinical characteristics of the study population according to general obesity status (BMI ≥ 25 kg/m2). In the non-general obesity group (BMI < 25 kg/m2), there were differences between the osteoporosis and non-osteoporosis groups in educational level, low income, location (rural and suburban), parity, use of hormone replacement therapy, history of breastfeeding, daily calcium intake, and maternal age at first and last childbirth (all P < 0.05). In the general obesity group, there were significant differences between the osteoporosis and non-osteoporosis groups in regular exercise, parity, history of breastfeeding, daily calcium intake, and maternal age at first and last childbirth (all P < 0.05).
Table 1
Clinical characteristics and bone marrow density
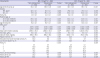
Values are presented as mean ± standard deviation or frequency (%).
BMI = body mass index, WC = waist circumference, BMD = bone mineral density, FN = femoral neck, LS = lumbar spine, OC = oral contraceptive, HRT = hormone replacement treatment.
![]()
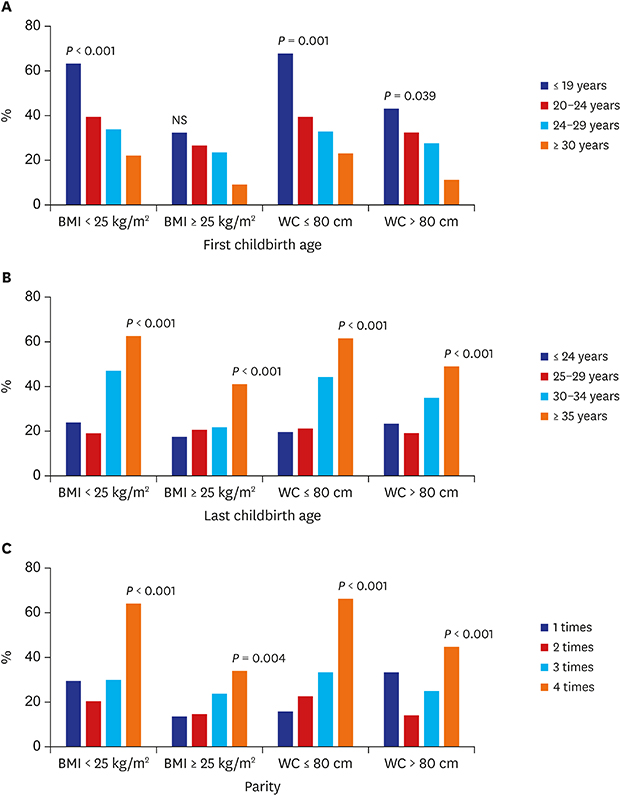
Fig. 1A and B shows the prevalence of osteoporosis among the four obesity status groups (2 BMI and 2 WC groups), subdivided at 5-year intervals based on age at first and last childbirth. Fig. 1C shows the relationship of parity with the prevalence of osteoporosis according to the state of obesity. The prevalence of osteoporosis increased linearly as the age at first childbirth decreased by 5-year intervals in all four groups. However, the results were not statistically significant in the general obesity group (BMI ≥ 25 kg/m2). The age at last childbirth (at 5-year intervals) and parity significantly influenced the prevalence of osteoporosis, regardless of general (BMI ≥ 25 kg/m2) or abdominal (WC > 80 cm) obesity status (P < 0.001). However, these relationships were non-linear in the non-general obesity and abdominal obesity groups. In women older than 35 years old at last childbirth, the prevalence of osteoporosis was relatively high in all groups. The prevalence of osteoporosis was significantly greater in women with parity ≥ 4 in all groups.
 | Fig. 1Prevalence of osteoporosis related to women's obesity status, based on BMI or WC, according to childbearing age and parity.BMI = body mass index, WC = waist circumference, NS = not significantly different.
|
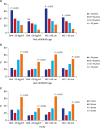
Table 2 displays the results of the multivariate regression analysis of the relationships of first childbirth, last childbirth, and parity with osteoporosis. Age at last childbirth correlated negatively with osteoporosis. BMD at the FN in models 2 (β = −0.013 and P = 0.030) and 3 (β = −0.018 and P = 0.010) correlated negatively with age at first childbirth in the non-general obesity group. In model 4, BMD at the FN (β = −0.014 and P = 0.026) correlated negatively with age at last childbirth in the non-general obesity group. However, BMD at the FN did not correlate with age at first or last childbirth or parity in the general obesity group (P > 0.05). In the general obesity group, there was no significant correlation of BMD at either site with maternal age at first and last childbirth or with parity, in models 2, 3, or 4 (all P > 0.05).
Table 2
The linear relationship between childbearing age or parity and BMD according to BMI
Values are presented as β ± standard error. Model 1 was adjusted for age and BMI. Model 2 was adjusted for the covariates of Model 1 and smoking, alcohol consumption, exercise, education, and income. Model 3 was adjusted for the covariates of Model 2 and oral contraceptive use, HRT use, breastfeeding experience, daily calorie intake, calcium intake, and fat intake. Model 4 was adjusted for the covariates of Model 3 and age at first childbirth, age at last childbirth, and parity.
BMD = bone mineral density, BMI = body mass index, FN = femoral neck, LS = lumbar spine, HRT = hormone replacement treatment.
aAge at first childbirth; bAge at last childbirth; cHRT.
![]()
DISCUSSION
This study examined the relationship between maternal age at childbirth and postmenopausal osteoporosis in Korean women by analyzing data from the 2010–2012 KNHANES. We observed that earlier maternal age at first childbirth, later maternal age at last childbirth, and higher parity increased the risk of postmenopausal osteoporosis later in life.
Many previous studies have shown that parity is associated with a risk of postmenopausal osteoporosis.141516 Our results are consistent with the results of these studies. The prevalence of postmenopausal osteoporosis gradually increased with increasing parity. In all groups, postmenopausal osteoporosis was more prevalent among women who had four or more children than among the other women. However, after adjustment for all confounding factors, there was no statistically significant difference in BMD values according to parity. Some reports have not demonstrated a positive relationship between high parity and prevalence of postmenopausal osteoporosis.51819 Lenora et al.17 found that history of high parity had no association with risk of postmenopausal osteoporosis. Other reports have suggested that high parity is protective against osteoporosis at postmenopausal age.192021
Our study demonstrated that an advanced maternal age at last childbirth was associated with an increased risk of postmenopausal osteoporosis. This finding remained significant after adjustment for several potential confounding factors, including exercise, daily calorie intake, calcium intake, and aspects of reproductive history such as childbirth age and parity. Some studies have shown that women with an older maternal age at childbirth have a higher prevalence of postmenopausal osteoporosis.822 Moreover, it has been suggested that women who were older than 30 years at last childbirth and who had given birth more than three times were at higher risk of postmenopausal osteoporosis.16
A possible explanation for the relationship between older maternal age at last childbirth and osteoporosis is that higher parity mediates this effect; in other words, women with higher parity may continue to deliver children when they are older.22 However, there was a significant correlation between maternal age at last childbirth and postmenopausal osteoporosis after adjustment for parity in this study. The mechanism of this association is not yet sufficiently clear, but it could be explained as follows. Although women with idiopathic osteoporosis related to pregnancy recover spontaneously within a few months postpartum, most studies of this phenomenon have examined younger women. In general, bone mass peaks between 27 and 35 years old.2324 Bone loss in women begins approximately at the age of 40 years and accelerates around the time of cessation of estrogen.25 Thus, it is possible that women who give birth after the age of 35 do not rapidly recover from the bone loss during pregnancy. In Korea, an increasing number of people are delaying marriage for sociological or economic reasons, and the average age at marriage is increasing. The maternal age has increased as well, and more women over the age of 35 are having babies. In our study, a maternal age ≥ 35 years at last childbirth was a strong predictor of postmenopausal osteoporosis. For these reason, woman with advanced maternal age at last childbirth may not fully recover BMD after delivery, and may increase the risk of developing postmenopausal osteoporosis. In addition, there was a significant negative association between age at first childbirth and postmenopausal osteoporosis. The mechanism underlying this association is unclear, but there are several possible explanations. The first possible explanation is the association between history of childbirth at an early age and parity. Younger maternal age at first childbirth may correlate with increased parity.26 In addition, BMD values decrease with increasing number of pregnancies.514151626 Secondly, a younger age at first childbirth may be associated with pregnancy prior to reaching peak bone mass.22242728 The pregnancy and lactation periods may coincide with the critical time of bone accumulation. Thus, women with a history of childbirth at younger maternal age, < 27 years old, are at an increased risk of postmenopausal osteoporosis.23 Thirdly, a younger maternal age may be associated with a prolonged breastfeeding duration. Moreover, this also increases the risk of postmenopausal osteoporosis.2125262729 Fourthly, childbirth at an earlier age is usually associated with socioeconomic factors such as low income, low education, and poor nutrition, which are related with osteoporosis.30
In our study, it appeared that maternal age at first childbirth had a negative relationship with osteoporosis in postmenopausal women. However, this association was not significant in obese postmenopausal women after adjustment for confounding factors, regardless of whether obesity was based on BMI or WC. This result suggests that the effect of obesity on osteoporosis is stronger than the effect of age at first delivery.3132 Another study demonstrated that there was no significant association between age at first childbirth and osteoporosis in postmenopausal women.23 Likewise, Pirkle et al.30 reported that there was no significant association between early maternal age at first birth and osteoporosis, arthritis, cancer, or coronary heart disease. Our data are consistent with the results of the studies that reported no association between age at first childbirth and osteoporosis.21 The study that reported that postmenopausal women whose first delivery occurred at age 24–29 years had a significantly increased risk of osteoporosis.23
In our study, low income, high parity, history of breastfeeding, old age, younger first childbirth age, older last childbirth age, and late menarche age were positively associated with the prevalence of postmenopausal osteoporosis, whereas obesity, high calcium intake, and high fat intake were negatively associated with prevalence of postmenopausal osteoporosis. Obesity exerted the strongest protective effect against postmenopausal osteoporosis. Several studies have suggested that there is a positive relationship between obesity and BMD, and it is generally accepted that obesity has a protective effect on bone tissue. In particular, obesity is considered to protect against osteoporotic fractures in postmenopausal women.3031
Menopause is the cessation of ovarian estrogen production, which is associated with increased bone loss. After menopause, fat tissue becomes the dominant source of estrogen synthesis. In addition, a high BMI (i.e., general obesity) has a positive effect on bone formation mediated by mechanical loading. However, some studies have revealed the opposite: that is, obesity is not beneficial or has a negative effect on osteoporosis.32 Moreover, some studies suggest that a higher lean body mass predicts a higher BMD, whereas the fat component of obesity does not exert a protective effect on bone mass. In this study, we defined obesity by using either BMI or WC, with WC reflecting fat mass. Thus, we regard our results on the relationship between obesity and postmenopausal osteoporosis as reliable. However, Kim et al.32 reported that that a high percentage of body fat and a large WC were related to low BMD and vertebral fracture, which they attributed to certain components of metabolic syndrome. Many young women are concerned with their body shape and size and are eager to reduce their body weight and perform weight training. Although a reduction in body weight can improve physical function in obese women, excess weight loss in non-obese women may be associated with bone loss, reduced BMD, and increased fracture risk. Therefore, women of reproductive age should be advised to prevent bone loss resulting from excessive dieting-induced weight loss. Further, it should be recommended that non-obese women who have more than four children or give birth after 35 years of age undergo therapeutic interventions such as calcium intake to reduce the risk of bone loss.
The present study has several potential limitations. Firstly, our study was retrospective study using cross-sectional data. We could not include several confounding factors in our analysis due to an absence of data, such as duration of breastfeeding, BMI before childbirth, BMD at reproductive age, history of treatment for osteoporosis, history of fracture and metabolic syndrome. Thus, we could not confirm the relationship between postmenopausal osteoporosis and low BMD in the reproductive period. For the same reason, we could not control for potential confounding factors such as current users and past users of OC or hormone replacement treatment (HRT) which could affect bone density. The use of OC and HRT was assessed as whether there was any use or never use, because information is lacking on current or past use of OC and HRT in 2010–2012 KNHANES. Secondly, because this study used KNHANES data, the BMD result was measured with a variety of DXA scans in different organizations. It is not a result of the same conditions. Thirdly, because these data were based on memory recall-based questionnaires, there was the possibility of recall bias. Finally, the women included in this study group were born in the 1940s–1950s, and since that era, various factors have changed, including the overall nutritional status of the population. Thus, the results of this study may not apply directly to modern era young women. We will need to verify our results through further well-designed prospective research regarding the association of the age at childbirth and bone mass.
In conclusion, non-general obese postmenopausal women of an older age at last childbirth and with higher parity are at an increased risk of osteoporosis. Obesity exerted the strongest protective effect against postmenopausal osteoporosis. Further research is needed to clarify the associations between obesity and reproductive characteristics.
 XML Download