

 PDF
PDF Citation
 Print
Print


INTRODUCTION
Identification of allergen sensitization is important for the diagnosis and treatment of allergic diseases. Skin prick test (SPT) has been regarded as major standard method for identification of causative allergens in patients with allergic diseases.1 However, studies evaluating different SPT reagents in their in vitro biological allergen potency and protein characteristics, as well as in vivo diagnostic value, are scarce.23
Manufacturers of SPT products maintain their own quality control programs and allergen potency units for their reagents. These may cause differences in allergen potency and clinical validity of the products.45 In this context, standardization of SPT reagents should be warranted.67
In Korea, three manufacturers (two European and one American company) have provided SPT reagents. However, the products may not reflect real exposure in Asian countries, including Korea. For example, white oak, which is used as raw material in commercial reagents, is not found in Korea, where sawtooth and Mongolian oak trees are the dominant species.89 The discrepancy between used raw material and real exposure may affect the diagnostic rate of oak pollinosis in Korea. Additionally, various house dust mite (HDM) isoallergens have been reported to be dominant in each country, and the diagnostic value may be affected by the types of isoallergen used in each SPT reagent.9 In this regard, development of SPT reagents that reflect the real allergen exposure in Korean environment is urgently needed.
Recently, we developed SPT reagents for 8 respiratory allergens that reflect real exposure of Korea.10 In this study, we compared allergen characteristics and clinical efficacy of the new SPT reagents using three different commercially available SPT reagents.
METHODS
Trial design
This prospective, double-blind study was permitted by the Institutional Review Board of Severance Hospital, Seoul, Korea. We explored biological activities of 8 different kinds of total extract allergen SPT reagents (Dermatophagoides farinae, Dermatophagoides pteronyssinus, pollens of oak, ragweed, mugwort, Humulus japonicus, cat and dog allergens) from four different manufacturers.
Patient selection
For this study, 94 respiratory allergic patients were enrolled from 109 preselected candidates. Patients with acute asthma exacerbation, severe skin diseases, and chronic diseases (such as autoimmune disease, immune deficiency and cancer), or those who were pregnant were excluded. The use of antihistamines, systemic corticosteroids (≥ 20 mg/day), and topical steroid was discontinued for at least seven days before testing.
Allergen extracts
We compared newly developed SPT reagents (Prolagen, Seoul, Korea) with three different commercial products (Hollister-Stier, Spokane, WA, USA; Allergopharma, Reinbek, Germany; Lofarma, Milano, Italy). To manufacture new SPT product, allergen extracts were prepared as previously described (HDM and pollen extracts).111213 In particular, we used sawtooth oak as the raw material of oak reagent. In respect of dog and cat, hair and dander were collected from designated animal hospitals. Both dogs and cats were trimmed before shampooing. Allergen extracts were prepared in ammonium bicarbonate buffer (pH 8.0) after defatting with ethyl ether. Subsequently, the extracts were dialyzed against distilled water, syringe filtered (0.22 μm; Millipore, Bedford, MA, USA), and lyophilized. Finally, each reagent was stored in 50% glycerinated, 0.3% phenol saline.
SPT
SPT was performed with a 26-gauge needle on the upper back of patients by one experienced technician. Histamine (1.7 mg/mL in 0.3% phenol saline; Allergopharma) and saline were used as positive and negative controls, respectively. Wheals and flares, induced by the allergen and histamine, were measured 15 minutes after prick. SPT was considered positive if wheal diameter was ≥ 3 mm. Negative control must have shown no reaction. In addition to SPT, serum-specific immunoglobulin E (sIgE) levels in response to each allergen were measured using ImmunoCAP (Thermo Fisher Scientific, Uppsala, Sweden). Serum was stored at −20°C before ImmunoCAP measurement. The results were calculated in kU/L for immunoglobulin E (IgE) antibodies, and sIgE antibody values ≥ 0.35 kU/L were considered positive.
In vitro analysis of each reagent
To measure the protein concentration of the reagents, Bradford assay was used, and their integrity was assessed through Coomassie staining in sodium dodecyl sulphate-polyacrylamide gel electrophoresis (SDS-PAGE). Meanwhile, concentrations of each major allergen in SPT reagents were measured by two-site enzyme-linked immunosorbent assay (ELISA). For biological allergen potency evaluations, IgE immunoblotting using pooled sera from allergic patients. In addition, inhibition ImmunoCAP test was used to measure the 50% inhibitory concentration of each allergen.
Statistical analysis
Statistical comparison was conducted using IBM SPSS Statistics Version 23 (IBM Co., Armonk, NY, USA). Cohen's Kappa analysis was utilized to assess the diagnostic concordance rate of SPT reagents with ImmunoCAP. Kappa values were interpreted as follows: almost perfect (0.8–1.0), substantial (0.6–0.8), moderate (0.4–0.6), fair (0.2–0.4), and poor (< 0.2).14 P values < 0.05 were considered statistically significant.
RESULTS
Demographic data of study patients
Ninety-four patients with allergic diseases (bronchial asthma, allergic rhinitis, chronic urticarial, and anaphylaxis) were enrolled in this study to compare in vivo diagnostic properties of the reagents. Demographic data are shown in Table 1. Sixty-one patients (64.9%) were polysensitized to two or more allergens, and allergic rhinitis was the most common allergic disease.
Table 1
Baseline characteristics of participants
![]()
SPT positivity and concordance rates compared with the ImmunoCAP results
Comparison of SPT results is shown in Table 2. Overall, positivity of newly developed Prolagen SPT was similar to that of commercial reagents, except for higher rate of Prolagen SPT shown in oak, ragweed, H. japonicus pollens, and cat allergen.
Table 2
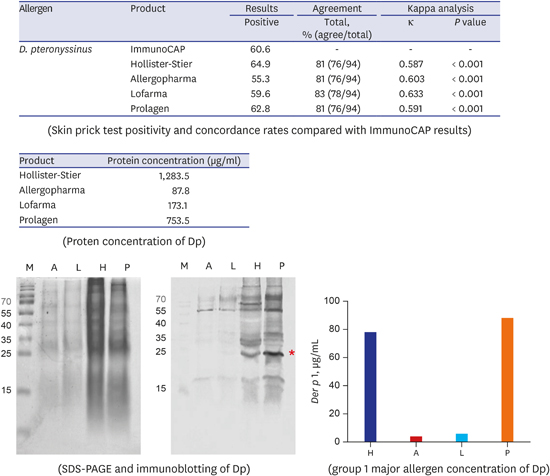
SPT positivity and concordance rates compared with ImmunoCAP results
![]()
Concordance between the results of SPT reagents and serum sIgE levels is also shown in Table 2. Level of agreement between sIgE level and results of Prolagen SPT reagents were almost perfect for mugwort pollen (kappa 0.849), substantial for oak pollen (kappa 0.670), moderate for D. farinae, D. pteronyssinus, H. japonicus, ragweed, and dog (kappa 0.402–0.591), and fair for cat (kappa 0.346). Concordance rates of four different SPT reagents in each allergen, except ragweed reagent by Lofarma, were not significantly different.
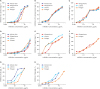
As the oak ImmunoCAP used white oak pollen as raw material, we coated the empty solid phase of ImmunoCAP with sawtooth pollen extract, and compared concordance rates of four SPT reagents. Fig. 1 shows scattered graph of the two measurements using 71 atopic sera. However, results of ImmunoCAP using both raw materials were almost equivalent. Concordance rates of four SPT reagents were also similar whether white oak or sawtooth oak pollens were used as raw material for ImmunoCAP (Table 3).
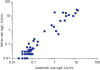 | Fig. 1Scatter plot comparing sIgE levels of sawtooth oak (x-axis) and white oak (y-axis).
sIgE = specific immunoglobulin E.
|
Table 3
Comparison of concordance rates between oak SPT reagents and sIgE measurement by white oak or sawtooth oak coated ImmunoCAP

![]()
In vitro analysis of each reagent
Results of protein quantification for each SPT reagents are shown in Table 4. In the case of D. farinae, D. pteronyssinus, and ragweed, Hollister-Stier was the highest. Other than those HDM allergens, Prolagen reagents showed the highest protein quantity.
Table 4
Protein concentrations for SPT reagents of each allergen

![]()
For SDS-PAGE analysis, we uploaded equal volumes of SPT reagents to compare the protein contents that were applied to patients. SDS-PAGE features showed marked differences among the SPT reagents. Prolagen SPT reagents had especially strong SDS-PAGE bands for HDMs, oak, H. japonicus, and dog. Hollister-Stier SPT reagents had especially strong bands for ragweed pollen, and Lofarma SPT reagents had especially strong bands for mugwort pollen (Fig. 2).
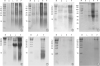 | Fig. 2SDS-PAGE features of SPT reagents for each allergen. (A) D. farinae, (B) D. pteronyssinus, (C) oak, (D) ragweed, (E) mugwort, (F) H. japonicus, (G) cat allergen, (H) dog allergen.
SDS-PAGE = sodium dodecyl sulphate-polyacrylamide gel electrophoresis, SPT = skin prick test, M = Marker, A = Allergopharma, L = Lofarma, H = Hollister-Stier, P = Prolagen.
|
Fig. 3 shows IgE immunoblotting features. Overall trend was similar to SDS-PAGE. Especially, for HDMs, ragweed, mugwort, H. japonicus, cat and dog allergens, Prolagen SPT reagents showed stronger IgE-binding than other reagents.
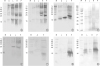 | Fig. 3IgE immunoblotting features of the SPT reagents using the pooled serum of atopic patients (n = 5). (A) D. farinae, (B) D. pteronyssinus, (C) oak, (D) ragweed, (E) mugwort, (F) H. japonicus, (G) cat allergen, (H) dog allergen.
IgE = immunoglobulin E, SPT = skin prick test, M = Marker, A = Allergopharma, L = Lofarma, H = Hollister-Stier, P = Prolagen.
|
Two-site ELISA measurements for major allergens within the reagents were also measured (Fig. 4). For HDM group 1 and 2 major allergens, Hollister-Stier and Prolagen reagents were higher compared to the others. In regards to group 1 major allergen of cat and dog, Hollister-Stier and Prolagen reagents had excellent level of allergen component, respectively.
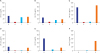 | Fig. 4Two-site ELISA for allergen components. (A) Der f 1, (B) Der f 2, (C) Der p 1, (D) Der p 2, (E) Fel d 1, (F) Can f 1.
ELISA = enzyme-linked immunosorbent assay, A = Allergopharma, L = Lofarma, H = Hollister-Stier, P = Prolagen.
|
Finally, channel-activating protease (CAP) inhibition study was used to evaluate the total allergen potency per protein content of SPT reagents (Fig. 5). Total allergen potencies per protein content of four different SPT reagents were similar, except for low allergen potency observed in Prolagen cat and dog reagents. CAP inhibition study showed outstanding allergenicity for cat SPT of Hollister-Stier, and dog SPT of Lofarma. Despite high protein concentration in Prolagen product, total allergen potency of cat and dog SPT reagents were low.
DISCUSSION
As we mentioned above, discrepancies in allergen potency between commercial SPT reagents have been already reported.515 We compared 8 kinds of SPT reagents from 4 different manufacturers about their allergenic contents, allergenicity, and clinical validity using in vitro and in vivo methods.
Regarding HDMs, Hollister-Stier had the highest amount of protein among all products. This feature was consistent to the result of two-site ELISA measurement of groups 1 and 2 of major HDM allergens. Although marked differences were observed in their in vitro results, diagnostic accuracy of concordance rates between SPT and ImmunoCAP did not show any significant differences among the SPT reagents.
Prolagen reagent showed excellent overall in vitro results in regards to oak allergen. However, in vivo data, such as concordance rate or kappa value, was relatively lower than those of other 2 reagents. We presumed that the differences between Prolagen product and the others might originate from the difference in raw materials used. Commercial SPT and ImmunoCAP products have used white oak as raw material, whereas Prolagen product was made of sawtooth oak pollen extract. Previously, Jeong et al.8 revealed that Mongolian oak and sawtooth oak are the dominant species in Korea, although the study also reported strong cross-reactivity between Fagaceae family (sawtooth oak, Mongolian oak, white oak, and birch pollens). Therefore, we also compared the concordance rates between white or sawtooth oaks pollen extract coated ImmunoCAP sIgE tests and the SPT, and found that the results were almost equivalent whether saw tooth or white oak were used for ImmunoCAP.
In the case of ragweed pollen SPT reagents, protein concentration of Hollister-Stier was overwhelmingly high. However, the concordance rate of Hollister-Stier was not any noticeable differences from Allergopharma and Prolagen products.
For mugwort pollen, Allergopharma and Prolagen products showed better results than the other products. In Korea, mugwort is especially important as weed pollinosis, and it is worth noticing that Prolagen product has high diagnostic value.
H. japonicus, a weed belonging to the Cannabis family and Urticales order, is one of the principal allergenic plants that induce pollinosis between mid-August and late September.161718 Furthermore, the sensitization rate in Korea may increase due to climate change.19 We compared new reagent with that of Allergopharma, which was the only commercially-available reagent in Korea. Our result showed that Prolagen SPT reagent had higher protein content determined by Bradford and SDS-PAGE, but the concordance rates were equivalent to each other.
In regards to cat allergen, Hollister-Stier showed the highest level of Fel d 1 and better allergenicity than the other reagents. On the other hand, Prolagen reagent's allergenicity and concordance rate with ImmunoCAP were lower compared to other 2 reagents, despite of higher protein concentration of Prolagen SPT reagent. Similar pattern was found at dog allergen. Prolagen product displayed significantly higher protein concentration and Can f 1 concentrations, while CAP inhibition results showed weak allergenicity per protein concentration compared to the other products. For dog allergen, in addition to group 1 major allergen, group 2 and 5 major allergens are also important.20 These results may have been caused by the use of only trimmed hair of cat and dog from animal hospital, unlike other companies that collected hair and dander by extensive scrubbing with razor. Our study showed significant variation in allergen potency among the companion animal SPT extracts, which was consistent with the finding of Curin et al.21 who reported that variability in SPT reagents had a negative influence on the diagnosis of dog allergy. Despite of the abovementioned results, concordance rate of Prolagen product, compared to ImmunoCAP, was not inferior to the other products.
Findings of the current study can provide clinically important information to Korean allergists. Although comparison between SPT and CAP systems have been performed before, any comparison study among the commercially available inhalation allergen SPT reagents in Korea was not conducted.22 Additionally, considering that all reagents for diagnosis and immunotherapy is dependent on imports, this study also serves as an inspiring attempt to develop Korean SPT reagents that can reflect the unique Korean environment.823
However, our study had some limitations. We did not consider the differences in vehicle characteristics of SPT reagents. Possibility of degradation resulting from storage condition and duration of storage also has not been considered in this study, even the reagents were evaluated within the documented expiration date. Moreover, Prolagen product has not been formally approved for marketing; therefore, it cannot be currently applied in the clinical field. In order for Prolagen product to be used in clinical settings, further well-designed clinical trials are required.
In conclusion, there are differences in allergenic potency and concentration of major allergens among SPT reagents. This study confirmed that, when it comes to the diagnosis of respiratory allergic diseases, newly developed Prolagen SPT reagents are not inferior to the commercial reagents.
 XML Download