

 PDF
PDF Citation
 Print
Print


INTRODUCTION
Scrub typhus, also known as tsutsugamushi disease, is one of the major zoonotic diseases in an East Asia region called the tsutsugamushi triangle. It is caused by the gram-negative bacterium Orientia tsutsugamushi, and the clinical symptoms include headache, anorexia, and myalgia, with pathognomonic eschar1; it is also related to acute cholecystitis.2 Transmission of scrub typhus occurs through contact with infectious mites, mostly of the family Trombiculidae. The life cycle of the mite consists of seven stages: egg, pre-larval, larval, proto-nymph, deuto-nymph, trito-nymph, and adult. The mites in the larval stage are also called chiggers, and mites exhibit parasitic (host-seeking) behavior only during this period. After growing to the nymph stage, they no longer need hosts for feeding. Their major habitats are places with humid and flourishing vegetation, such as meadows and wetlands, because of the high density of their hosts.3
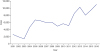
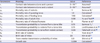
In the Republic of Korea (ROK), scrub typhus was designated as a notifiable infectious disease from 1993, and an annual incidence of less than 300 cases was reported until 1997. However, the reported number of cases increased rapidly in 1998 to more than 1,000, surged again in 2004 to more than 5,000 cases, and maintained that level until 2011. Since 2012, the incidence has increased dramatically, with over 10,000 cases recorded in 2016 (Fig. 1); scrub typhus is the most frequent vector-borne disease in the ROK. Along with its considerable impact on public health, economic loss from scrub typhus is not negligible. Kim4 found that the cost of direct losses, such as treatment costs and reduction of the labor force, would be about 10 billion KRW per year and that the damage would surge with the ripple effect. Moreover, the burden is expected to increase in the future due to climate change.5 Therefore, the increasing incidence and huge economic impact imply that a systematic control strategy for scrub typhus is needed.
Many studies have been performed on scrub typhus. However, until 2000, studies focused mainly on case reports about rare symptoms and co-infection with human immunodeficiency virus-acquired immunodeficiency syndrome, or ecological studies for the density of Trombiculidae mites.6789 After the year 2000, more studies considering other aspects were conducted, such as the association with meteorological factors,10 spatial analysis with geographic information system technology,11 economic damage assessment,4 and future incidence prediction with climate change.5
A limited number of studies on scrub typhus have been conducted with mathematical models. To our knowledge, only two studies in Korea have developed mathematical models for scrub typhus. Lee et al.12 adopted a single-species susceptible-infectious-recovered (SIR) mathematical model to predict future trends of scrub typhus incidence, focusing on the human population. The study by Kim et al.,13 which is used as the fundamental frame of our study, constructed a susceptible-infectious (SI) model with two species: mites and their natural hosts. The underlying assumptions represented ecological characteristics of mites and disease transmission, and the model produced a basic reproductive number between the two species with implications for control strategies. However, an advanced modeling study is needed to integrate both human and ecological dynamics representing the context of Korea. In this study, we developed mathematical models of scrub typhus to understand the transmission dynamics of scrub typhus, and we drew suggestions from these for the best control strategies.14
METHODS
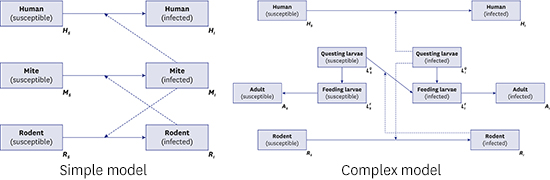
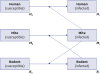
In this study, we developed two dynamic models of scrub typhus. The first model (Fig. 2) reflects the fundamental ecology of transmission with a three-species population: humans, mites, and rodents as the natural host of mites. It describes the disease circulating between mites and their natural host population, and spreading to the human population by accident (spill-over effect).15 Theoretically, transmission from humans to mites is feasible; however, this is ignored because the probability of a human patient experiencing another mite bite without treatment is low, and further effects on the transmission dynamics are negligible. It is also assumed that rodents are the only host species for parasitic mites. Most mammals, such as elk and raccoon dogs, act as natural hosts of the parasitic mite, and their characteristics as hosts can differ due to their immune systems.16 This assumption implies that all parameters related to the natural host population are standardized. We employed the SI model for the rodent and mite groups to simplify the disease dynamics among groups, as demonstrated in previous studies.1317 On the other hand, the human group is considered to represent a SIS model18 because there are many subtypes of scrub typhus infections, and the immunity can last for less than 2 years. For simplification, a closed population, without births and deaths, was assumed for humans, unlike the rodent and mite populations.
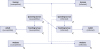
The second model (Fig. 3) represents more realistic transmission dynamics of scrub typhus with a more complicated structure than that in model 1. The fundamental assumptions of model 2 were the same as model 1; differences between the two derived from setting a life cycle-structure for the mite population. The family Trombiculidae, the main vector for scrub typhus, has the following seven-stage life cycle: egg, pre-larval, larval, proto-nymph, deuto-nymph, trito-nymph, and adult. However, in the model, the life cycle was reclassified into three stages, questing larvae (pre-larval), feeding larvae (larval), and adult (nymph and adult) because the important element for the disease dynamic system is interaction with susceptible hosts. In model 2, to reflect the ecology of the Trombiculidae mite, it was assumed that only infectious questing larvae (infectious host-seeking larvae) can transmit infection to the rodent or human population. Trans-ovarian transmission, from adult mites to their offspring, was also considered. In the model of sessile vector-borne diseases, such as tick- and flea-borne diseases, general assumptions for the vector population are, first, that there are two stages, free-living and feeding on the host, and second, that vectors can move bidirectionally, from free-living to feeding and from feeding to free-living.18 However, in the model of this paper, the mites could change their stages only from free-living to feeding (from questing larva to feeding larva, as described above) because, unlike other sessile vectors, the parasitic period of the trombiculid mite is less than 1 week (usually 3 days),3 so the chance of returning to the questing stage was considered negligible. As indicated above, there are some underlying assumptions that support the models; these are summarized in Supplementary Table 1.
Most parameters were adopted from published articles (Tables 1 and 2). Considering that the ecological systems of mites and rodents are greatly influenced by environmental diversity, we used parameters from studies in Korea to maximize practicability. Unlike other parameters, measuring the rate of contact between species (r1, r2) is impractical; hence, there is no appropriate study result for this parameter. Therefore, the contact rate was derived in an alternative manner. For the contact rate between humans and mites (r1), we used the number of scrub typhus cases. Since 2012, the reported cases ranged from 8,000 to over 10,000 cases. Thus, we assumed that 600,000 contacts with bites occurred per year (the transmission probability per bite is 75%; the infection prevalence among mites is 2%).19 Parameter r2, the contact rate between rodents and mites, was calculated from the chigger index, the number of mites on a host, in the same way. The contact rate between two populations was represented as the number of contacts per month divided by the product of the two population sizes.18
Table 1
Parameters used in model 1

| Parameters | Meaning | Value | Reference |
|---|---|---|---|
| r1 | Contact rate between a larva and a person | 2 × 10⁻¹⁷ | Assumeda |
| r2 | Contact rate between a larva and a rodent | 2 × 10⁻¹¹ | Assumedb |
| µR | Mortality rate of rodents | 1 | Same as BRc |
| µM | Mortality rate of mites | 20 | Same as BMc |
| γH | Recovery rate of infected humans | 2 | Plamer et al.1 |
| THL | Transmission probability to humans from a larva bite | 0.75 | Same as TRLd |
| TRL | Transmission probability to rodents from a larva bite | 0.75 | Lerdthusnee et al.33 |
| TLR | Transmission probability to larva from rodent contact | 0.09 | Takahashi et al.34 |
| BR | Birth rate of rodents | 1 | Yoon et al.35 |
| BM | Birth rate of mites | 20 | Kim et al.3 |
Calculated from aincidence case per year and bchigger index of rodents. cTo satisfy the assumption of fixed population size. dAssumed due to lack of available data.
![]()
Table 2
Parameters used in model 2
| Parameters | Meaning | Value | Reference |
|---|---|---|---|
| r1 | Contact rate between a larva and a person | 2 × 10⁻¹⁷ | Assumeda |
| r2 | Contact rate between a larva and a rodent | 2 × 10⁻¹¹ | Assumeda |
| µR | Mortality rate of rodents | 1 | Same as BRa |
| µLQ | Mortality rate of questing larva | 1.5 | Calculatedb |
| µLF | Mortality rate of feeding larva | 7.92 | Calculatedb |
| µA | Mortality rate of adult mite | 0.08 | Yu and Tesh36 |
| γH | Recovery rate of infected humans | 2 | Plamer et al.1 |
| THL | Transmission probability to humans from a larva bite | 0.75 | Same as TRLa |
| TRL | Transmission probability to rodents from a larva bite | 0.75 | Lerdthusnee et al.33 |
| TLR | Transmission probability to larva from rodent contact | 0.09 | Takahashi et al.34 |
| BR | Birth rate of rodents | 1 | Yoon et al.35 |
| BM | Birth rate of mites | 20 | Kim et al.3 |
| ε | Trans-ovarian transmission probability of mites | 0.9 | Shin et al.37 |
| G | Growth rate | 0.084 | Calculatedb |
aSame as model 1 parameters. bCalculated to satisfy the assumption of fixed population size (the calculation process is described in the text).
![]()
In this study, a constant population was presumed, and several parameters were calculated from other parameters with this assumption. For example, in Model 1, the birth rate and natural mortality rate of the mite group (BM, μM) were equal, and were the same as that in the rodent group (BR, μR). The units of these parameters were represented as the events per month. For Model 2, we fixed the mortality rate of adult mites (μA) and birth rate of mites (BM). The growth rate from larvae to adults (G), mortality rate of questing larvae (μLQ), and mortality rate of feeding larvae (μLF) were derived from the equations below:
where the symbols R, A, LQ, and LF indicate the number in the respective populations. These equations result from the assumption of a steady state equilibrium, where the input equals the output for each compartment of the model.
The main analysis in this study was the construction of mathematical dynamic models with different settings and sensitivity tests for each parameter. Using the constructed model, we examined the dynamics of each population with graphs, compared the results with observed data, and considered the reasons for discrepancies. A one-way sensitivity test was conducted with a tornado plot. Finally, we assessed single control measures and explored optimal strategies to prevent scrub typhus. In the sensitivity test and assessment of control measures, we focused on variation in the force of infection (λ) by changing the parameters. The force of infection is defined as the transmission rate per 1 human individual, as described below for Model 1:
Here, r1 × THL indicates an effective (causing transmission) contact rate between a person and a mite (or questing larva in Model 2). Therefore, multiplying this product by the number of infectious mites MI (or LQI, infectious questing larva in Model 2) yields the transmission rate per 1 person. Throughout this paper, however, λ represents the transmission rate per 100,000 person-months instead.
The assessment of control measures was conducted by exploring the effectiveness (0%–100%) and compliance level (0%–100%) of the measure to reduce the contract rate between mites and humans (r1) under different scenarios of relative population size. The reduction in contact rate by a control measure was expressed as r1* in the formula below:
[where, α = effectiveness of control measure, β = compliance level]
The open source software R v.3.1.1 (R Foundation, Vienna, Austria; http://www.r-project.org/) was used for all analyses. The R package “deSolve” was used to solve differential equations, and the package “rootSolve” was used for equilibrium analysis.
RESULTS
Fig. 4 shows simulation results by model. As the graphs here display, the force of infection at the equilibrium state under model 1 was 0.236 (per 100,000 person-months), and that under model 2 was 26.796 (per 100,000 person-months), much higher than the value for model 1.
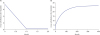
Fig. 5 depicts the one-way sensitivity test results for λ associated with a 10% increase or decrease in each parameter. In model 1, the population size of the rats and mites and the contact rate between them were the most influential parameters; as they increased, the value of λ also increased. On the other hand, λ decreased when the mite mortality rate decreased and the mite population size increased. Because the contact rate was automatically adjusted with each variation in population size, the relationship between the mite population size and λ was inversely proportional. TLR has a proportional relationship with λ and is less influential than the mite population size. Because both r1 and THL are proportional to λ by definition, their sensitivity is same. The mortality rate and population size of the rodents had the least effect on λ, and their associations with λ were inversely proportional. Overall, the rodent and mite populations and r2 were the most influential parameters for model 1. The sensitivity index for λ was 1.85, indicating that a change in the parameter would result in 1.85 times greater change in λ. On the other hand, in model 2, the trans-ovarian transmission probability (ε) was the most influential parameter for λ, followed by r1, THL, and TLR. The value of λ in model 2 was robust compared with the parameters of r2, TRL, mortality, and population size. In particular, the mite population and mortality did not have any impact on λ (sensitivity index was 0). Overall, trans-ovarian transmission was the most influential parameter under model 2. The sensitivity indices for λ, RI, and LQI were 69.73, 6.97, and 0.02, respectively. There was no effect of adult mite mortality and the total mite population size.
 | Fig. 5Tornado plot for model 1 (A) and model 2 (B); one-way sensitivity of each parameter for force of infection (per 100,000 person-months).
|
Table 3 shows the minimum compliance levels for the strategies to reduce r1 by 50%. The dash means that the required compliance level exceeded 1; therefore, it is considered impossible to reduce r1 by 50% using these strategies. Overall, as the population ratio (n) increased, more intense control strategies were required. The results of model 1 showed that when the population ratio was increased by 1.5 times, only control measures with 90% effectiveness could attain a 50% contact rate. On the other hand, the results for model 2 were more moderate, so an effectiveness of 80% could cover a reservoir population twice as large.
Table 3
Minimum compliance level of the differing effectiveness of contact-reducing strategies to reduce r1 by 50%, in the case of a growing population size of rodents (R) and mites (M), relative to humans (H)

![]()
DISCUSSION
The main purpose of this study was to construct mathematical models with parameters reflecting the transmission dynamics of scrub typhus in the context of Korea and to identify effective control strategies by application of these models. According to the simulation results for model 1, the infection prevalence in the rodent group at the equilibrium state was 70.28%, and that in the mite group was 0.32%. Previous studies1920 reporting a seroprevalence survey among rodents and mites have revealed that the prevalence in rodents ranges from 45% to 52%, and that in mites ranges from 1.37% to 1.77%. Therefore, according to the results for model 1, the prevalence in rodents was comparatively overestimated, whereas that in mites was underestimated in this study. Regarding the incidence of infection, the value calculated, from approximately 10,000 cases reported annually since 2013, was 1.67 per 100,000 person-months. In comparison, the model estimated λ to be 0.236, lower by 7 times. There are several reasons for discrepancies between the mathematical model and actual situation.18 The higher prevalence in rodents could be derived from the assumption that there are no scrub typhus-induced deaths in the rodent population or through underestimation of the natural death rate of rodents. In the case of mites, however, although the whole mite population was assumed to have a parasitic life, which means a higher chance of being infected from infectious rodents, the prevalence at equilibrium was lower than that in reality. This could be a result of the assumption that there was no trans-ovarian transmission. The underestimated λ is because of the lower proportion of infected mites.
In model 2, the prevalence in both rodents and larvae was over-estimated (by 99.63% and 49.62%, respectively). The possible causes for overestimating the rodent prevalence are the same as those discussed for model 1; however, the extent of the discrepancy was amplified by the overestimated prevalence in mites. This discrepancy could be due to the inclusion of trans-ovarian transmission in the model. Because the prevalence in rodents and mites in the model was higher than that in reality, the value of λ was also overestimated, by 16 times.
The purpose of sensitivity analyses in this paper was not only to understand which parameters had a greater influence on the outcome but also to suggest future studies needed to construct theoretical models with better parameters. In the sensitivity analysis of model 1, the rat and mite populations and r2 had the greatest effects on λ. On the other hand, in the sensitivity analysis of model 2, trans-ovarian transmission had a huge impact on the outcome values, especially on λ, but it showed limited or no effect on the population size or mortality rate of mites and rodents.
These discrepancies arise from several facts and model assumptions. First, model 2 did not respond to the change in the mortality rate because the population size was fixed. Therefore, population loss by mortality was complemented by other parameters. For example, if the mortality rate of the adult mites increased, parameter G, which is the growth rate from feeding larvae to adult mites, also increased, and if the mortality rate of the questing larvae increased, the spawning rate (birth rate) of the mites also increased automatically. This may be perceived as theoretical and unrealistic; however, it is generally accepted that nature's capacity for each species is fixed by the local fauna and flora. Therefore, the assumption is reasonable. Second, the different sensitivity of r2 on λ is a result of the assumption regarding a fixed population size because a change in r2 is compensated by an inverse change in the mortality of the questing larvae.
The strong sensitivity of trans-ovarian transmission (ε) could be a result of a high reference value (0.9). Because the sensitivity is calculated with variance in the reference value (−10%, +10%), the upper limit of ε was 0.99, which means nearly 100% transmission probability. A 100% rate of trans-ovarian transmission means that there is no way to increase the proportion of the group susceptible, and the only direction would be from susceptible to infectious; consequently, the prevalence in mites and λ increased drastically. However, the accuracy of ε is critical for the reliability of model 2.
The Korean Center for Disease Control and Prevention (KCDC) has implemented intensive control programs for endemic scrub typhus since 2006. The program mainly consists of providing oversleeves and repellent to local residents, along with education programs. In a modeling framework, these control strategies are translated as a reduction in r1. Finding from sensitivity analysis that avoiding mite bites is the only practical methodology, we needed to focus on the next question: how intensive should the control program be?
In models 1 and 2, as the population sizes of rodents and mites increase, λ also increases up to 5.24 times and 2 times higher, respectively, so a lower r1 value is required to maintain or reduce λ. Table 3 shows the value of the compliance level by the effectiveness of each of the simulation scenarios. A higher compliance level is required under model 1 than under model 2 for the same level of effectiveness given the same population scenarios. This indicates that the increase in λ by the increasing size of the rodent and mite populations is more rapid in model 1 than in model 2. The difference is caused by the simulation result of model 2. Because the infection prevalence in rodents is already too high in model 2, there is insufficient room to increase λ by increasing the population of mites. Therefore, it also can be inferred that the effect of population size variation was larger with lower rates of trans-ovarian transmission because it had a greater impact on the prevalence in rodents at equilibrium.
In Korea, the effectiveness of oversleeves and repellent was reported to be 50% in a case–control study.21 Therefore, this seems to be an insufficient method to reduce or even maintain the incidence as the population ratio increases. This might explain why the incidence of scrub typhus has been increasing, although the control program has been implemented with increased scale and intensity. Because it is generally accepted that the number of rodents and mites increases with climate changes such as warmer temperatures and higher precipitation,2223 the rate of infection is also increased by the growing numbers of rodents and mites, which cannot be neutralized with the current intensity of distancing strategies.24
From the one-health perspectives, the transdisciplinary and systemic approaches from human, animal, and environmental health,25 environmental factors such as host biodiversity and richness may have influences on the contact rate between humans and mites that have crucial effects on the human epidemics. Although there remains a lack of understanding regarding how these factors affect disease ecology,26 cooperation between sectors of the human and environmental sciences should be considered as another control strategy on a broader scale.27
Because scrub typhus has not been sufficiently addressed in previous research,28 limitations exist in this study concerning parameter uncertainties, such as the mortality rate of the rodent and mite populations and transmission probability per contact between animal hosts. We assumed that the mortality rates of rodents and mites were the same as their birth rates, as these assumptions have been used in other modeling studies with rodents29 and ticks.30 Additionally, these are ecologically reasonable because their population densities are modulated by other related species in the hierarchy of the food web, as described in a review study.31 In terms of transmission probability between hosts, we assumed that the transmission probability from infected mites to humans was the same as that from the mites to rodents. Although this assumption was unavoidable due to the absence of related experimental studies, other modeling studies incorporating multi-host systems, such as West Nile disease, have often used the assumption,14 and rodents have been used as disease models because pathogen dynamics in mice are similar to those in humans.32
In this paper, we concluded that reducing the contact rate between humans and mites is the only practical method to control the incidence of scrub typhus, as the control of mites or rodents has only limited effects. Particularly in model 2, it was clear that mite control has no protective effect because it is neutralized by the trans-ovarian transmission rate from adult mites. The modeling results also revealed that the current control program is not sufficient to reduce or even maintain the incidence rate among humans when the population sizes of mites and rodents are growing. Therefore, more intensive control programs should be considered to address the increasing vector population.
 XML Download