Journal List > J Korean Med Sci > v.33(11) > 1107951

Park, Lee, Song, Kang, Jung, Chung, Kim, Park, Park, Shin, Suh, and Kim: Diagnostic Performance of %[-2]proPSA and Prostate Health Index for Prostate Cancer: Prospective, Multi-institutional Study

Abstract

Background

We evaluated the clinical performance of [-2]proPSA (p2PSA) and its derivatives in predicting the presence and aggressiveness of prostate cancer (PCa) in Korean men.

Methods

A total of 246 men with total prostate-specific antigen (tPSA) ≥ 3.5 ng/mL who underwent their first prostate biopsy were included in this prospective, multicenter, observational study. Diagnostic accuracy of tPSA, free-to-total PSA ratio (%fPSA), p2PSA, %p2PSA, and the Beckman Coulter prostate health index (PHI) was assessed by receiver operating characteristic curve analyses and logistic regression analyses.

Results

Overall, PCa was detected in 125 (50.8%) subjects. In men with tPSA 3.5–10 ng/mL, the detection rate of PCa was 39.4% (61/155). In this group, PHI and %p2PSA were the most accurate predictors of PCa and significantly outperformed tPSA and %fPSA; area under the curve for tPSA, %fPSA, %p2PSA, and PHI was 0.56, 0.69, 0.74, and 0.76, respectively. PHI was also the strongest predictor of PCa with Gleason score ≥ 7.

Conclusion

This study demonstrates the superior clinical performance of %p2PSA and PHI in predicting the presence and aggressiveness of PCa in Korean men. The %p2PSA and PHI appear to improve detection of PCa and provide prognostic information.

Graphical Abstract

jkms-33-e94-abf001.jpg

INTRODUCTION

Prostate-specific antigen (PSA) is widely accepted as a tumor marker for the screening, diagnosis, monitoring, and risk prediction of prostate cancer (PCa).12 The introduction of PSA has resulted in a stage migration to clinically localized disease and a reduction in mortality. Although two recent randomized trials evaluating the effect of PSA-based screening on mortality reduction reported conflicting results, PSA screening appears to provide oncologic benefit.34 However, PSA has limitations as a screening biomarker. First, it is organ specific and not cancer specific.5 It also lacks sensitivity. In addition, PSA cannot distinguish between indolent and aggressive PCa.6 Consequently, PCa screening using PSA has raised concern about over-diagnosis and overtreatment that might cause more harm than good.7
Considerable efforts have been made to address and overcome the limitations of PSA.8 Recent investigations have focused on PSA isoform assays. In serum, 80%–95% of PSA exists as a complex with the small remaining proportion in an uncomplexed or free form. Free PSA (fPSA) comprises three isoforms: proPSA, benign PSA (BPSA), and intact PSA. There are also several truncated isoforms of proPSA, including [-2]proPSA, [-5]proPSA, and [-7]proPSA. The [-2]proPSA (p2PSA) isoform is the most cancer-specific, being preferentially concentrated in cancerous tissue on immunohistochemical staining and significantly increased in serum of men with PCa.910 The Beckman Coulter prostate health index (PHI) is a Food and Drug Administration (FDA)-approved test that combines total PSA (tPSA), fPSA, and p2PSA. PHI is calculated as [(p2PSA/fPSA) × √tPSA]. Several studies demonstrated that PHI significantly improves the predictive accuracy for detection of PCa1112 and is associated with PCa aggressiveness13 compared to either tPSA or free-to-total PSA ratio (%fPSA).
PCa is the fifth most frequently diagnosed cancer in males in Korea. The incidence of PCa in Korea has increased significantly, while the mortality rate has decreased steadily.14 Korean PCa patients have worse disease characteristics than their American counterparts.15 A significantly high proportion of PCa arising in Korean men exhibits poor differentiation.16 Therefore, the accurate diagnosis and risk stratification of PCa using biomarkers might be more critical in Korean men and validation of biomarkers superior to tPSA is urgent in this population.
This is the first study to evaluate the clinical utility of p2PSA and its derivatives in a cohort of Korean men undergoing their first prostate biopsy. We determined the diagnostic accuracy of %p2PSA [(p2PSA pg/mL)/(fPSA ng/mL × 1,000) × 100] and PHI in predicting PCa. Association of these serum indices with aggressive PCa was also assessed.

METHODS

Subjects and study design

The prospective, observational, multicenter (four institutions) study evaluated the diagnostic performance of p2PSA, %p2PSA, and PHI in comparison to the established markers of tPSA and %fPSA.
The study population included consecutive men aged 60–75 years with tPSA ≥ 3.5 ng/mL who underwent their first prostate biopsy for suspected PCa between June 2015 and August 2016. Exclusion criteria were prior history of PCa or other urogenital cancers, previous endoscopic surgery of the prostate, acute or chronic prostatitis within the preceding 3 months or untreated urinary tract infection, previous prostate biopsy, use of dutasteride or finasteride, and conditions like chronic kidney disease, hemophilia, or previous polytransfusion that could alter the p2PSA concentration.

Methods

Prior to prostate biopsy, blood was drawn to measure the prebiopsy tPSA, fPSA, and p2PSA levels. The blood samples were processed using the Access2 immunoassay kit (Beckman Coulter, Brea, CA, USA). The analysis of the serum samples was performed using calibrated Access tPSA and fPSA assays at a single laboratory. Prostate volume was determined using transrectal ultrasonography (TRUS). All patients underwent TRUS-guided prostate biopsies according to a standardized scheme not using magnetic resonance imaging (MRI); at least 12 biopsy cores were taken, with additional cores taken if the performing radiologist felt more cores were needed for adequate sampling. The specimens were processed and evaluated by a single experienced genitourinary pathologist, who was blinded to the test results. PCa was identified and graded according to the 2005 consensus conference of the International Society of Urological Pathology definitions.17

Study end points

The primary end point was the diagnostic accuracy of serum %p2PSA ([p2PSA pg/mL/(fPSA ng/mL × 1,000)] × 100) and Beckman Coulter PHI, and a comparison of their performance with the established biomarkers (tPSA and %fPSA) in determining the presence of PCa at prostate biopsy. The secondary end point was the predictive value of these serum indices for aggressive PCa with Gleason score (GS) ≥ 7.

Statistical analyses

The Kolmogorov-Smirnov test was used to assess the normal distribution of variables. Student's t-test and the Mann-Whitney U test were used for comparisons of normally and not normally distributed continuous variables, respectively. Bivariate and multivariate logistic regression models were fitted for the prediction of the presence of PCa and, in particular, PCa with GS ≥ 7 at biopsy. Goodness of fit of logistic regression models was checked using the Hosmer and Lemeshow test. Odds ratios with 95% confidence intervals were also calculated. Qualitative data were analyzed with the χ2 test.
Multivariate logistic regression models were complemented by predictive accuracy analyses. Predictive accuracy was quantified as the area under the receiver operating characteristic curve (AUC). To test the ability of %p2PSA and PHI in determining the presence of PCa at biopsy, these variables were added to the base multivariate model including age, prostate volume, tPSA, and %fPSA. The increase in predictive accuracy was quantified and AUCs were compared using the DeLong method.18 The correlation between variables was tested using the Spearman's rho coefficient analysis. Statistical analyses were performed with SPSS Statistics version 21.0 (SPSS, Chicago, IL, USA). Statistical significance was considered at P < 0.05.

Ethics statement

This study was approved by the Institutional Review Board (IRB) of each institution (approval number of Kangwon National University Hospital: KNUH 2015-04-004-001). The study protocol and the use of patient data for recruitment and follow-up were approved by the IRB of each institution before patient recruitment. All participants provide their written informed consent to participate in this study.

RESULTS

From June 2015 to August 2016, 280 men underwent their first prostate biopsy at the four institutions. Of these, 246 patients were included in this study. Among the overall subjects, 155 men belonged to the subgroup with tPSA 3.5–10 ng/mL.
The patient characteristics of the 246 men and values of the various PSA parameters are presented in Table 1. The overall positive biopsy rate was 50.8% (125/246). Among the 125 patients diagnosed with PCa, 40 (32.0%) had GS 6 disease, 68 (54.4%) had GS 7 disease, and 17 (13.6%) had GS 8–10 disease. Compared to the negative biopsy group, age, tPSA, %p2PSA, and PHI were significantly higher in patients with PCa. On the contrary, prostate volume and %fPSA were higher in patients without PCa.
Table 1

Demographic and clinical characteristics of all study subjects

jkms-33-e94-i001
Variables Total No cancer Cancer P value
No. of patients 246 121 125 -
Age, yr 69.6 (8.7) 67.8 (9.1) 71.4 (9.0) 0.001
Prostate volume, mL 39 (9–209) 46 (9–194) 34 (13–209) 0.001
tPSA, ng/mL 7.8 (3.5–387.2) 6.6 (3.5–31.0) 10.0 (3.6–387.2) < 0.001
%fPSA 0.14 (0.01–13.09) 0.18 (0.03–11.11) 0.12 (0.01–13.09) < 0.001
p2PSA, pg/mL 17.5 (0.7–349.6) 12.8 (2.6–69.7) 29.7 (0.7–349.6) < 0.001
%p2PSA 1.2 (0.1–11.9) 1.2 (0.1–4.1) 1.8 (0.1–11.9) < 0.001
PHI 39.9 (0.7–721.3) 31.5 (0.7–197.8) 60.5 (1.7–721.3) < 0.001
GS < 7 - - 40 (32.0) -
GS ≥ 7 - - 85 (68.0) -
Data are shown as mean (SD), median (range), or number (%).
SD = standard deviation, PSA = prostate-specific antigen, tPSA = total PSA, fPSA = free PSA, p2PSA = [-2]proPSA, PHI = prostate health index, GS = Gleason score.
Descriptive characteristics of the 155 subjects with tPSA 3.5–10 ng/mL are summarized in Table 2. The positive biopsy rate was 39.3% (61/155). In this subgroup with tPSA 3.5–10 ng/mL, mean age (69.6 vs. 67.3 years, P = 0.09) and median tPSA (6.2 vs. 5.9 ng/mL, P = 0.24) did not differ significantly between men with and those without PCa. In contrast, %p2PSA (1.7 vs. 1.2) and PHI (42.7 vs. 26.5) values were significantly higher (both P < 0.001) in men with PCa. Conversely, %fPSA (0.12 vs. 0.19, P < 0.001) and prostate volume (33 vs. 46 mL, P = 0.002) were statistically significantly lower in patients with PCa.
Table 2

Descriptive characteristics of subjects with tPSA 3.5–10 ng/mL

jkms-33-e94-i002
Variables Total No cancer Cancer P value
No. of patients 155 94 61 -
Age, yr 68.2 (8.5) 67.3 (8.9) 69.6 (7.5) 0.090
Prostate volume, mL 41 (12–122) 46 (12–122) 33 (13–102) 0.002
tPSA, ng/mL 6.1 (3.5–9.9) 5.9 (3.5–9.8) 6.2 (3.6–9.9) 0.240
%fPSA 0.16 (0.01–0.13) 0.19 (0.05–11.13) 0.12 (0.01–0.13) < 0.001
p2PSA, pg/mL 12.8 (0.7–64.7) 11.4 (2.6–58.1) 18.4 (0.7–64.7) 0.001
%p2PSA 1.3 (0.1–11.9) 1.2 (0.1–4.1) 1.7 (0.1–11.9) < 0.001
PHI 33.7 (0.7–235.2) 26.5 (0.7–128.4) 42.7 (1.7–235.2) < 0.001
GS < 7 - - 32 (52.5) -
GS ≥ 7 - - 29 (47.5) -
Data are shown as mean (SD), median (range), or number (%).
SD = standard deviation, PSA = prostate-specific antigen, tPSA = total PSA, fPSA = free PSA, p2PSA = [-2]proPSA, PHI = prostate health index, GS = Gleason score.
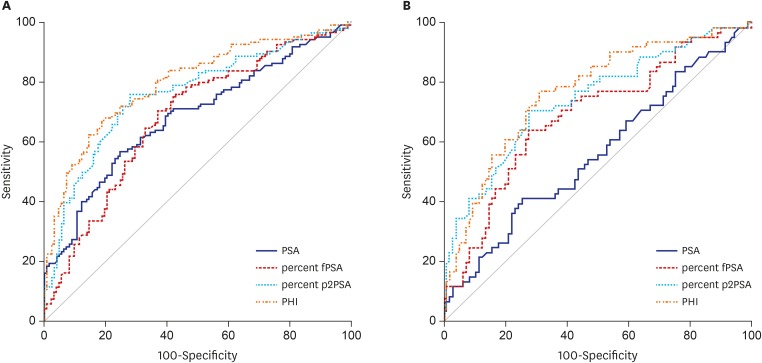
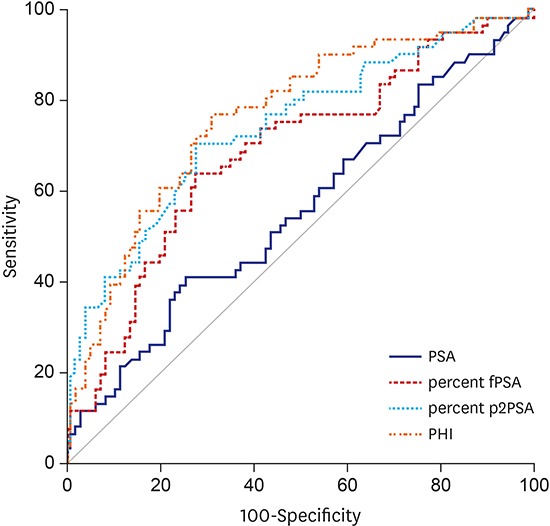
In the whole population of 246 men, the AUC for tPSA, %fPSA, %p2PSA, and PHI was 0.683, 0.681, 0.761, and 0.797, respectively. The AUC of the subgroup with tPSA 3.5–10 ng/mL was 0.556, 0.685, 0.740, and 0.763, respectively (Fig. 1). On univariate analysis, PHI was most accurate in predicting the results of the initial biopsy. PHI significantly outperformed tPSA and %fPSA, but not %p2PSA (P = 0.149) in the prediction of PCa. %p2PSA also significantly outperformed tPSA and %fPSA in the prediction of PCa (P < 0.001).
Fig. 1
ROC curves of the prediction accuracy of PSA, %fPSA, %p2PSA, and PHI for prostate cancer at initial biopsy. (A) ROC curves in all subjects. (B) ROC curves in subjects with tPSA 3.5–10 ng/mL.
ROC = receiver operating characteristic, PSA = prostate-specific antigen, fPSA = free PSA, p2PSA = [-2]proPSA, PHI = prostate health index, tPSA = total PSA.
jkms-33-e94-g001
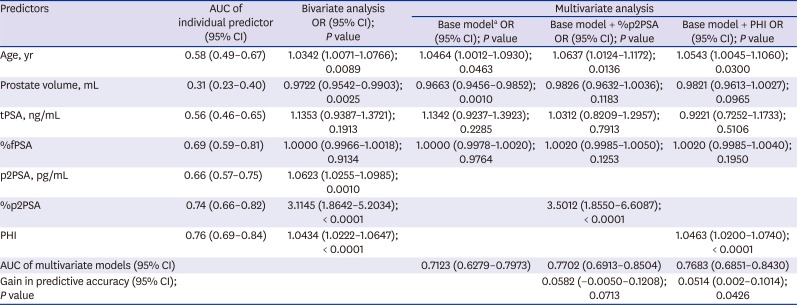
In the subgroup of patients with tPSA 3.5–10 ng/mL, multivariate logistic regression analyses also revealed that both PHI and %p2PSA were strong independent predictors, and that PHI significantly improved the predictive accuracy of a model including age, prostate volume, tPSA, and %fPSA (Table 3). To further assess the performance of the various parameters, we analyzed the data at a preset sensitivity level of 90%. At this sensitivity, PHI had the highest specificity of 68.3% while the specificity of tPSA was 21.2%. At a PHI cut-off of 22.9, 33 (21.3%) of 155 patients could have avoided undergoing a biopsy, while two patients with PCa would have been missed. However, no patient with GS 7 or greater would have been missed.
Table 3

Logistic regression analyses predicting the probability of having prostate cancer at biopsy in patients with tPSA 3.5–10 ng/mL (n = 155)

jkms-33-e94-i003
Predictors AUC of individual predictor (95% CI) Bivariate analysis OR (95% CI); P value Multivariate analysis
Base modela OR (95% CI); P value Base model + %p2PSA OR (95% CI); P value Base model + PHI OR (95% CI); P value
Age, yr 0.58 (0.49–0.67) 1.0342 (1.0071–1.0766); 0.0089 1.0464 (1.0012–1.0930); 0.0463 1.0637 (1.0124–1.1172); 0.0136 1.0543 (1.0045–1.1060); 0.0300
Prostate volume, mL 0.31 (0.23–0.40) 0.9722 (0.9542–0.9903); 0.0025 0.9663 (0.9456–0.9852); 0.0010 0.9826 (0.9632–1.0036); 0.1183 0.9821 (0.9613–1.0027); 0.0965
tPSA, ng/mL 0.56 (0.46–0.65) 1.1353 (0.9387–1.3721); 0.1913 1.1342 (0.9237–1.3923); 0.2285 1.0312 (0.8209–1.2957); 0.7913 0.9221 (0.7252–1.1733); 0.5106
%fPSA 0.69 (0.59–0.81) 1.0000 (0.9966–1.0018); 0.9134 1.0000 (0.9978–1.0020); 0.9764 1.0020 (0.9985–1.0050); 0.1253 1.0020 (0.9985–1.0040); 0.1950
p2PSA, pg/mL 0.66 (0.57–0.75) 1.0623 (1.0255–1.0985); 0.0010
%p2PSA 0.74 (0.66–0.82) 3.1145 (1.8642–5.2034); < 0.0001 3.5012 (1.8550–6.6087); < 0.0001
PHI 0.76 (0.69–0.84) 1.0434 (1.0222–1.0647); < 0.0001 1.0463 (1.0200–1.0740); < 0.0001
AUC of multivariate models (95% CI) 0.7123 (0.6279–0.7973) 0.7702 (0.6913–0.8504) 0.7683 (0.6851–0.8430)
Gain in predictive accuracy (95% CI); P value 0.0582 (−0.0050–0.1208); 0.0713 0.0514 (0.002–0.1014); 0.0426
AUC = area under the receiver operating characteristic curve, PSA = prostate-specific antigen, tPSA = total PSA, fPSA = free PSA, p2PSA = [-2]proPSA, PHI = prostate health index, OR = odds ratio, CI = confidence interval.
aBase model includes age, prostate volume, tPSA, and %fPSA.
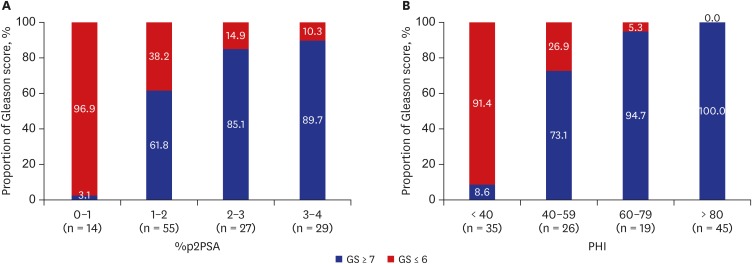
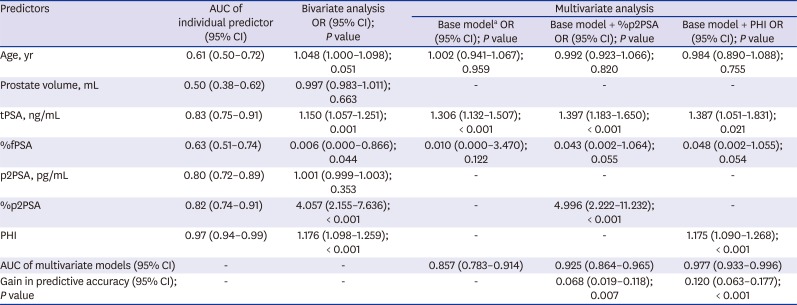
Table 4 presents the comparison data between GS 6 disease and more aggressive disease. The PCa patients were divided into two groups according to the tumor aggressiveness (biopsy GS). PHI was also the strongest predictor of PCa with GS ≥ 7 (Table 5). The proportion of aggressive cancer increased with the PHI score (Fig. 2). At the highest PHI interval (PHI > 80), there was 98.4% of chance of positive biopsy with GS ≥ 7. The Spearman's rho coefficient analysis demonstrated a strong positive correlation between GS and PHI level (rho 0.757, P < 0.001).
Table 4

Comparison between GS 6 disease and more aggressive disease in PCa patients

jkms-33-e94-i004
Variables GS 6 GS ≥ 7 P value
No. of patients 40 85 -
Age, yr 69.3 (9.2) 72.9 (7.9) 0.047
Prostate volume, mL 34 (13–102) 33 (15–209) 0.981
tPSA, ng/mL 5.8 (3.6–52.8) 14.3 (3.9–387.2) < 0.001
%fPSA 0.14 (0.01–13.09) 0.12 (0.03–0.47) 0.018
p2PSA, pg/mL 14.1 (0.7–141.1) 37.6 (7.1–349.6) < 0.001
%p2PSA 1.2 (0.1–3.8) 2.2 (0.6–11.9) < 0.001
PHI 33.6 (1.7–77.8) 85.6 (35.6–721.3) < 0.001
Data are shown as mean (SD), median (range), or number (%).
SD = standard deviation, PSA = prostate-specific antigen, tPSA = total PSA, fPSA = free PSA, p2PSA = [-2]proPSA, PHI = prostate health index, GS = Gleason score, PCa = prostate cancer.
Table 5

Logistic regression analyses predicting Gleason score ≥ 7 in cancer patients

jkms-33-e94-i005
Predictors AUC of individual predictor (95% CI) Bivariate analysis OR (95% CI); P value Multivariate analysis
Base modela OR (95% CI); P value Base model + %p2PSA OR (95% CI); P value Base model + PHI OR (95% CI); P value
Age, yr 0.61 (0.50–0.72) 1.048 (1.000–1.098); 0.051 1.002 (0.941–1.067); 0.959 0.992 (0.923–1.066); 0.820 0.984 (0.890–1.088); 0.755
Prostate volume, mL 0.50 (0.38–0.62) 0.997 (0.983–1.011); 0.663 - - -
tPSA, ng/mL 0.83 (0.75–0.91) 1.150 (1.057–1.251); 0.001 1.306 (1.132–1.507); < 0.001 1.397 (1.183–1.650); < 0.001 1.387 (1.051–1.831); 0.021
%fPSA 0.63 (0.51–0.74) 0.006 (0.000–0.866); 0.044 0.010 (0.000–3.470); 0.122 0.043 (0.002–1.064); 0.055 0.048 (0.002–1.055); 0.054
p2PSA, pg/mL 0.80 (0.72–0.89) 1.001 (0.999–1.003); 0.353 - - -
%p2PSA 0.82 (0.74–0.91) 4.057 (2.155–7.636); < 0.001 - 4.996 (2.222–11.232); < 0.001 -
PHI 0.97 (0.94–0.99) 1.176 (1.098–1.259); < 0.001 - - 1.175 (1.090–1.268); < 0.001
AUC of multivariate models (95% CI) - - 0.857 (0.783–0.914) 0.925 (0.864–0.965) 0.977 (0.933–0.996)
Gain in predictive accuracy (95% CI); P value - - - 0.068 (0.019–0.118); 0.007 0.120 (0.063–0.177); < 0.001
AUC = area under the receiver operating characteristic curve, PSA = prostate-specific antigen, tPSA = total PSA, fPSA = free PSA, p2PSA = [-2]proPSA, PHI = prostate health index, OR = odds ratio, CI = confidence interval.
aBase model includes age, tPSA, and %fPSA.
Fig. 2
Proportion of prostate cancer with GS ≥ 7 in relation to %p2PSA intervals (A) and PHI intervals (B).
GS = Gleason score, PSA = prostate-specific antigen, p2PSA = [-2]proPSA, PHI = prostate health index.
jkms-33-e94-g002

DISCUSSION

The ideal biomarkers for PCa need to be able to distinguish PCa from benign prostatic conditions and to differentiate between aggressive and indolent cancers.1 The inherent limitations of PSA have spurred intensive efforts for alternative PCa biomarkers that are noninvasive and have improved accuracy and risk stratification properties.26 A growing armamentarium of novel PCa biomarkers has emerged in recent years. FDA-approved biomarkers include PHI, which is intended to distinguish cancerous and benign prostatic conditions in men ≥ 50 years of age with normal digital rectal examination results and tPSA levels of 4–10 ng/mL. This test determines the need of biopsy, thereby reducing unnecessary biopsies.12
PHI is reportedly capable of detecting PCa with a greater specificity than tPSA and %fPSA, with more power in discriminating high grade (GS ≥ 7) cancer from low grade cancer.111213 A meta-analysis has demonstrated that %p2PSA and PHI are consistently more accurate than standard reference tests in predicting prostate biopsy outcome and can guide decision making about prostate biopsy.19
Our prospective study reinforces the evidence that both %p2PSA and PHI are significantly more accurate in predicting the presence of PCa at initial biopsy compared to tPSA and %fPSA. The inclusion of %p2PSA or PHI in a multivariate logistic regression model resulted in significant increase of its predictive accuracy. At a biopsy threshold of PHI > 22.9, 21.3% (33/155) of biopsies would have been avoided with no potentially aggressive cancer (GS ≥ 7) missed in patients with a tPSA range of 3.5–10 ng/mL. In other studies with similar results, at a cut-off for biopsy of PHI levels 25–32, 15.5%–45.2% of their cohorts could have avoided unnecessary biopsy; however, they would have missed 1.1%–3.8% of GS ≥ 7 PCa.132021 Although there is no consensus on the PHI cut-off for biopsy, lowering the cut-off level would be more prudent to avoid missing high grade PCa.
In the current study, PHI was also associated with more aggressive PCa and could increase the accuracy of the base model for predicting GS ≥ 7 PCa. The proportion of aggressive cancer increased with the PHI score. Similarly, a European prospective study showed that PHI was able to improve the prediction of GS ≥ 7 PCa,22 although the results did not achieve statistical significance due to the relatively small number of patients. Given these results, it appears that PHI could serve as a guide for men who wish to be treated only if there is aggressive PCa.
There are racial differences in incidence and aggressiveness of PCa, which are explained by lifestyle and genetic differences. The incidence of PCa in Caucasian men is 5–10 times higher than that in many regions of Asia.23 Koreans also have a lower incidence of PCa than Caucasians. However, Korean PCa patients have worse disease characteristics than their American counterparts.1516 Because most of the data regarding %p2PSA and PHI have been based primarily on Western populations, there has been a need to validate these biomarkers in Korean populations. To our best knowledge, our study is the first to examine the performance of %p2PSA and PHI in a cohort of Korean men undergoing their first prostate biopsy. Several previous investigations evaluated %p2PSA and PHI in Asian populations.242526 Similar to our findings, they showed superior performance of PHI to tPSA in Asian men.
Early evidence suggests that %p2PSA and PHI may also be able to predict prostate cancer aggressiveness on final histology after radical prostatectomy, as well as on prostate biopsies.827 We plan to continue studies evaluating the association of %p2PSA and PHI with the pathologic characteristics of prostatectomy specimens in our cohort.
%p2PSA and PHI may have a role in monitoring men under active surveillance. In this regard, two recent studies are notable. The studies evaluated the predictive role of p2PSA and PHI in identifying those men with PCa who were enrolled in an active surveillance program who might be at an increased risk of disease progression.2829 Further studies are needed to define how %p2PSA or PHI could be used to select men that would derive the greatest benefit from an active surveillance program and how these markers could be incorporated into the follow-up schedule of patients.
Despite its strengths in study design, this study is limited by the relatively small sample size. However, this would not influence the main results. The present results will be helpful in that they provide the first evidence about the clinical utility of %p2PSA and PHI in Korean men. Further studies are required to determine the best cut-off values of %p2PSA or PHI according to the patient characteristics. Another limitation of this study is that we did not use multiparametric MRI. MRI could help detect and guide biopsies of anterior tumors that may escape standard TRUS-guided prostate biopsy.
In conclusion, our findings demonstrate %p2PSA and PHI outperform tPSA and %fPSA in predicting the presence and aggressiveness of PCa in Korean men. Although further studies are required, %p2PSA and PHI appear to improve detection of PCa and provide prognostic information.

Notes

Funding: This study was supported by 2015 Kangwon National University Hospital Grant.

Disclosure: The authors have no potential conflicts of interest to disclose.

Author Contributions: Conceptualization: Kim JH. Data curation: Kim JH, Park H, Lee SW. Funding acquisition: Kim JH. Investigation: Park H, Lee SW, Song G, Kang TW, Jung JH, Chung HC, Kim SJ, Park CH, Park JY, Shin TY, Suh IB. Writing - original draft: Park H, Lee SW. Writing - review & editing: Kim JH.

References

1. Hatakeyama S, Yoneyama T, Tobisawa Y, Ohyama C. Recent progress and perspectives on prostate cancer biomarkers. Int J Clin Oncol. 2017; 22(2):214–221. PMID: 27730440.
crossref
2. Saini S. PSA and beyond: alternative prostate cancer biomarkers. Cell Oncol (Dordr). 2016; 39(2):97–106. PMID: 26790878.
crossref
3. Schröder FH, Hugosson J, Roobol MJ, Tammela TL, Ciatto S, Nelen V, et al. Screening and prostate-cancer mortality in a randomized European study. N Engl J Med. 2009; 360(13):1320–1328. PMID: 19297566.
crossref
4. Andriole GL, Crawford ED, Grubb RL 3rd, Buys SS, Chia D, Church TR, et al. Prostate cancer screening in the randomized Prostate, Lung, Colorectal, and Ovarian Cancer Screening Trial: mortality results after 13 years of follow-up. J Natl Cancer Inst. 2012; 104(2):125–132. PMID: 22228146.
5. Catalona WJ, Partin AW, Slawin KM, Brawer MK, Flanigan RC, Patel A, et al. Use of the percentage of free prostate-specific antigen to enhance differentiation of prostate cancer from benign prostatic disease: a prospective multicenter clinical trial. JAMA. 1998; 279(19):1542–1547. PMID: 9605898.
crossref
6. McGrath S, Christidis D, Perera M, Hong SK, Manning T, Vela I, et al. Prostate cancer biomarkers: are we hitting the mark? Prostate Int. 2016; 4(4):130–135. PMID: 27995111.
crossref
7. Moyer VA. U.S. Preventive Services Task Force. Screening for prostate cancer: U.S. Preventive Services Task Force recommendation statement. Ann Intern Med. 2012; 157(2):120–134. PMID: 22801674.
crossref
8. Hori S, Blanchet JS, McLoughlin J. From prostate-specific antigen (PSA) to precursor PSA (proPSA) isoforms: a review of the emerging role of proPSAs in the detection and management of early prostate cancer. BJU Int. 2013; 112(6):717–728. PMID: 22759214.
crossref
9. Chan TY, Mikolajczyk SD, Lecksell K, Shue MJ, Rittenhouse HG, Partin AW, et al. Immunohistochemical staining of prostate cancer with monoclonal antibodies to the precursor of prostate-specific antigen. Urology. 2003; 62(1):177–181. PMID: 12837462.
crossref
10. Mikolajczyk SD, Catalona WJ, Evans CL, Linton HJ, Millar LS, Marker KM, et al. Proenzyme forms of prostate-specific antigen in serum improve the detection of prostate cancer. Clin Chem. 2004; 50(6):1017–1025. PMID: 15054080.
crossref
11. Sartori DA, Chan DW. Biomarkers in prostate cancer: what’s new? Curr Opin Oncol. 2014; 26(3):259–264. PMID: 24626128.
12. Lazzeri M, Abrate A, Lughezzani G, Gadda GM, Freschi M, Mistretta F, et al. Relationship of chronic histologic prostatic inflammation in biopsy specimens with serum isoform [-2]proPSA (p2PSA), %p2PSA, and prostate health index in men with a total prostate-specific antigen of 4–10 ng/ml and normal digital rectal examination. Urology. 2014; 83(3):606–612. PMID: 24315305.
crossref
13. Lazzeri M, Haese A, Abrate A, de la Taille A, Redorta JP, McNicholas T, et al. Clinical performance of serum prostate-specific antigen isoform [-2]proPSA (p2PSA) and its derivatives, %p2PSA and the prostate health index (PHI), in men with a family history of prostate cancer: results from a multicentre European study, the PROMEtheuS project. BJU Int. 2013; 112(3):313–321. PMID: 23826841.
14. Han HH, Park JW, Na JC, Chung BH, Kim CS, Ko WJ. Epidemiology of prostate cancer in South Korea. Prostate Int. 2015; 3(3):99–102. PMID: 26473152.
crossref
15. Kang DI, Chung JI, Ha HK, Min K, Yoon J, Kim W, et al. Korean prostate cancer patients have worse disease characteristics than their American counterparts. Asian Pac J Cancer Prev. 2013; 14(11):6913–6917. PMID: 24377625.
crossref
16. Song C, Kang T, Lee MS, Ro JY, Lee SE, Lee E, et al. Clinico-pathological characteristics of prostate cancer in Korean men and nomograms for the prediction of the pathological stage of the clinically localized prostate cancer: a multi-institutional update. Korean J Urol. 2007; 48(2):125–130.
crossref
17. Epstein JI, Allsbrook WC Jr, Amin MB, Egevad LL. ISUP Grading Committee. The 2005 International Society of Urological Pathology (ISUP) Consensus Conference on Gleason grading of prostatic carcinoma. Am J Surg Pathol. 2005; 29(9):1228–1242. PMID: 16096414.
crossref
18. DeLong ER, DeLong DM, Clarke-Pearson DL. Comparing the areas under two or more correlated receiver operating characteristic curves: a nonparametric approach. Biometrics. 1988; 44(3):837–845. PMID: 3203132.
crossref
19. Wang W, Wang M, Wang L, Adams TS, Tian Y, Xu J. Diagnostic ability of %p2PSA and prostate health index for aggressive prostate cancer: a meta-analysis. Sci Rep. 2014; 4(1):5012. PMID: 24852453.
crossref
20. Lazzeri M, Haese A, de la Taille A, Palou Redorta J, McNicholas T, Lughezzani G, et al. Serum isoform [-2]proPSA derivatives significantly improve prediction of prostate cancer at initial biopsy in a total PSA range of 2-10 ng/ml: a multicentric European study. Eur Urol. 2013; 63(6):986–994. PMID: 23375961.
crossref
21. Filella X, Foj L, Augé JM, Molina R, Alcover J. Clinical utility of %p2PSA and prostate health index in the detection of prostate cancer. Clin Chem Lab Med. 2014; 52(9):1347–1355. PMID: 24695041.
crossref
22. Guazzoni G, Nava L, Lazzeri M, Scattoni V, Lughezzani G, Maccagnano C, et al. Prostate-specific antigen (PSA) isoform p2PSA significantly improves the prediction of prostate cancer at initial extended prostate biopsies in patients with total PSA between 2.0 and 10 ng/ml: results of a prospective study in a clinical setting. Eur Urol. 2011; 60(2):214–222. PMID: 21482022.
crossref
23. Wong M, Yip C, Li H, Tan T, Kanesvaran R, Chowbay B, et al. Assessment of the American Joint Committee on Cancer 7th edition staging for localised prostate cancer in Asia treated with external beam radiotherapy. Ann Acad Med Singapore. 2014; 43(10):484–491. PMID: 25434618.
24. Ng CF, Chiu PK, Lam NY, Lam HC, Lee KW, Hou SS. The Prostate Health Index in predicting initial prostate biopsy outcomes in Asian men with prostate-specific antigen levels of 4–10 ng/mL. Int Urol Nephrol. 2014; 46(4):711–717. PMID: 24136184.
25. Tan LG, Tan YK, Tai BC, Tan KM, Gauhar V, Tiong HY, et al. Prospective validation of %p2PSA and the Prostate Health Index, in prostate cancer detection in initial prostate biopsies of Asian men, with total PSA 4–10 ng ml-1. Asian J Androl. 2017; 19(3):286–290. PMID: 26908062.
crossref
26. Ito K, Miyakubo M, Sekine Y, Koike H, Matsui H, Shibata Y, et al. Diagnostic significance of [-2]pro-PSA and prostate dimension-adjusted PSA-related indices in men with total PSA in the 2.0–10.0 ng/mL range. World J Urol. 2013; 31(2):305–311. PMID: 22903772.
27. Fossati N, Buffi NM, Haese A, Stephan C, Larcher A, McNicholas T, et al. Preoperative prostate-specific antigen isoform p2PSA and its derivatives, %p2PSA and prostate health index, predict pathologic outcomes in patients undergoing radical prostatectomy for prostate cancer: results from a multicentric European prospective study. Eur Urol. 2015; 68(1):132–138. PMID: 25139197.
crossref
28. Makarov DV, Isharwal S, Sokoll LJ, Landis P, Marlow C, Epstein JI, et al. Pro-prostate-specific antigen measurements in serum and tissue are associated with treatment necessity among men enrolled in expectant management for prostate cancer. Clin Cancer Res. 2009; 15(23):7316–7321. PMID: 19934305.
crossref
29. Isharwal S, Makarov DV, Sokoll LJ, Landis P, Marlow C, Epstein JI, et al. ProPSA and diagnostic biopsy tissue DNA content combination improves accuracy to predict need for prostate cancer treatment among men enrolled in an active surveillance program. Urology. 2011; 77(3):763.e1–763.e6. PMID: 21216447.
crossref
TOOLS
ORCID iDs

Hongzoo Park
https://orcid.org/0000-0002-4953-5079

Sang Wook Lee
https://orcid.org/0000-0003-0497-5916

Geehyun Song
https://orcid.org/0000-0001-7486-4520

Tae Wook Kang
https://orcid.org/0000-0003-4236-0664

Jae Hung Jung
https://orcid.org/0000-0002-4990-7098

Hyun Chul Chung
https://orcid.org/0000-0002-3450-7817

Sung Jin Kim
https://orcid.org/0000-0002-5609-0485

Chang-Hoo Park
https://orcid.org/0000-0002-5680-3254

Jong Yeon Park
https://orcid.org/0000-0002-7085-9940

Tae Young Shin
https://orcid.org/0000-0002-3910-9252

In Bum Suh
https://orcid.org/0000-0001-7012-0305

Jeong Hyun Kim
https://orcid.org/0000-0002-8942-0188

Similar articles