

 PDF
PDF Citation
 Print
Print


INTRODUCTION
The autonomic nervous system (ANS) is known to play a critical role in the arrhythmias, especially atrial fibrillation (AF).12 The intrinsic cardiac nervous system (ICNS) may be an independent trigger of atrial arrhythmias3 and it consists of axons and autonomic ganglia clustered at ganglionated plexi (GPs) embedded in epicardial fat.4 It is well documented that GPs play a substantial role in initiating and maintaining AF in both animals and humans.235 Previous studies have suggested the GP as targets for treating AF; however, the effectiveness of this approach has varied based on the location of the GP and the extent of its ablation.67 Additionally, the long-term efficacy of GP ablation remains controversial.8910
Neuromodulation is a potentially effective way at reducing afferent, efferent, or local circuit neuronal activity and might also affect remodeling in intrathoracic extracardiac ganglia.11 Yuan et al.4 and Pauza et al.12 performed elegant neuroanatomical analysis showing the neuronal distribution in the myocardium and several physiologic studies have suggested the existence of systematic interconnections among GPs.13141516 Despite previous efforts to characterize intrinsic cardiac autonomic nervous system (ICANS) neuroanatomy, the pattern of atrial innervation by GPs, and interconnections among GPs remain poorly understood. Also, it is not yet clear which is the best way to modulate the ICANS based on its anatomical distribution. The current study provides a neuroanatomical map of a GP using a retrograde neuronal tracer, and then describes its atrial innervations in the heart of a living animal. Cholera toxin subunit B (CTB) is a retrograde neuronal tracer which binds to GM1 gangliosides of neurons, and has been used in neuroanatomical mapping studies.17 Recently, Alexa Fluor conjugated CTB has been reported to provide a more sensitive neuronal tracing.17
The present study was conducted to investigate how GPs anatomically innervated the cardiac atria, and whether neuroanatomical interconnections existed among various GPs in a canine heart.
METHODS
Animal preparation
All experiments were performed using adult mongrel dogs (n = 10; all males; weights, 15–25 kg). Adult mongrel dogs were purchased from International Center Laboratory Animal (Seoul, Korea) and were housed in the Seoul National University Hospital Biomedical Research Institute. We only included male mongrel dogs in this study, and use of male mongrel dogs is usually accepted study design in cardiac model. Further study will be performed to find sex differences in GP distribution and innervation. General anesthesia was induced with Zoletil® (intravenously injected, 5 mg/kg; combination of tiletamine/zolazepam, Virbac S/A, Carros, France) and maintained with isoflurane gas (1%–2% in oxygen). The animals were intubated and mechanically ventilated. Core body temperature was maintained at 36.5°C–37°C. A limb lead electrocardiogram was continuously monitored during surgical procedure. Under sterile surgical conditions, a left or right lateral thoracotomy was performed at the fourth intercostal space, followed by a pericardiotomy. After surgical procedure, meloxicam was intravenously injected (0.2 mg/kg) for 3 days to relief pain and discomfort in animals. Dogs were monitored daily. At the end of the study, animals were fully anesthetized with Zoletil® and isoflurane gas and euthanized by induced ventricular fibrillation using direct contact of 9 V battery to ventricle.
Retrograde neuronal tracer
CTB was used as a retrograde neuronal tracer that is taken up by nerve terminals and retrogradely transported along the axon at a rate 6.3 mm/hr.18 It specifically binds to GM 1 gangliosides which are concentrated on the synaptic membranes of nerve cells.17 Fig. 1A shows how CTB identifies the origins of neurons innervating a particular muscle, schematically. CTB is not transferred trans-synaptically; and thus remains in vesicles and appears as granules in the neuron cell body.17 CTB conjugated with Alexa Fluor (CTB-AF) is a highly sensitive and reliable retrograde tracer used for identifying the origins of neurons innervating a particular muscle, or examining multiple pathways within nerve tissues. In this study, CTB-AF 488 (green), and CTB-AF 555 or 594 (red) (Invitrogen, Carlsbad, CA, USA) were directly injected into the atrium or GPs. We then examined the retrogradely-transported CTB-AF in GP for the purpose of evaluating which GPs innervated to a particular atrial area or connected with other GPs. The tracer was dissolved in phosphate buffered saline (0.1% concentration [500 µg dissolved in 500 µL buffer]).17
 | Fig. 1The mechanism of CTB-AF as a retrograde neuronal tracer and anatomic locations of injection sites. (A) When the fluorescence conjugated CTB was injected into a particular muscle, CTB retrogradely transferred along nerve axons and identified the origin of innervating neuronal cells in ganglia. (B) The location of injection sites of Experiment 1. (C) The location of injection sites of Experiment 2.CTB-AF = cholera toxin subunit B conjugated with Alexa Fluor, LAA = left atrial appendage, LAFW = left atrial free wall, LOM = ligament of Marshall, SLGP = superior left ganglionated plexi, SVC-Ao FP = superior vena cava-aorta fat pad, RAA = right atrial appendage, RAFW = right atrial free wall, ARGP = anterior right ganglionated plexi, IRGP = inferior right ganglionated plexi.
*CTB-AF injection sites.
|
Injection of CTB-AF
The tracers were injected after surgically exposing the cardiac atria. The following two sets of experiments were performed. In Experiment 1, CTB-AF was injected into the targeted atrial area to determine the patterns of atrial innervation by GPs (Fig. 1B). In Experiment 2, CTB-AF was injected into epicardial fat pads containing the ganglia for the purpose of characterizing the neuroanatomical interconnections among different GPs (Fig. 1C). In both experiments, CTB-AF was carefully injected to avoid leakage of the solution into the surrounding tissues. Table 1 describes the injection sites and the types of fluorescence used in each experimental animal. After injection, the chest wall was closed.
Table 1
Summary of the injection sites, the type of injected CTB-AF, and results of quantitative analysis in each experimental animal
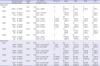


CTB-AF = cholera toxin subunit B conjugated with Alexa Fluor, GP = ganglionated plexi, SVC-Ao FP = superior vena cava-aorta fat pad, ARGP = anterior right ganglionated plexi, IRGP = inferior right ganglionated plexi, SLGP = superior left ganglionated plexi, LOM = ligament of Marshall, RAFW = right atrial free wall, RAA = right atrial appendage, LAFW = left atrial free wall, LAA = left atrial appendage.
![]()
Experiment 1: atrial innervation by GPs
Experiment 1 was performed using six mongrel dogs. CTB-AF was injected into four atrial sites as illustrated in Fig. 1B. These included right atrial (RA) sites (RA free wall [RAFW] and the RA appendage [RAA]) and left atrial (LA) sites (LA free wall [LAFW] and the LA appendage [LAA]). A total of 500 µL of the tracers was injected into each area (20 injections of 25 µL per injection) using a Hamilton Neuros syringe (Hamilton, Reno, NV, USA). One dog was labeled with a single fluorescent tracer injected into the RAFW. Five of the 6 dogs were double-labeled, of which CTB-AF was injected into the RAFW and RAA of three dogs, and into the LAFW and LAA of two dogs. Each site was labeled with a different color of fluorescence.
Experiment 2: neuroanatomical interconnections among GPs
Experiment 2 was conducted using four dogs. Two dogs underwent a right lateral thoracotomy, and CTB-AF was injected into right-sided fat pads, which included the anterior right GP (ARGP) and inferior right GP (IRGP) (green and red-fluorescence, respectively). The ARGP located between the caudal end of the sinoatrial node and the right superior pulmonary vein-atrial junction. The IRGP located at the junction of the inferior vena cava and both atria. The other two dogs underwent a left lateral thoracotomy, and tracers were injected into left-sided fat pads, which included the superior left GP (SLGP) and ligament of Marshall (LOM) (green and red-fluorescence, respectively). The SLGP located adjacent to the left superior pulmonary vein-atrial junction between the LAA and left pulmonary vein. The LOM located between both left pulmonary veins and LAA. Fig. 1C shows the anatomic location of each GP. A total of 250 µL of CTB-AF was injected in each GP using a 1 mL insulin syringe (BD Ultra-FineTM II; Becton Dickinson, Franklin Lakes, NJ, USA).
Histologic evaluation
Previous studies had reported that maximum numbers of CTB-labeled ganglion cells were observed 72 hours after injection, and there was no striking change in the distribution of the labeled neurons until 1 week.18 In this study, the tissues used for analyses were harvested either 4 or 7 days after injection. The following 5 GP were harvested from the animals and analyzed: superior vena cava-aorta fat pad (SVC-Ao FP), ARGP, IRGP, SLGP and LOM. Tissues were fixed in 4% formalin for one hour, then stored in 70% alcohol and embedded into paraffin blocks. The paraffinized tissue blocks were horizontally divided into 6 segments, and 4 μm thick sections were obtained from each segment. The first sections as representative sections of each segment were examined with a laser-scanning confocal microscope (LSM 710; Zeiss, Oberkochen, Germany) to detect CTB-labeled neuronal cells.
Then, immunohistochemical staining was done using anti-tyrosine hydroxylase (TH) (Accurate Chemical, Westbury, NY, USA) and anti-choline acetyltransferase (ChAT) (Chemicon, Billerica, MA, USA) for characterizing of CTB-labeled neuronal cells. TH is a marker for adrenergic neurons, and ChAT is a marker for cholinergic neurons.
Data analysis
Data were analyzed using both qualitative and semi-quantitative methods. First, we observed the presence of CTB-AF in a particular GP defined as a fat pad which included the ganglia. For the semi-quantitative analysis, ganglia that included CTB-labeled neurons were manually counted in the representative section of each segment by two independent investigators. If there was a disagreement between the two investigators, the case was assessed by a third independent investigator to reach a consensus. We used ZEN 2009 Light Edition software (Zeiss) for analyzing confocal microscopic images and Image J (version 1.47; National Institutes of Health, Bethesda, MA, USA) for cell count. The percentage of labeled ganglia was estimated as the number of CTB-labeled ganglia, compared to the total number of ganglia in a particular GP.
All numerical data are expressed as the mean ± standard deviation (SD). SPSS version 19.0 (IBM Corp., Armonk, NY, USA) was used for all statistical analyses. For semi-quantitative analyses, the number of CTB-labeled ganglia and the total number of ganglia are presented as their pooled numbers in each atrial or GP injection site across all experimental animals.
Ethics statement
The protocol for this study was approved by the Institutional Animal Care and Use Committee of the Seoul National University Hospital; and animal were maintained in the facility accredited AALAC International (#001169) in accordance with Guide for the Care and Use of Laboratory Animals 8th edition, NRC (2010).
RESULTS
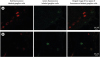
No animals experienced an adverse effect after the tracer injection. All injection sites were observed using a confocal microscope. Intense fluorescence was seen at the intended injection sites, and there was no evidence of CTB-AF leakage into adjacent tissues (Fig. 2). Detailed data including the injection sites, the types CTB-AF injected at each site, the total ganglia count in each GP, and numbers of CTB-labeled ganglia in each experimental animal are presented in Table 1. The number of ganglia in each GP varied from 0 to 50, and ARGPs were the largest GP within the 5 GPs surveyed (Fig. 3). In 9 of 10 experimental animals, right-sided GPs such as the ARGP and IRGP included more ganglia compared to left-sided GPs.
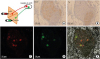
 | Fig. 2CTB-AF injection sites observed via a confocal microscope. (A) Intense green-fluorescence is observed in the LAA injection site (× 100). (B) Highly focused red-fluorescence is observed in the LAFW injection site (× 100). Scale bar, 100 µm. (C) A representative ganglia located in the ARGP injected with CTB-AF 488 (× 200). Intense green-fluorescence is distributed within the cell bodies of neuronal cells and transversely sectioned axon bundles. (D) Ganglia located in the IRGP injected with CTB-AF 555 shows intense red-fluorescence in neuronal cell bodies and axons (× 200). Scale bar, 50 µm.CTB-AF = cholera toxin subunit B conjugated with Alexa Fluor, LAA = left atrial appendage, LAFW = left atrial free wall, ARGP = anterior right ganglionated plexi, IRGP = inferior right ganglionated plexi.
|
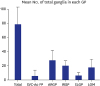 | Fig. 3The mean number of total ganglia in each ganglionated plexi.GP = ganglionated plexi, SVC-Ao FP = superior vena cava-aorta fat pad, ARGP = anterior right ganglionated plexi, IRGP = inferior right ganglionated plexi, SLGP = superior left ganglionated plexi, LOM = ligament of Marshall.
|
GP patterns of atrial innervation (Experiment 1)
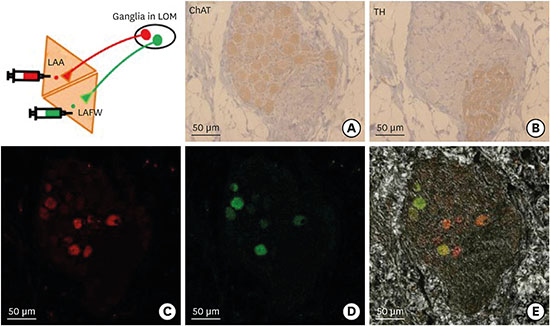
A total of 5 GPs were inspected in each animal to identify the presence of fluorescence. CTB-labeling was found in the neuronal cell bodies located in ganglia. Most neuronal cells in ganglia showed a cholinergic nature, as indicated by the presence of ChAT-positive cells (Fig. 4). The distribution of CTB-labeled ganglia varied in each animal (Table 1). Fig. 4 shows the representative microscopic images of immunohistochemical staining and CTB-labeled neuronal cells in the ganglia of LOM. ChAT staining shows the cholinergic nature of neuronal cells in ganglia and TH staining shows the adrenergic axon bundles within the same ganglia (Fig. 4A and B). CTB-labeled cells with red-fluorescence from the LAA and with green-fluorescence from the LAFW identified in a ganglia of LOM (Fig. 4C and D). The fluorescence is mainly observed in the cell bodies of cholinergic neurons in ganglia which were also ChAT-positive.
 | Fig. 4Comparison of immunohistochemical staining and CTB-labeled cells in the ganglia of LOM by confocal microscope. (A) ChAT staining showing the parasympathetic nature of most neuronal cells in a ganglia. (B) TH staining showing the sympathetic axon bundles within the same ganglia. (C) CTB with red-fluorescence labeled neuronal cells in a ganglia. (D) CTB with green-fluorescence labeled neuronal cells in a ganglia. (E) Merged image of two types of fluorescence (all, × 200). Scale bar, 50 µm. In this animal, each green and red fluorescent spot indicates neurons innervating the LAA and LAFW, respectively. Note that some neuronal cells are labeled with two fluorescent colors (green and red) within the same cell body.CTB-AF = cholera toxin subunit B conjugated with Alexa Fluor, LOM = ligament of Marshall, ChAT = choline acetyltransferase, TH = tyrosine hydroxylase, LAA = left atrial appendage, LAFW = left atrial free wall.
|
An analysis for the presence of neuronal tracer in a particular GP showed that GPs in either right or left-side were innervating to both the same and opposite side of atrium. In other words, GPs projected their axons widely to both the nearby and distant atrial areas. The RA tended to be dominantly innervated by right-sided GPs such as the ARGP and IRGP. CTB-AF injected into the RAFW was mainly observed in the ARGP and IRGP (4 of 4 dogs and 2 of 4 dogs, respectively). In one animal, CTB-AF from the RAFW was also observed in the SLGP, LOM, and SVC-Ao FP. CTB-AF from the RAA was detected in the ARGP and IRGP (3 of 3 dogs and 2 of 3 dogs, respectively). Additionally, the SVC-Ao FP (2 of 3 dogs) and SLGP (1 of 3 dogs) projected innervating neurons to the RAA. The LA tended to be innervated by right-sided GPs (2 of 2 dogs). Left-sided GPs innervated both the LAFW (LOM in 1 of 2 dogs, and the SLGP in 2 of 2 dogs) and LAA (LOM, in 1 of 2 dogs and the SLGP in 1 of 2 dogs), although these innervations occurred less frequently compared to right-sided GP innervations.
Our semi-quantitative analysis provided more detailed information concerning the predominance of right-sided GPs in atrial innervation. Based on the absolute numbers of CTB-positive ganglia, right-sided GPs were numerically predominant in atrial innervation (Fig. 5). The axons of right-sided GPs were widely projected to both RA and LA. However, a small number of neurons directly originating from left-sided GPs also innervated RA areas. While right-sided GPs showed dominance in atrial innervation, some atrial areas were also innervated by GPs located in the opposite side of an injected atrial area. Based on the proportion of CTB-labeled ganglia in each GP, all 4 atrial areas appeared to be primarily innervated by GPs located the same side of the injection sites; showing that atrial innervation by GPs had a tendency for laterality.
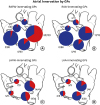 | Fig. 5Semi-quantitative analysis of a CTB-labeled ganglia in each GP by CTB-AF injected atrial area (Experiment 1). Semi-quantitative analysis was performed using the pooled number of all experimental animals labeled at each atrial site. Asterisks indicate CTB-AF injection sites. Pie charts show the location of each GP and the proportion of CTB-labeled ganglia. The darker gray colored section of the pie chart indicates the proportion of CTB-labeled ganglia. Numbers next to the pie charts indicate the value obtained for the ratio: CTB-labeled ganglia/total ganglia in each GP. (A) RAFW injection (n = 4), (B) RAA injection (n = 3), (C) LAFW injection (n = 2), (D) LAA injection (n = 2).CTB-AF = cholera toxin subunit B conjugated with Alexa Fluor, GP = ganglionated plexi, RAFW = right atrial free wall, RAA = right atrial appendage, LAFW = left atrial free wall, LAA = left atrial appendage.
*Atrial injection site.
|
In 5 of 6 animals, two distinct atrial areas on the same side were injected with different types of fluorescence conjugated tracers. In those double-labeled animals, both dual-fluorescence labeled ganglia and dual-fluorescence labeled neuron cell bodies were observed (Fig. 4E).
Neuroanatomical interconnections among GPs (Experiment 2)
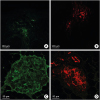
We examined 5 GPs in 4 experimental animals, and the numbers of CTB-labeled ganglia and total ganglia found in those animals are presented in Table 1. As shown in Fig. 6, CTB-labeled neuronal cells were widely distributed throughout 4 GPs, regardless of where the CTB-AF injected GP was located. ARGP projected the largest numbers of innervating neurons to the IRGP, SLGP, and LOM (Fig. 7). Fig. 7 shows neuronal cells that were labeled with CTB-AF transported from different GPs. In Experiment 2, all animals were double-labeled with two different types of CTB-AF (488 and 555) that were injected into the ARGP and IRGP or SLGP and LOM, respectively. Similar to Experiment 1, dual-fluorescence labeled ganglia and neuronal cells were also found (Fig. 7B).
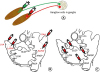
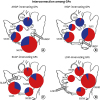 | Fig. 6Semi-quantitative analysis of the distribution of CTB-labeled ganglia by CTB-AF injected GP (Experiment 2). The numbers of CTB-labeled ganglia and total ganglia were pooled according to injection site. In the pie charts, the proportion of CTB-labeled ganglia is presented as a darker gray colored segment. Numbers indicate the value obtained for the ratio: labeled ganglia/total ganglia. Retrograde tracers which were injected into a particular GP became widely distributed into 4 other GPs. (A) ARGP injection (n = 2), (B) IRGP injection (n = 2), (C) SLGP injection (n = 2), (D) LOM injection (n = 2).CTB-AF = cholera toxin subunit B conjugated Alexa Fluor, ARGP = anterior right ganglionated plexi, IRGP = inferior right GP, SLGP = superior left GP, LOM = ligament of Marshall.
|
 | Fig. 7Representative confocal images of neuronal cells labeled by fluorescence from different GPs (Experiment 2). (A) This ganglia is located in the ARGP and was directly injected with green-fluorescence conjugated CTB. In some green-fluorescence labeled cells, red-fluorescence labeled cells are also observed. Red-fluorescence was injected into the IRGP. (B) The ganglia in the SVC-Ao FP shows green and red fluorescent neuronal cells, and also dually labeled cells. This GP was not directly injected with any type of CTB-AF. In this animal, green-fluorescence was injected into the SLGP and red-fluorescence was injected into the LOM (all, × 200). Scale bar, 50 µm.GP = ganglionated plexi, ARGP = anterior right ganglionated plexi, CTB = cholera toxin subunit B, IRGP = inferior right ganglionated plexi, SVC-Ao FP = superior vena cava-aorta fat pad, SLGP = superior left ganglionated plexi, LOM = ligament of Marshall.
|
DISCUSSION
In this study, we successfully demonstrated the pattern of atrial innervation by GPs in canine hearts by using CTB-AF as a retrograde neuronal tracer. We found that GPs projected their axons widely and innervated to both the same and opposite sides of atrium. This result shows atrial innervation by GPs are complex. Additionally, right-sided GPs, especially the ARGP, dominated in innervation to both RA and LA. We also found considerable degrees of neuroanatomical interconnection among different GPs. To our knowledge, this is the first study demonstrating neuroanatomical innervation of GPs into the atrium and interconnection among GPs using a retrograde neuronal tracer.
This study characterizes the patterns of atrial innervation by GPs, and demonstrates the presence of extensive interconnections among GPs. Using straightforward method, our study helps understanding of the GP innervation in the atria. We used a non-trans-synaptically transported retrograde tracer to visualize single neuronal connections among GPs, and between GPs and atrial areas.
A tendency for laterality in the atrial innervations shown by GPs has been suggested in previous studies. Pauza et al.12 observed GP innervation by tracing gradually disappeared axons as they entered the myocardium. While there were some overlapping areas, each GP occupied a restricted locality in the atrium. In keeping with this morphological evidence, the physiologic results suggest the regional innervation of GPs. Although a GP in either the right or left-side can contribute to AF initiation from bilateral pulmonary veins and atria, the decrease in AF inducibility was more profound on the same side PVs and the atrium of an ablated GP.6 However, regional atrial innervation by a GP cannot explain the results in several previous physiologic studies, including a study that focused on anatomic evidence for laterality or regionality.12131415 That study had a limitation in that the investigators experienced difficulty in dissecting and tracing all axon pathways to the atrial myocardium, due to abundant fat tissue which surrounded the GP.12 Our study avoided these technical issues by using a neuronal tracer, and thus identified more precise patterns of atrial innervation by GPs, including wide innervating neurons.
Although we observed a tendency for regional atrial innervation by GPs, the dominance of right-sided GPs and the presence of complex networks among GPs were also observed. These findings may explain the results reported in previous physiologic studies.1314 Our results suggest that right-sided GPs, especially the ARGP, have an important role in atrial innervation by GPs, as well as innervations among GPs. The ARGP had the largest number of GPs among 5 GP areas examined (Fig. 3). In 9 of 10 experimental animals, right-sided GPs such as the ARGP or IRGP showed a numerical predominance compared to left-sided GPs, and this finding agreed with that in previous studies.412 Yuan et al.4 reported that RA and inferior vena cava-inferior atrial GP contained > 50% of total GPs. Other morphological analysis of the ICNS in canines by a whole-mount study showed that the largest GPs, involving up to 93% of all cardiac ganglia, were distributed on the atria and the canine RA contained more ganglia than LA (70% and 23%, respectively).12 Based on this right-sided GP dominance, plus the fact that right-sided GPs projected their axons to both RA and LA, we also observed that a small number of GPs extend their axons to the opposite side; for instance, a left-sided GPs might extend axons to RA areas. Consequently, a GP is capable of forming a complex neural network on the atrium.
Recent studies have provided physiologic evidence for the existence of systematic interconnections among GPs. Hou et al.1314 conducted selective and sequential GP ablations of the ARGP, IRGP, and SLGP in canine model and found that right-sided GPs such as the ARGP and IRGP served as the “integration center” of the ICNS. After ablating those GPs, the effects of stimulation of other GPs were attenuated or eliminated. Considering the numerical predominance of the ARGP and IRGP, the broad projections of ganglionic cell axons from a GP might explain the partial attenuation of effects resulting from ablation of a particular single GP. While previous investigators interpreted the role of a GP based on its effects on the sinoatrial (SA) and atrioventricular nodes; in AF, GP innervation may have a critical role in controlling the autonomic tone in both atria.
The existence of neuroanatomical interconnections among GPs was demonstrated. While several anatomy studies have suggested the presence of inter-GP neurons, the actual innervation pattern among GPs remained speculative.412 Only one study conducted in a cat model has attempted to determine the interconnections between SA ganglia and other GPs by injecting fast blue as a retrograde tracer at a single GP (SA node).19 Our study traced 4 main GPs, instead of a single main GP. The CTB-AF injected into a particular GP diffusely labeled GPs that were located on both the same and opposite sides of the injected GP. This result provided neuroanatomical evidence for interconnectivity among GPs, and was compatible with the results shown in previous morphological and physiologic studies.
Our current study also found direct evidence that a single GP or ganglion cell can send axonal projections to the multiple areas of atria. Dual-fluorescence labeled ganglion cells were observed in both Experiments 1 and 2; therefore, we can assume that the axon terminal branches of a single neuron stretched to at least two distinct areas. Similar findings for dichotomizing axons that innervate more than one anatomically distinct area have been reported for other organs.20
This current study has certain limitations that should be mentioned. First, the whole GP was not thoroughly examined, and data obtained from representative sections were included. Additionally, if a ganglia included at least one CTB-labeled neuronal cell, it was regarded and counted as a CTB-positive ganglia. Therefore, the quantitative analysis of GP innervation was not accurate. However, these limitations did not affect our findings concerning the complex nature of GP innervation.
The CTB-AF which we used as a retrograde neuronal tracer had minor anterograde tracer property.17 In Experiment 1, we injected CTB-AF to the atrial myocardium, so that the anterograde property could not have an effect on the results, but the interconnected innervation among GPs could be overestimated. And we did not perform the negative control experiments for distinguishing the autofluorescence from truly labeled neuron. However, the intensity of fluorescence was obviously different from the truly labeled cells and we could distinguishing the autofluorescence from the retrogradely labeled ganglions in our study specimens.
Compared with results obtained by immune-staining, all CTB-labeled ganglion cells displayed a cholinergic nature. The presence of CTB-labeled cells in the cholinergic neurons was assumed to reflect the dominance of cholinergic components in the ICNS. In a previous study, 83% of ICNS ganglion cells were cholinergic, whereas only 4% were adrenergic.21 In addition, we did not perform further immunohistochemical characterizing of intraganglionic interneurons in this study. We assumed complex interconnection among GPs via interconnecting neurons, however, we did not conduct additional anatomical and functional exploration of these neurons.
We evaluated the atrial innervation by GPs in canines, however, the distribution of cardiac ANS in canine is quite different from the human's.122223 In canine heart, cardiac ganglia are highly clustered in 3 or 4 major fat pads and RA area is more prominent than LA area. Compared with canines, cardiac ganglia are less clustered and also there was no RA dominancy in distribution of cardiac ganglia in human. The difference between canine models and human should be carefully considered as we interpret and apply this result on human. Finally, we only included normal dogs in our study, and described the neuroanatomical data without having performed electrophysiological studies.
In conclusion, this study directly demonstrated that GPs project axons widely to both the same and opposite sides of atria. Although atrial innervation by GPs showed a tendency of laterality, right-sided GPs, especially the ARGP, played a dominant role in atrial innervation. Furthermore, there were numerous neuroanatomical interconnections among GPs. These findings about neuronal innervation and interconnections of GPs could offer useful information for understanding ICNS neuroanatomy and establishing a strategy for using ablation therapy in the arrhythmias.
 XML Download