

 PDF
PDF Citation
 Print
Print


INTRODUCTION
Machine learning has increasingly become the leading method of analyzing medical images.1 Fundus images have been the target of many studies, due to its relative simplicity and its significance in detecting leading causes of vision-threatening diseases, such as diabetic retinopathy (DR), age-related macular degeneration (AMD), and glaucoma. As these radiation-free images can be easily recorded by a fundus camera even without pupil dilation, they are suitable as a screening tool for preventing blindness. Deep learning algorithms have recently been reported to have high accuracy in detecting DR and other eye diseases.23456 However, for effective deep learning, medical images that have accurate and detailed descriptions of their findings, diagnoses, and clinical significance are required, just as for the education and training of medical doctors. As archived medical images in healthcare provider's database generally have official readings and patient's diagnoses from clinicians, early investigators expected to easily use these information for machine learning-based research. However, these images with their clinic-based information fell short of their expectations. Archived clinic-based medical data are not robustly validated; most of them are read only once by a doctor, and a unified framework for readings barely exists. Also, the scope of readings varies depending on the purpose of the studies and clinically uninteresting findings are ignored which hampers the usage of data for training deep learning algorithms. Previous databases used for deep learning have focused on one specific diagnosis. As the interest in automated identification using deep learning has increased, there has been an increased demand on proper medical image data, and researchers have pointed out the lack of sufficient fundus image databases available for training deep learning models for efficient, high performing algorithms.7 Recently, Gulshan et al.2 suggested two prerequisites for high performing algorithms of deep learning; one is a large development set having large number of abnormal cases, and the other is a test/validation set having multiple readings per image.
To develop high performing algorithms for assessing retinal fundus images, a well-designed reading system for retinal fundus images is necessary to collect a large, comprehensive, reliable database which contains individual findings, diagnoses, and the clinical significance of the findings and diagnoses observed in the images from multiple graders. This retinal fundus image reading system can meet various purposes from ophthalmology clinics, primary care clinics, reading center for health screening center, and also for research-based image analysis. In the present study, we introduce our novel reading tool for retinal fundus images which produce multi-dimensional categorical information regarding image quality, presence of abnormality, findings, diagnoses, clinical significance and location information, which can provide a framework for belief network analysis as well as deep learning-based research. In addition, we report an overview of our database of multi-rated retinal fundus images using our reading tool by licensed ophthalmologists and the degree of agreement between the raters.
METHODS
Reading system architecture
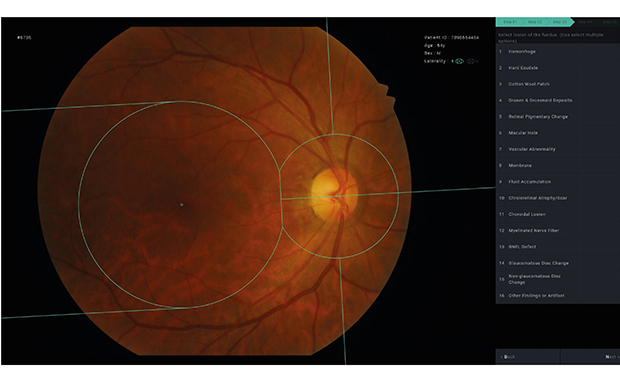
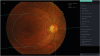
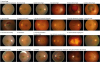
We designed a multi-step reading system for retinal fundus images which can help annotate detailed multi-dimensional structured information to images more easily, including location information of each variable, while saving task time for raters. For the present study, the system was designed to read conventional macula-centered retinal fundus images. All images that did not include the optic disc or the macula were excluded from the study. The system consists of 5 steps: step 1 for image quality, step 2 for presence of any abnormality, step 3 for annotating and localizing abnormal findings, step 4 for annotating diagnoses based on the observed findings, and step 5 for assessing the necessity of referral to ophthalmologists. The system provides skip logic to the next case in step 1 and 2 when the following steps are not applicable or necessary (Fig. 1). We set all steps as binary or multiple choices without any subjective questions. The clinical findings and diagnoses selected for step 3 and 4 respectively were based on the frequency of the findings/diagnosis observed in primary care clinics and health screening centers rather than in clinics of eye care professionals. Detailed information regarding variables that can be selected in each of the 5 steps is provided in Table 1. In step 1, raters were asked to grade image quality as ‘ungradable’ if there was severe limitation of visibility of the fundus interfering with proper decision of the presence of certain features or diagnosis. In cases with partial interference, the rater could select the cause among ‘media opacity’ or ‘small pupil/defocusing.’ For step 3, the system was designed to additionally collect the location information regarding each annotated finding by 8 geometric regions in the macula-centered image; macular, temporal, superior temporal, inferior temporal, superior nasal, inferior nasal, superior disc, and inferior disc areas (Fig. 2). The system automatically provides these geometric regions in step 3 on each image, based on automated detection of the fovea and optic disc center by the use of deep learning-based algorithm. Raters can adjust the center of fovea and optic disc when the automatically detected location is not appropriate, and then the system immediately adjusts the geometric regions in accordance with the rater's adjustment. Example photographs of each finding were provided to the graders as in Fig. 3. Raters could also adjust the brightness or contrast individually and magnify the images to facilitate visualization of certain regions of the images. Keyboard shortcuts for selecting variables and proceeding to the next step were also provided to facilitate raters' convenience. The system was designed to automatically assign each fundus photograph to 3 different raters, while not assigning the same fundus photograph to the same reader again, thus, acquiring 3 readings from 3 different raters for each fundus photograph, based on the most cost-effective number of readings per image in a previous study.2
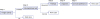
Table 1
Variables in the 5 steps of the retinal image reading system
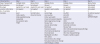
Fig. 2
Geometric regions used in the novel retinal image reading system. We defined the 8 geometric regions using the fovea and disc center of macular centered-retinal fundus images. With automated detection of the fovea and disc center, the DFD is measured. A circle with a radius of two-thirds of the DFD is centered at the fovea, while a circle with the radius of two-fifths of the DFD is centered at the optic disc center. The two points where the two circles intersected were connected in a straight line. The optic disc-centered circle is divided by the straight line that passes through fovea and optic disc center. Two lines that are both tangent to the fovea-centered circle and parallel to the line through fovea and optic disc center are drawn to the temporal side. The straight line going through the optic disc center and perpendicular to the line through fovea and optic disc center is drawn superior and inferior to the optic-disc-centered circle. The areas divided by these lines are defined as designated in the image; 1) macular area, 2) superior optic disc area, 3) inferior optic disc area, 4) temporal area, 5) superotemporal area, 6) inferotemporal area, 7) superonasal area, and 8) inferonasal.
DFD = disc-center-to-fovea distance.
Seoul National University Bundang Hospital Retina Image Archive
We used the Seoul National University Bundang Hospital Retina Image Archive, which contains 239,702 studies of retinal color fundus images from 112,699 subjects obtained at the health screening center and ophthalmology outpatient clinic between June 1st, 2003 and June 30th, 2016. Images were acquired using various fundus cameras (Canon CF60Uvi, Kowa VX-10, Kowa VX-10a, GENESIS D portable, Canon CR6-45NM, Kowa nonmyd7). The individual subjects were de-identified by randomly assigned 10-digit numbers, and all other information such as patient name, birthdate, study date, etc., was removed from the images before entering the reading system, except the gender and the age at the study date, which were provided to the rater for consideration in the reading of the image. The reading system did not provide any other clinical information (e.g., presence of hypertension and diabetes mellitus, ophthalmologic history, other ophthalmologic measurements such as visual acuity or intraocular pressure, status of the contralateral eye) to the raters.
Recruiting raters and operating the reading system
All readings were performed from June 1st, 2017 to December 13th, 2017. We recruited 55 raters who were all licensed ophthalmologists in Korea. Among these, 16 readers were certified retina specialists, 9 were certified glaucoma specialists, and 3 were certified cornea specialists. We operated 4 separate systems which had an identical architecture as stated above; group 1 for preliminary and tutorial tasks for all recruited readers, group 2 for general ophthalmologists (including cornea specialists), group 3 for certified retina specialists, and group 4 for certified glaucoma specialists. When first recruited, the rater was asked to read at least 500 images in group 1, which was consisted of normal fundus images based on the formal reading given at the time of the examination at the health screening center. Then, the readers were assigned to groups 2, 3, and 4 according to their subspecialties.
Statistical analysis or agreement assessment
Images were excluded from statistical analysis if even one reader graded it as unreadable in step 1. We investigated the number of images categorized to have each of the features in steps 2 to 5, and also the degree of agreement between raters in each of them. The degree of agreement was assessed by evaluating the proportion of images in which at least two raters agreed, and in which all three raters agreed, among the images in which any rater rated as positive for a certain feature. Then, we assessed the complete agreement rate (all three raters agreed) in variables in step 3, 4, and 5 only when the images had complete agreement for abnormality in step 2. As a subgroup analysis, we assessed the complete agreement rate separately in groups 2, 3, and 4 to compare the degree of agreements among general ophthalmologists, retinal specialists, and glaucoma specialists. In the analyses, the images with only “artifact” in step 3, only “artifact” in step 4, and no referable abnormality in step 5 despite abnormal in step 2 were regarded as normal.
Ethics statement
This study was approved by the Institutional Review Board (IRB) of Seoul National Bundang Hospital (IRB No. B-1508-312-107) and adhered to the tenets of the Declaration of Helsinki. Informed consent was waived by the institutional review board due to the retrospective nature of the present study and proper de-identification of the data used in the study.
RESULTS
A total of 234,242 readings of 79,458 images were collected during the study period of about 6 months. Each rater read 278 to 15,499 images (mean = 4,280.0, median = 2,965) throughout all groups. Raters in group 2 read 23 to 14,998 images (mean = 4,632.2, median = 4,024), while those in group 3 read 10 to 8,078 images (mean = 2,743.4, median = 2,000), and those in group 4 read 218 to 4,077 images (mean = 2,467.4, median = 2,302).
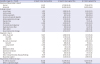
Of 79,458 images, all 3 readings were completed in 77,007 images. Of these, images were excluded if even one reader graded it as unreadable in step 1. Thus, a total of 71,560 images, from 38,339 studies of 35,105 patients of readable image quality were included in the analyses, which is presented in Table 2. The number of images rated as abnormal in step 2 by at least one rater was 34,364, and out of these, at least two raters agreed in 24,024 images (69.9%) and all three raters agreed in 16,009 images (46.6%). In step 3, 378 (myelinated nerve fiber) to 13,781 (drusen/drusenoid deposit) images were rated to have a certain finding in them. Agreement of at least two raters on a certain finding ranged from 26.7% (retinal pigmentary change) to 65.2% (hemorrhage), and complete agreement of all three raters ranged from 5.7% (retinal pigmentary change) to 43.3% (hemorrhage). In step 4, the number of images with a certain diagnosis ranged from 185 (central retinal vein occlusion) to 10,611 (AMD), and agreement of at least two raters on a certain diagnosis ranged from 35.6% (other retinal/choroidal diseases/findings) to 65.6% (DR), and complete agreement of all three raters ranged from 11.0% (other retinal/choroidal diseases/findings) to 40.0% (DR). The number of images requiring referral to an ophthalmologist rated by at least one rater in step 5 was 17,798, agreement of at least two raters on requirement of referral was 27.8%, and complete agreement of all three raters was 5.1%.
Table 2
An overview of the reading results using the retinal fundus image rating system
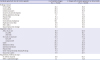
When analyses were confined to the 16,009 images that had complete agreement for abnormality in step 2 (Table 3), complete agreement rate improved in all variables, especially for the following variables; drusen/drusenoid deposit, retinal nerve fiber layer defects (RNFLDs), and glaucomatous disc change in step 3, glaucoma suspect in step 4, and requirement of referral in step 5.
Table 3
Complete agreement rate (all 3 raters agreed) in images with complete agreement on abnormality
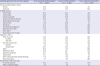
In the analysis of complete agreement rate in specific groups (Table 4), retinal specialists showed superior agreement regarding retinal findings and diagnoses than those observed among general ophthalmologists and glaucoma specialists. Complete agreement for any AMD was 31.4% in group 3 versus 16.6% in group 2 and 22.8% in group 4, and complete agreement for any DR was 55.6% in group 3 versus 31.6% in group 2 and 45.6% in group 4. Similarly, glaucoma specialists' agreement in glaucoma-related findings (RNFLD and glaucomatous disc change) and diagnosis (glaucoma suspect) was remarkable, compared to general ophthalmologists and retinal specialists. Complete agreement for glaucoma suspect was 38.5% in group 4 versus 5.5% in group 2 and 9.4% in group 3.
Table 4
Complete agreement rate (all 3 raters agreed) according to rater's subspecialty group
DISCUSSION
We developed a novel comprehensive reading system for retinal fundus images, and using this system, we collected a valuable dataset of over 200,000 multi-dimensional readings for about 80,000 images with three readings per image by licensed ophthalmologists in Korea in a relatively short period of only about 6 months. This on-going database currently contains 34,364 images with at least one rating as abnormal, and 16,009 images with complete agreement as abnormal, and in each abnormal image, detailed findings are annotated along with location information of the findings, supposed diagnoses, and clinical significance of the diagnoses. This dataset can be used in various ways according to the purpose of the researcher. The present database can provide a sufficient number of images even with complete agreement for each finding or diagnosis. Further on, more images can be included if the level of agreement is decreased to 1 or 2, depending on the purpose. We can extract specific images with certain findings in step 3 with a certain location irrespective of the diagnosis in step 4 or can extract images with a specific diagnosis in step 4 with various findings in step 3. Using the information acquired from step 4 from our reading system, we can develop an algorithm diagnosing or classifying a specific retinal disease, such as DR as in previous studies,235 Further on, this database can be used to train or test algorithms that can detect the presence of specific findings in a certain diagnosis (i.e., hemorrhage, cotton wool patch, hard exudate, membrane, etc. in DR). Therefore, the data from our reading system can support both strategies in developing an algorithm for assessing retinal fundus images; one, assessing findings from the images and then drawing the diagnoses from probabilistic relationship between findings, diagnoses, and their clinical significance, and two, directly determining the diagnoses from images. We are currently undergoing development of deep learning algorithms utilizing both of these approaches with our database created from this study. Most developers have focused on developing models with a diagnosis at the image level. However, in clinical practice, there is a greater diversity; one fundus image may have several simultaneous diseases, and a certain disease may present with diverse findings. There have been approaches to develop devices that use deep-learning-based finding detectors.4 Also, Quellec et al.8 have proposed that deep learning models trained to detect a certain diagnosis can also be excellent lesion detectors without retraining them, by creating heatmaps showing which pixels play a role in the image-level predictions. Developing image databases that can be used in both of these two approaches is increasingly becoming important, and this novel reading system supports the creation of such a database with multi-level annotation in a relatively short time.
One problem in the application of deep-learning-based diagnosis devices in real clinical practice is that there may be a diverse range of findings that could be found in the retina. Previous binary classification models for DR have reported high accuracy in automated DR detection, however, the limitation of clinical application of this device in the real world has been acknowledged,9 and development of deep learning algorithms categorizing more than one retinal disease have been reported.5710 Another challenge, as Choi et al.7 reported, is that as the number of disease categories are increased, the performance of deep learning models are diminished. The dilemma is that the real world is far more diverse and systems with training on only a few disease categories are more likely to face unlearned disease. Thus, systems with multi-categorical classification should be developed, but the performance decreases with more classification. A practical meeting point in between needs to be found. Our system was developed to categorize findings and diagnoses most commonly encountered in subjects visiting primary care clinics and health screening centers. We excluded some vision-threatening and/or rare findings/diagnoses such as retinal detachment and retinal artery occlusion, which may cause acute and severe deterioration of vision with rather easily recognizable symptoms, which would bring the patient directly to the clinic rather than be discovered in a screening setting for normal subjects. The simplicity of the findings and diagnoses in our system may improve the efficiency of developing a proper algorithm for screening purposes. In addition, simplifying the findings (e.g., various types of hemorrhage [preretinal, retinal, subretinal, disc hemorrhage, etc.] were simplified to one category of hemorrhage in the present system) may also help reducing the number of categories.
Unlike other public datasets including EyePACS and Messidor1112 or other in-house medical data25 that yield only single annotation per image, our system can produce data that are multi-annotated per image. In other words, in a single image, precise and thorough clinical information can be recorded which in turn can also be used for multi-faceted analyses and for designing semantically rich machine learning models. Furthermore, binding the locational information with findings is one of the key motivations in developing our novel reading system. Moreover, rather than using a simple grid format for location, our geometric regions are designed to straightforwardly reflect anatomical characteristics of the human eye and to practically capture clinically frequent findings. Not only is it convenient for doctors to communicate with each other with the more physiologic region information, but also the practical region division enables an efficient way for describing the state of the findings which can help ease the development of a machine learning system that can identify not only which findings are present but also where the findings are located.
In addition, as we have divided the system in Groups according to the raters' subspecialty (i.e., general ophthalmologists, retina specialists, and glaucoma specialists), which significantly positively affected the reliability of the reading for the corresponding subspecialty. As expected, retina subspecialists showed higher agreements in retinal findings and diagnoses than other raters, while glaucoma specialists did better in glaucoma findings and diagnoses than other raters. Agreement may be higher in the setting of clinical practice with dedicated healthcare providers, with other clinical background information also available, than in the research setting of this present study. Differences in career duration and experience, affiliated institute, and subspecialty between raters may have affected the annotation of ambiguous findings (e.g., asymptomatic aging changes with less clinical significance), which may also have led to disagreements. When the analyses were confined to images that had complete agreement for abnormality in step 2, the agreements regarding findings and diagnoses improved significantly, especially in drusen/drusenoid deposit, RNFLD, and glaucomatous disc change. This is possibly due to the exclusion of images with these borderline ambiguous findings. The quality and the level of truth of the readings of images used in machine learning is considered to have increasing importance in recent studies. Recently, a small set of adjudicated DR grades by retinal specialists showed substantial improvements in algorithm performance.13 Datasets with more readings per image with higher ground truth have been reported to show higher performance.2 The image set of our database can be grouped according to the raters' subspecialty, and the level of confidence may be increased to use in settings requiring higher level of evidence.
Even with these advantages, our reading system for retinal fundus images also has several limitations. Various factors may have affected the rather low inter-rater agreement in our study. The raters in the present study were asked to read images only for research purpose without any other demographic and clinical information except age and gender. The non-clinical use and lack of other clinical and ophthalmologic information may have affected the readings and their agreements. Providing the raters with other clinical information such as the presence of systemic conditions including hypertension and diabetes mellitus, ophthalmologic history and ophthalmologic measurements such as visual acuity or intraocular pressure, status of the contralateral eye, and previous examination images may enhance the accuracy of each individual raters' decisions. The individual grading environment of raters was not standardized, and inter-rater agreement may have been sacrificed with relatively poor quality of the display system in some raters. Detailed and precise criteria for certain ambiguous findings may have also leaded to improved agreement among readers. Another limitation of our system is that we simplified the number of findings and diagnoses available, as the system was first intended to be developed for the purpose of screening rather healthy individuals. The present system grouped these other findings/diagnoses as a separate grouped variable, therefore we could re-read these images using a modified reading system if needed in the future. The location information of the findings was not at the pixel level, but in compartments defined by normal anatomical structures in the fundus, which may limit use in future studies requiring pixel level location information. Our system was designed to grade only posterior pole images without information on the area outside the angle of the fundus image. Image quality such as media opacity, small pupil, defocusing was not put into account in this analysis, but information on image quality was also collected, and may be considered in future analyses using this database.
In conclusion, our reading system can provide efficient generation of retinal fundus images with detailed, high-quality multi-dimensional categorical information including image quality, findings, diagnoses, and clinical significance, which provides a framework for understanding how ophthalmologists assess retinal fundus images according to 5 each rating step and can be effectively utilized in developing algorithms for assessing and visualizing findings as well as for determining diagnoses from retinal fundus images. The degenerated data present various degrees of agreements between graders according to findings and diagnoses, which emphasize the importance of addressing the grader variability in the development of algorithms.
 XML Download