

 PDF
PDF Citation
 Print
Print


INTRODUCTION
Asbestos is a major occupational and environmental risk factor for workers and civilians, as it causes asbestos-related diseases (ARDs) including lung fibrosis (asbestosis), pleural fibrosis (plaque and thickening), lung cancer, peritoneal and pleural malignant mesothelioma, laryngeal cancer, and ovarian cancer.12 The occupational burden of disease (OBD) of ARDs is largely studied worldwide. The World Health Organization (WHO) estimated that approximately 125 million people could be exposed to asbestos at the workplace, which results in at least 10,700 deaths per year due to lung cancer, malignant mesothelioma, and asbestosis.3 In addition, the WHO has reported high OBDs of ARDs: From 1994 to 2010, occupational asbestos exposure has led to 1,523,000 disability-adjusted life years (DALYs), 2.18 million potential years of life lost (PYLL) from 128,015 deaths due to malignant mesothelioma, and 180,000 PYLL from 13,885 deaths due to asbestosis.2 Furthermore, OBDs of ARDs worldwide,45 in each continent,6 in countries in Europe,7 in USA,8 and in Japan9 have been previously reported.
The total amount of asbestos used in Korea, including that from mined and imported sources, is approximately 2–2.8 million tons, which comes from approximately 1,500 asbestos sources including 42 asbestos mines, 199 asbestos factories, and 17 asbestos-processing plants.10 In Korea, occupational ARDs have been compensated by the industrial accident-compensation insurance act (IACIA) since 1963, and the number of compensated occupational ARD cases in Korea has increased after the first recognized case of occupational cancer in an asbestos textile factory in 1993.1 In particular, the number of reported cases of environmental ARDs has rapidly increased since 2011, after the release of Asbestos Injury Relief Act (AIRA) in Korea.1112
Although the number of cases of ARDs is increasing in the country, studies on OBDs of ARDs are lacking in Korea. Therefore, this study aimed to estimate the proportion of occupationally exposed population and determine the OBDs of ARDs in Korea, and compare the results from Korea with those from other countries.
Go to : 
METHODS
Data collection
The CARcinogen Exposure (CAREX) database was developed by the Finish Institute of Occupational Health and is used to estimate the exposed population.13 CAREX is a widely used tool for estimation of occupational exposure to carcinogens in Europe and other parts of the world, including Korea.1415161718 The number of working people according to the standard industrial code (SIC) was multiplied by the CAREX proportion and turnover rate (TOR) as per the following formula. In addition, a turnover factor of 4 was applied.419
where TOR is the turnover rate.4
Table 1 shows the proportion of workers exposed to asbestos in each economic sector of the CAREX database according to the International SIC (ISIC) 2.0. The exposed number of workers was estimated according to the Korean SIC (KSIC) by using the Economically Active Population Survey of Korea 1989–2013.20 Because ARDs, including asbestosis and cancers, have a minimum of 10 years of latency period,12 the exposed population before at least 10 years from ARDs was our study topic. Although the exposed population in 1979–2003 was of concern, the subcategory of KSIC to match ISIC was available since 1991. Hence, the exposed population of 1991–2003 could be estimated. KSIC was converted into the ISIC 2.0, and the exposed proportion provided by CAREX was applied.
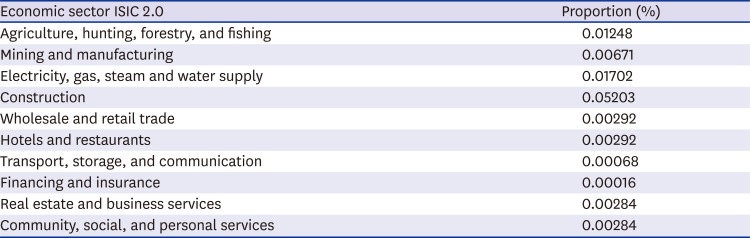
Table 1
Data of workers exposed to asbestos according to economic sectors from the CAREX database
![]()
We estimated the population-attributable fraction (PAF) from the relative risk (RR) of ARDs and estimated the risk groups. The following formula was used for calculating PAF:
where P is the proportion of the population exposed.
The RRs of lung cancer, laryngeal cancer, and ovarian cancer due to asbestos exposure were obtained from a previous meta-analysis (Table 2).212223 Among the ARDs, malignant mesothelioma and asbestosis were considered 100% attributable to asbestos. To calculate the disease burden due to premature death, we estimated the PYLL and annual average PYLL (APYLL) using the following formula:

where Digj is the number of deaths for age group gi and Leigj is the life expectancy for age group gi
Life expectancy tables from a previous study in Korea were used for each age group.24 Data on the number of deaths and life expectancy due to asbestosis, malignant mesothelioma, lung cancer, laryngeal cancer, and ovarian cancer in each age group were collected from WHO mortality database, which is an official compilation of data from member-state governments.25 Since the database has been widely used for OBDs of asbestos,45679 this study used this database for compatibility. Since the mortality data from the WHO for Korea was fully available from 1998, we used data from 1998 to 2013, i.e., 16 years. A literature review was performed to determine the OBD of asbestos in other countries using the PubMed database. The following search terms were used: “asbestos” or “asbestosis” or “mesothelioma” or “lung cancer” or “laryngeal cancer” or “ovarian cancer” and “disease burden” or “PYLL” or “YPLL.” Only 7 articles were selected from among 2,591 articles by using these search terms.4568142627 Full text review of the relevant articles was conducted and Google scholar search engine was used to find other studies.
Go to :
RESULTS
The minimum total working population was 19,938,000 people in 1999, and the maximum was 24,681,000 people in 2012 (Table 3). The minimum and maximum estimated exposed population from 1998 to 2013, considering a TOR of 4, was 659,193 in 1999 and 745,914 in 2007.
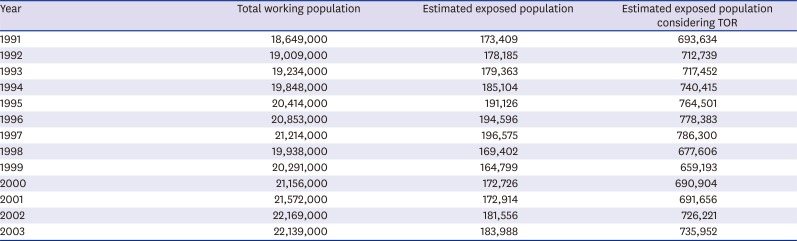
Table 3
Population exposed to asbestos each year (1991–2003)
![]()
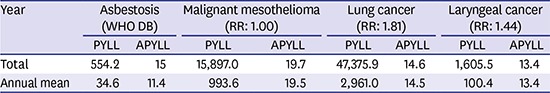
The number of deaths, PYLL, APYLL, and average age at death due to asbestosis, malignant mesothelioma, lung cancer, laryngeal cancer, and ovarian cancer from 1998 to 2013 are presented in Table 4. The total number of ARD attributable deaths and PYLL due to asbestosis, malignant mesothelioma, lung cancer, laryngeal cancer, and ovarian cancer were 37 and 554.2; 808 and 15,877.0; 3,256 and 47,375.9; 120 and 1,605.5; and 271 and 6,331.1, respectively. The proportion of women among them was 43.2%, 31.7%, 26.3%, 11.7%, and 100%, respectively. The proportion of deaths and PYLL due to asbestosis, malignant mesothelioma, lung cancer, laryngeal cancer, and ovarian cancer in the total population were 0.8% and 0.8%; 18.0% and 22.0%; 72.5% and 66.0%; 2.7% and 2.2%; and 6.0% and 8.8%, respectively. The average number of deaths and PYLL in these groups were 2.3 and 34.6; 50.5 and 993.6; 203.5 and 2,961.0; 7.5 and 100.3; and 16.9 and 395.7, respectively (Table 4). Furthermore, the annual proportion of deaths due to asbestosis was 4.6% compared to that due to malignant mesothelioma (Table 4). The APYLL were 15.0, 19.7, 14.6, 13.4, and 23.4, respectively. The average age at death was 70.4, 62.6, 69.1, 69.9, and 61.8, respectively.
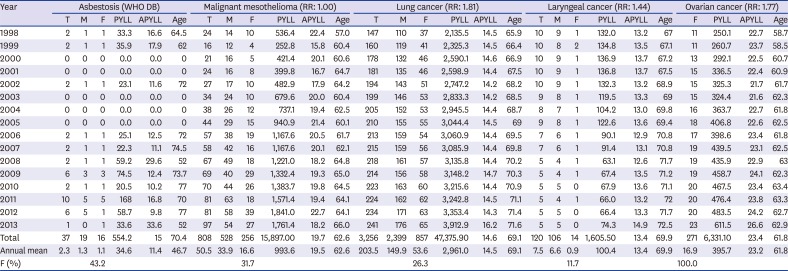
Table 4
Number of cases attributable to asbestosis and mesothelial, lung, laryngeal, and ovarian cancers by sex, and their PYLL, APYLL, and average age at death
WHO = World Health Organization, RR = relative risk, T = total, M = male, F = female, PYLL = potential years of life loss, APYLL = annual average PYLL, Age = average age at death.
![]()
The OBDs of other countries are presented in Table 5. In 2000, asbestosis resulted in 7,000 deaths with 76,056 PYLL and 13.3 APYLL worldwide. During 1995–2010, asbestosis resulted in 620 deaths with 35,579 PYLL in Japan. The number of deaths, PYLL, APYLL, and average age at death due to asbestosis in Europe in 1994–2010 were 5,728, 76,056, 13.3, and 73.5, respectively. The proportion of women affected by asbestosis in Europe in this period was 6.9%. The number of deaths, PYLL, and average age at death due to asbestosis in USA in 1999–2010 were 6,290, 56,907, and 79.0, respectively. The proportion of women affected by asbestosis in USA in this period was 5.1%.
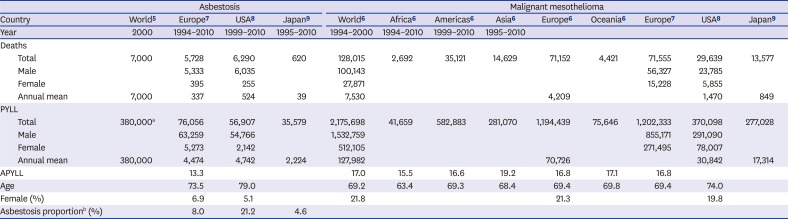
Table 5
Occupational disease burden of asbestos-related diseases worldwide
| Asbestosis | Malignant mesothelioma | |||||||||||||
|---|---|---|---|---|---|---|---|---|---|---|---|---|---|---|
| Country | World5 | Europe7 | USA8 | Japan9 | World6 | Africa6 | Americas6 | Asia6 | Europe6 | Oceania6 | Europe7 | USA8 | Japan9 | |
| Year | 2000 | 1994–2010 | 1999–2010 | 1995–2010 | 1994–2000 | 1994–2010 | 1999–2010 | 1995–2010 | ||||||
| Deaths | ||||||||||||||
| Total | 7,000 | 5,728 | 6,290 | 620 | 128,015 | 2,692 | 35,121 | 14,629 | 71,152 | 4,421 | 71,555 | 29,639 | 13,577 | |
| Male | 5,333 | 6,035 | 100,143 | 56,327 | 23,785 | |||||||||
| Female | 395 | 255 | 27,871 | 15,228 | 5,855 | |||||||||
| Annual mean | 7,000 | 337 | 524 | 39 | 7,530 | 4,209 | 1,470 | 849 | ||||||
| PYLL | ||||||||||||||
| Total | 380,000a | 76,056 | 56,907 | 35,579 | 2,175,698 | 41,659 | 582,883 | 281,070 | 1,194,439 | 75,646 | 1,202,333 | 370,098 | 277,028 | |
| Male | 63,259 | 54,766 | 1,532,759 | 855,171 | 291,090 | |||||||||
| Female | 5,273 | 2,142 | 512,105 | 271,495 | 78,007 | |||||||||
| Annual mean | 380,000 | 4,474 | 4,742 | 2,224 | 127,982 | 70,726 | 30,842 | 17,314 | ||||||
| APYLL | 13.3 | 17.0 | 15.5 | 16.6 | 19.2 | 16.8 | 17.1 | 16.8 | ||||||
| Age | 73.5 | 79.0 | 69.2 | 63.4 | 69.3 | 68.4 | 69.4 | 69.8 | 69.4 | 74.0 | ||||
| Female (%) | 6.9 | 5.1 | 21.8 | 21.3 | 19.8 | |||||||||
| Asbestosis proportionb (%) | 8.0 | 21.2 | 4.6 | |||||||||||
PYLL = potential years of life loss, APYLL= annual average PYLL.
aDisability-adjusted life year; bAsbestosis/(asbestosis + MM).
![]()
The number of deaths, PYLL, APYLL, and average age at death due to malignant mesothelioma worldwide in 1994–2000 were 129,015; 2,175,698; 17.0; and 19.2, respectively. The proportion of women affected by malignant mesothelioma worldwide in this period was 21.8%. The number of deaths, PYLL, APYLL, and average age at death due to malignant mesothelioma in Europe in 1994–2010 were 71,555; 1,202,333; 16.8; and 69.4, respectively. The proportion of women affected by malignant mesothelioma in Europe in this period was 21.3%. The number of deaths, PYLL, and average age at death due to malignant mesothelioma in USA in 1999–2010 were 29,639; 370,098; and 74.0, respectively. The proportion of women affected by malignant mesothelioma in USA in this period was 19.8%. The number of deaths and PYLL due to malignant mesothelioma in Japan in 1995–2010 was 13,577 and 277,028, respectively.
Based on calculations from the data in Table 5, the mean number of annual deaths and PYLL due to asbestosis in worldwide, Europe, USA, and Japan are 7,000 and 380,000; 337 and 4,474; 524 and 4,742; and 39 and 2,224, respectively. In addition, the mean deaths and PYLL due to malignant mesothelioma in worldwide, Europe, USA, and Japan were 7,530 and 127,982; 4,209 and 70,726; 1,470 and 30,842; 849 and 17,314, respectively. The annual proportion of death due to asbestosis compared to that due to malignant mesothelioma was 8.0% in Europe, 21.2% in USA, and 4.6% in Japan.
The annual average number of deaths attributable to laryngeal cancer due to asbestos was 7.5 in Korea, 5.8 in Argentina, 13.6 in Brazil, 2.8 in Colombia, and 3.6 in Mexico.14 Furthermore, the number of cases of death attributable to ovarian cancer was 16.9 in Korea, 2.8 in Argentina, 8.6 in Brazil, and 1.8 in Colombia, and 4.4 in Mexico.
Go to :
DISCUSSION
Lung cancer showed the majority proportion, highest number of attributable deaths, and most PYLL among all ARDs in Korea. This could be due to the high incidence and mortality of lung cancer in Korea.25 Although lung cancer was the most important ARD with the highest OBD in Korea, the compensation for occupational or environmental ARDs provided by the IACIA or AIRA was very low.12 We also found that the mean number of deaths and PYLL due to malignant mesothelioma in Korea was much lower than that worldwide, in Europe, in USA, and in Japan. Considering that 170 tons of asbestos can cause 1 death from malignant mesothelioma,27 the use of 240–280 million tons of asbestos used in Korea might have a much bigger impact on the number of deaths caused by malignant mesothelioma than specified in the WHO mortality database.25 This discrepancy can be explained by the low use of crocidolite and sprayed asbestos in Korea as compared to other countries or a lag in the latency period.12 The latency period in Korea might not have passed yet since the rapid increase in asbestos usage. The mean number of annual deaths and PYLL due to asbestosis in Korea were much lower than those worldwide, in Europe, in USA, and in Japan. The OBDs of asbestosis in Korea tended to be lower than that in other countries possibly due to the under-diagnosis of asbestosis. When a person with a history of asbestosis dies, the cause of death might not be reported as asbestosis unless he/she has been compensated and dies due to respiratory problems. Moreover, asbestosis is not a popular diagnosis among physicians in Korea. The fact that the first asbestosis case in Korea was reported relatively recently in 1994 might explain the rationale of the under-diagnosis.12 In general, approximately 80% of asbestosis cases could be missed due to non-compensation, and consequently, they might not be listed as asbestosis cases in the mortality statistics.28
Ovarian cancer showed the highest APYLL among all ARDs possibly because of the lowest age at death due to cancer and high life expectancy among women in Korea.24 The average age of death due to asbestosis in Korea was lower than that in Europe and USA, whereas the APYLL in Korea was higher than that in Europe. The average age at death due to malignant mesothelioma in Korea was lower than that worldwide, in Europe, and in USA, and the APYLL in Korea was higher than that worldwide and in Europe. The lower age at death and higher APYLL of ARDs in Korea indicates that the ARDs have higher OBDs in Korea than in the other countries.
Since we found only one study on OBDs of laryngeal and ovarian cancers in our literature search, the comparison of the ARDs was limited. Although the annual average number of deaths attributable to laryngeal cancer due to asbestos varied among countries in that study,14 it was difficult to compare these data directly owing to the population size and stage of industrialization.
The present study has some limitations that need to be addressed. First, this study relies on data of the exposure population from the CAREX database. The industrial structure and asbestos exposure pattern in the industry might differ between Korea and Europe, which could lead to underestimation or overestimation of exposure population. In addition, the TOR of 4 might cause under- or over-estimation of the exposed population. Considering a higher 1-year TOR in Asia (Korea, China, and Japan) than in other areas in 2008, a TOR of 4 might underestimate the exposed population. Second, we applied specific RRs and PAFs based on the exposed population for lung cancer, laryngeal cancer, and ovarian cancer to estimate their asbestos burden. We applied the most-recent and appropriate RRs to the Korean population. However, the RR for lung cancer based on populations including the Korean population21 and RRs for laryngeal cancer and ovarian cancer based on the Korean population were not found. In addition, PAF based on RRs is an indirect method of estimation of disease burden. This might cause both under- or overestimation. These two limitations might be due to the indirect study methods used. To overcome these limitations, direct studies based on large-size, stratified interviews of the working population and cancer patients are needed. Third, we used the WHO mortality database for the outcome of death due to ARDs. These data might underestimate the number of deaths due to asbestosis and malignant mesothelioma. Fourth, although the Korean government has already compensated environmental ARDs since 2011 with AIRA,11 we could not extend the scope of this study to the environmental disease burden. Although a study conducted burden of diseases (BDs) on lung cancer, ovarian cancer, and laryngeal cancer of Korea in general, it did not study asbestos burden.29 Hence, this study is the first one to study BDs of asbestos in Korea.
In conclusion, this is the first study on OBDs of ARDs in Korea and one of the few studies to compare all ARDs including laryngeal and ovarian cancer. Considering the past use of asbestos in Korea, ARDs are expected to continue to increase. Although Korea has stopped using asbestos, asbestos-containing materials still persist in the environment; their demolition is currently in process. Efforts to reduce the PYLL and APYLL, including early detection and proper management, are needed in Korea.
Go to :
 XML Download