

 PDF
PDF Citation
 Print
Print


INTRODUCTION
Recently, pen-based devices have emerged as useful tools for measuring pH and glucose, and for fabricating microchannels and microarrays. Pen-based devices take advantage of flexible patterning, inexpensive costs, and small volumes, thereby saving time and increasing efficiency.123 Pen-based techniques have been used to pattern surfaces for cell studies.456 Such approaches can also be used to apply patterns on nano- or micro-scales for biological uses. These techniques have been extended to new applications for surface modification, tissue manipulation, and drug discovery. Traditionally, most pen-based techniques have been used for patterning,7 scanning,8 or transferring9 biomolecules such as DNA, antibodies, and proteins, and have been based directly on the use of a writing tool to generate chemical functionality on a target surface.
Pen-based techniques have provided cost effective and methodological advantages for biological applications. A marker pen-based assay has been successfully applied to analyze multiple proteins, glucose concentrations, and pH values of biological targets. It is a very effective, inexpensive, and promising microfluidic system that uses only a waterproof marker pen.101112 This pen-based microfluidic technique is capable of decreasing the cost, time, and labor associated with microfluidic systems. This is because the pen-based microfluidic technique, as a low-cost desktop manufacturing platform, enables thermoplastic microfluidic fabrication without significant infrastructure investment. This fabrication is highly desirable for device prototyping and low-volume production.1314 Therefore, this pen-based technique provides a rapid, simple, and low-cost tool for biological and microfluidic applications. To expand to more flexible and scalable uses of pen-based techniques, we have developed a gradient nib marker pen device for biological testing. Our device is ideal for bioassays performed using a number of different concentrations of one or more types of agents in order to obtain a definitive measurement.1516 Antibiotic susceptibility testing (AST) is widely used to select appropriate antibiotics in clinical practice.1718 The most generally used method of AST is agar disk diffusion first established by Kirby-Bauer. The agar disk diffusion method processes with paper disks containing antibiotics upon the plate of bacteria according to the standard of the Clinical and Laboratory Standard Institute (CLSI). This method produces the inhibition zone of bacterial growth and decides the quantitative antibiotic concentration based on the biostatistical results over a long period of time; also there is the Epsilometer test (E-test) and broth dilution methods later modified by the National Committee for Clinical Laboratory Standards (NCCLS). The E-test is similar to the above-mentioned agar diffusion test. This test uses a plastic stripe carrying predefined antibiotics with concentration gradient on the solid media. The broth dilution test is performed with a series of dilution tubes including nutrient medium and diversely diluted antibiotics. To identify the antibiotic concentration, it needs the subculture from each dilution tube on the agar plate. These methods have disadvantages; they are time consuming, involve a laborious repetitive process, and require a relatively expensive system.
We therefore want to reduce the repetitive process and develop an AST system suitable for laboratory scale. The pen-based techniques have been performed to bioassay. They proposed that these are a rapid, simple, portable and low-cost tool. Based on this, we conceived a device for producing antibiotic concentrations at one time and proposed that the gradient device included a number of antibiotic concentrations. Our marker pen device has a continual gradient of antibiotic and does not require repetitive and wasteful dilution steps. The marker pen device is valuable for AST, as well as, will be suitable for various bioassays.
METHODS
Marker pen device components
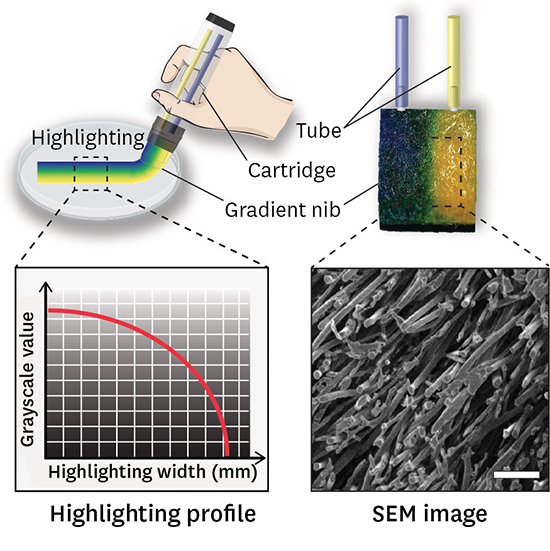
The gradient nib marker pen device consists of a nib, cartridge and coupler. The nib is disposable and can be easily removed from the cartridge holder, so there is no problem with contamination. The biological agent comes out of the nib and reaches the substrate, like paper. The cartridge is designed for multiple agents and enables a continuous supply to the nib. The cartridge holder continuously supplies ink into the nib and assists with easy handling. The coupler joins both cartridge and nib. We simply designed the marker pen device within the framework of these basic concepts. To generate the gradient, we organized at least two separated cartridge tubes for injecting the different concentrations of inks. The coupler uses the metal tips and links between the cartridge tube and nib. The designed nib increases abrasion resistance, and its fiber bundles are oriented in the direction of flow. The pore structure of the nib facilitates fluid flow, and it is specifically designed to aid capillary action. The nib is also suitable for dispensing fluids of different viscosities, such as DI water (1 cP), ethanol (1.2 cP), and polyvinylpyrrolidone (PVP; 30 cP) at 20°C, or fluid containing particulate matter (for example, hydrogel microparticles). Our nibs are made of polyester fibers and designed to hold their shape with low deformation over a long lifetime. The 20 mm cube-shaped nib (Art Primo, Seattle, WA, USA) is formed from a bundle of polyester fibers with highly uniform porosity and unidirectional orientation. The nib connects two inlets from the cartridge, made from Tygon® tubing, to the supply agents. The size of the cartridge tube is 6 mm in diameter and 60 mm in length, and the liquid volume of the tube is 1.6 mL. The cartridge can easily be assembled without leakage, and all components of the device can be sterilized at a clean bench using UV light before testing. We used blue and yellow food dyes (McCormick Co., Inc., Sparks, MD, USA) to generate color gradients and gradient shapes with the marker pen. Fig. 1A shows a schematic of a gradient formed using the nib marker pen. The inner structure of the cube nib was examined using a scanning electron microscope (SEM). The SEM image of the nib presents a bundle of polymer fibers and a unidirectional porosity under 200 μm. Fig. 1B shows the structure of the gradient nib marker pen device. The main components are the nib, coupler, and cartridge. The cartridge can supply each solution without additional force because of capillary action. Fig. 1C shows the way in which the gradient nib marker pen was used to draw lines of antibiotics on bacterial agar plates.
Fig. 1
Schematic of gradient formation using the gradient nib marker pen. (A) The inner structure of the cube nib was examined using a SEM. The SEM image of the nib presents a bundle of polymer fibers and a unidirectional porosity under 200 μm. (B) Structure of the gradient nib marker pen system, which consists of nib, coupler, and tube cartridge. (C) Photograph of the gradient nib marker pen, which is used to draw lines of antibiotic on the bacterial agar plate (scale bar: 400 μm).
SEM = scanning electron microscope.
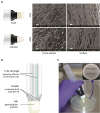
Furthermore, a multiplex gradient was achieved using several different-colored food dyes. Fig. 2A shows the process used to generate a multiplex color gradient. As shown in Fig. 2B, the nib marker pen can freely draw various shapes and patterns while maintaining the multiplex color gradient. As a possible application, we demonstrated assessment of bacterial sensitivity in an antibiotic susceptibility test (AST).1920 As shown in Fig. 3A, ASTs are commonly-used clinical procedures that help select an appropriate antibiotic against a pathogenic microbe. The most widely-used testing method, the Kirby-Bauer agar disk diffusion assay,21 quantifies the antibiotic sensitivity of bacteria based on the guidelines of the CLSI.22 The World Health Organization (WHO) standard AST method on solid medium is the Kirby-Bauer test. Mueller-Hinton agar medium is poured to only 4 mm depth of the 100 mm Petri dishes and inoculation size is 0.5 McFarland. This method involves placing a filter-paper disk containing a specified concentration of antibiotic on a bacterial culture plate. A clear zone or ring around the filter-paper disk will develop where the bacteria cannot grow because of the antibiotic. To obtain the definitive concentration that represents the minimum inhibitory concentration (MIC), it is routinely necessary to repeat this process.
Fig. 2
Schematic of multiplex color gradient formation using the gradient nib marker pen. (A) Diagram of the multiple-color-diffused nib and gradients produced using colored food dyes (front, vertical, and horizontal section). (B) The nib marker pen is able to draw various patterns with color gradients, such as springs, zig-zags, twist stamps, crosses, and arches (scale bar: 5 mm).
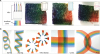
Fig. 3
Clinical procedures for AST. (A) The conventional goals of AST are to detect possible drug resistance to common pathogens and to confirm susceptibility to the drug of choice for particular infections. (B) The gradient nib marker pen device provides concentration gradient marking on the bacterial surface in AST.
AST = antibiotic susceptibility testing, DI = deionized.

Bacterial strains
In preparation for using the gradient nib marker pen device for bacterial sensitivity tests, we cultured Escherichia coli (ATCC 25922; American Type Culture Collection, Manassas, VA, USA) to the mid-exponential growth phase in Mueller-Hinton broth 2 (M-H broth 2; Sigma-Aldrich Chemie GmbH, Buchs, Switzerland) at 37°C with shaking at 200 rpm overnight. Mueller-Hinton agar is used for routine AST as part of the Kirby-Bauer disc diffusion method. To prepare this growth medium, 38 g of Mueller-Hinton agar 2 (M-H agar 2; BD Diagnostic Systems, Franklin Lakes, NJ, USA) was suspended in 1 L of purified water and mixed thoroughly. Heating with frequent agitation and boiling for 1 minute completely dissolved the components. The medium was autoclaved at 121°C for 15 minutes and cooled to 45°C. E. coli cells (3.0 × 10⁸ cells/mL, McFarland = 1.0) were mixed with cooled Mueller-Hinton agar 2 and poured into sterile Petri dishes on a level, horizontal surface to give uniform depth, and then solidified in the Petri dishes at room temperature. The final volume of the mixture was approximately 20 mL per Petri dish.
Antibiotic and probiotic application
Fig. 3B shows that our tool provided a concentration gradient of antibiotic when it was applied as a marking on the agar/bacterial surface. The marked zones with the antibiotic gradients affected bacterial viability. We have shown distinctly different states of bacterial sensitivity. For the antibiotic agent, we chose tetracycline hydrochloride (TC; C22H24N2O8·HCl; Sigma-Aldrich, St. Louis, MO, USA) because it is an essential antibiotic according to the World Health Organization.23 TC was diluted to 30, 100, 200, and 300 μg/mL in sterile distilled water and stored in the refrigerator at 4°C. The TC concentrations followed the CLSI Performance Standards. After TC marking on the bacterial agar plate, the plate was incubated at 37°C for 30 hours. To demonstrate the effects of the antibiotic gradient on bacterial viability, we added the probiotic agent tryptone (TP; Sigma-Aldrich). In contrast to antibiotics, probiotics are a common supplement added to media for maximizing bacterial growth. We simultaneously applied TC and TP to the cartridge of the gradient nib marker pen device.
RESULTS
Grayscale digital photography to quantify bacterial cell density
To assess bacterial sensitivity by conventional AST, the agar diffusion method commonly used to test whether bacteria are affected by antibiotics was used. Paper disks containing antibiotics were placed on the bacterial agar plate, and the plate was left to incubate. If diffusion of the antibiotic killed the bacteria or inhibited growth, an area around the disks (where the bacteria did not grow) was visible. This was the zone of inhibition, and the size of this zone depended on the concentration of the applied antibiotic. This zone, together with the concentration gradient, was used to estimate bacterial sensitivity to a particular antibiotic. Captured digital images of the bacterial inhibition zones were converted from grayscale images using the Image J program (National Institutes of Health, Bethesda, MD, USA) for implementation of the McFarland standards.24252627 The gray levels from Image J, corresponding to bacterial cell densities, were predefined by the McFarland method. The McFarland standard numbers allow determination of bacterial cell densities in a liquid medium (Table 1). These numbers are used to assign turbidity-based values, in order to determine bacterial cell densities. The gray levels in our study were proportional to the McFarland standard numbers, and were therefore easily converted into bacterial cell densities. Fig. 4 shows the gray levels derived from the E. coli agar plate. The gray levels of the captured images, interpreted according to the McFarland standard numbers (0.5, 1.0, 2.0, and 3.0), were used to quantify the results of all assays.28
Table 1
McFarland standards

| McFarland standard No. | Approx. cell density (1 × 10⁸ CFU/mL) | Transmittancea, % |
|---|---|---|
| 0.5 | 1.5 | 74.3 |
| 1 | 3.0 | 55.6 |
| 2 | 6.0 | 35.6 |
| 3 | 9.0 | 26.4 |
| 4 | 12.0 | 21.5 |
Fig. 4
The plot on the right was directly obtained from the gray levels of the captured images, corresponding to pre-defined McFarland standards. The McFarland standards were used as a reference to adjust the turbidity of bacterial suspensions so that the number of bacteria were within a given range, in order to standardize microbial testing (CV = 4.0% with n = 3).
CV = coefficient of variation.
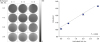
The captured images (8-bit grayscale) were assigned gray values ranging from 0 (black) to 255 (white) using the Image J program. We captured a central area of the plate marking to avoid reflections of the edges in the culture dish. The trend line of the plot describes the relationship between gray values and bacterial density by McFarland standard numbers (R2 = 0.9976). The range of gray values showed effective availability for optical measurements on a laboratory scale.29
Bacterial sensitivity by an antibiotic gradient
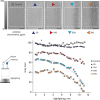
We performed AST by using the gradient nib marker pen device, and quantitatively analyzed bacterial sensitivity using gray levels. To quantify bacterial sensitivity according to the antibiotic concentration gradient, we converted the captured images of the marking zone into gray levels. Fig. 5 shows captured images of the E. coli inhibition zone with the antibiotic TC after 30 hours of culture. The grayscale bar indicates the gray levels from the captured images and their values, representing bacterial inhibition levels according to the gradient. A gray level of zero means that there was no visible E. coli growth, whereas a value of 100 means that there was visible growth. The panels show the antibiotic gradient profiles of four different concentrations of TC (30, 100, 200, and 300 μg per mL). In the WHO standard method of the in vitro diffusion method on solid medium (Kirby-Bauer test), the 9 mm test disk harboring 30 μg TC is used and the diameter of the clear zone including the disk size for E. coli (ATCC 25922) is 11–15 mm.3031 For comparison with the WHO standard AST method, the size of the nib was determined as bigger than the 9 mm test disk in standard AST method. We found that the TC concentration of 30 μg reached at 12 mm. This result shows that the gradient nib marker device has correlation with the standard AST method on solid medium. We also have higher concentrations of TC to show the obvious gradient pattern. The viability of E. coli depended on the TC concentration, with suppression of growth at high concentrations. The data plot of TC concentration against E. coli growth in the inhibition zones shows different efficacies of antibiotic action, especially at high concentrations of TC (greater than 200 μg). It also shows more defined values for E. coli sensitivity than the agar diffusion method using paper disks.
Fig. 5
Captured images of E. coli inhibition within zones of antibiotic (TC) marking (dashed boxes). The grayscale bar indicates the gray levels from the captured images that represent viability of E. coli within the TC gradient. The concentrations of TC were 30, 100, 200, and 300 μg/mL (n = 3), diluted in sterile distilled water. The graph shows the TC gradient profiles generated by the marking (scale bar: 5 mm).
TC = tetracycline hydrochloride.
Bacterial sensitivity by multiplexed agent gradients
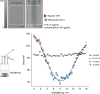
For the feasibility of multiple gradient patterns in our device as opposed to the traditional method, we show the opposite growth of bacteria using TP and TC by increasing the gradient range by setting the high antibiotic concentration. We can simultaneously create multiplexed gradients for different types of agents. Two opposing agents, an antibiotic and a probiotic, were used to determine the bacterial sensitivity to multiplexed gradients. TC is a growth-suppression factor, whereas TP is a growth-promoting factor. A predefined concentration (200 μg) of the antibiotic and the probiotic was applied to the nib marker pen device. We then created multiplexed concentration gradients of probiotic-antibiotic-probiotic (TP-TC-TP). Fig. 6 shows captured images of the E. coli inhibition zones after TP-TC-TP marking and 30 hours of culture. Applying the same procedures, the data plot represents bacterial inhibition levels according to the TP-TC-TP gradient. The gray levels were distinctly divided in response to the antibiotic and the probiotic zones, and represented E. coli sensitivity according to the TP-TC-TP gradient. The central zone of the plot shows suppression of E. coli growth, whereas both sides of the inhibition area show enhanced E. coli growth with respect to the control. The grayscale values clearly show that growth of E. coli was enhanced by TP, but inhibited by TC.
Fig. 6
The E. coli inhibition zones varied according to the presence of antibiotic (TC) or probiotic (TP). The captured images of the E. coli inhibition zones within the TP-TC-TP gradient are indicated by the dashed lines. The concentration of both TC and TP was 200 μg/mL (n = 3). The data plot shows the TP-TC-TP gradient profile. The gray levels represent E. coli sensitivity in response to the TP-TC-TP gradient (scale bar: 5 mm).
TC = tetracycline hydrochloride, TP = tryptone.
DISCUSSION
We have designed and fabricated a gradient nib marker pen device that generated simultaneously different antibiotic concentrations in bacteria AST. We used it to demonstrate bacterial sensitivity after antibiotic marking and quantitatively analyzed bacterial growth in response to bacterial viability. The antibiotic marking produces an inhibition zone of bacterial growth. The inhibition zones of bacterial growth are captured and converted to 8-bit grayscale images, and then quantified by gray values. Therefore, a profile of the inhibition zone showed different gray values in response to bacterial viability. Then we can determine the quantitative antibiotic concentration based on the relationship between gray values and bacterial density conveniently.
Described in this study, the disc diffusion method is actually used in hospitals by matching the length of the clear zone with the MIC of the minimum doubling time/growth curve. However, the disc must be tested several times according to each concentration, that is, it is necessary to frequently update the antibiotic concentration data until the definitive concentration that is called the minimal inhibitory concentration is reached. On the other hand, the advantage of the developed marker pen device is that it is convenient to experiment on a single disk by generating a concentration gradient. However, until now, the MIC cannot be obtained accurately compared with the conventional method AST. We will build a system that can obtain more accurate MIC in the marker pen device through repeated experiments like the microdilution test.
In this study, only antibiotics as primary drugs were tested for discovering bacteria responses to antibiotic concentrations. However, the marker pen device can be easily expanded to examine the effects of other drugs or agents for bioassay. As one of them, we test our device for drug resistant tuberculosis, which is a major global health problem. We believe that this rapid and accurate marker pen device will help reduce the time and human efforts required for bioassay.
 XML Download