

 PDF
PDF Citation
 Print
Print


INTRODUCTION
Intermittent exotropia (IXT) is the most common form of childhood strabismus in Asian countries,1 characterized by a gradual, progressive exo-deviation of either eye that is present mainly during distance fixation or when the patient is inattentive.23 Although stereoacuity testing is considered the standard method for clinically evaluating binocular vision of patients with IXT, there have been concerns about the usefulness of near stereoacuity because near stereoacuity is generally expected to be normal and it usually remains stable in patients with IXT,45 whereas distance stereoacuity in patients with IXT varies depending on the characteristics of the test used.67 There is increasing recognition of the importance of assessing control status in IXT,8 which correlate to severity of XT and stereoacuity in the patients with IXT,910 however there is no consensus regarding the best method by which to measure control in IXT patients.11 As an alternative approach, binocular summation (the improved visual performance of binocular vision relative to monocular vision), as a measure of binocular vision may play an additional role in evaluating and monitoring of certain ocular diseases or conditions.9121314
Contrast sensitivity testing (CST) is similar to hearing testing. In a hearing test, a variety of frequencies and decibel levels are tested to determine the full hearing abilities of the individual. In a similar manner, CST evaluates vision over a range of spatial frequencies and contrast levels. By evaluating vision at different frequencies and contrast levels, CST provides a better assessment of visual function and quality than visual acuity testing alone.15 In addition, binocular summation is more enhanced for lower-contrast tests.1617 We therefore hypothesized that evaluating binocular summation by using CST may provide additional information regarding binocular vision in patients with IXT and may serve as an additional examination method for evaluating binocular vision in patients with IXT.
The purpose of this study was to compare binocular contrast sensitivity summation ratio between patients with IXT and normal controls, and to evaluate the correlation between binocular contrast sensitivity summation and stereoacuity, and control status in patients with IXT, respectively.
Go to : 
METHODS
Subjects
We conducted a prospective case-control study between September 2016 and August 2017. Patients with basic and divergence excess type IXT without intervening treatment, and normal controls with orthotropia or exophoria of < 8 prism diopters (PD) were included. All subjects underwent a complete ophthalmologic examination. For each subject, both near (40 cm) and distance (3 m) stereoacuity was measured by using the Preschool Randot test (Stereo Optical Co., Inc., Chicago, IL, USA) while wearing his or her best refractive correction. A “pass” at each level was defined as two of three correct responses.1819 The Preschool Randot test has thresholds that range from 800 to 40 seconds of arc, with the best score recorded at 40 seconds of arc and the worst score recorded at 800 seconds of arc. However, subjects who were unable to discern the grossest level of stereopsis (800 seconds of arc) were assigned a score of 10,000 seconds of arc in order to statistically distinguish them from those with some form of stereoacuity.20 We also evaluated an office-based control scale at the distance target, the minimum scale is 0 (good control, exophoria) and the maximum is 5 (poor control, manifest exotropia).8
Subjects were excluded if they had conditions that could affect contrast sensitivity, such as amblyopia, anisometropia, refractive errors greater than ± 3.00 diopters or astigmatism of more than ± 1.50 diopters, constant exotropia, vertical deviation of > 5 PD, paralytic or restrictive exotropia, and/or known global developmental or neurological abnormalities. Exclusion criteria also included inability to perform contrast sensitivity test and stereoacuity test (age < 8 years old).
CST and binocular contrast sensitivity summation ratio calculation
Functional CST was measured at five spatial frequencies (1.5, 3.0, 6.0, 12, and 18 cycles/degree) by using the Optec 6500 vision testing system (Stereo Optical Co., Inc.). Each participant underwent monocular and binocular CST with his or her best refractive correction under identical luminance conditions (85 cd/m2). Frequencies were presented in random order at zero contrast and subjects were required to increase the contrast until the grating could just be detected. The mean of three such measurements on each grating was recorded as the threshold.
Binocular contrast sensitivity summation ratio for each spatial frequency was calculated by using the quadratic summation formula, which is based on the binocular energy-detector model and can reflect the first order account of the pairs of right eye and left eye stimuli that produce binocular summation.21
where B is the binocular contrast sensitivity, and R and L are respective sensitivities of the right and left eyes.
Statistical analysis
Independent t-tests and χ2 tests were used to compare characteristics between patients with IXT and normal controls. Comparisons of mean binocular contrast sensitivity summation ratio at each spatial frequency, between patients with IXT and normal controls, were performed with the independent t-test and the repeated-measures analysis of variance. For multiple measurements, Bonferroni correction was applied when necessary. Stereoacuity of patients with IXT was transformed because of its non-normal distribution.20 The correlation between binocular contrast sensitivity summation ratio at each spatial frequency and log stereoacuity was then calculated by using a Spearman correlation test. Spearman correlation was calculated to evaluate the relationship between binocular contrast summation ratio and existing measures of IXT control scale. Since the correlation coefficients rely on the assumption of dose response relationship, the relationship was also examined by dividing patients into subgroups using Kruskall-Wallis tests. In such an analysis, the patients were divided into 3 subgroups according to office-based control scale: Good control (scale 0–2), moderate control (scale 3 and 4), and poor control (scale 5).8 If there was a statistically significant difference in a Kruskal-Wallis test, pairwise subgroup analysis was done by Mann-Whitney U test to find the differences between two subgroups. A P value of < 0.05 was considered statistically significant. All data were analyzed with SPSS version 21 (IBM, Armonk, NY, USA).
Ethics statement
This study was reviewed and approved by the Institutional Review Board of Pusan National University Yangsan Hospital (IRB No. 05-2016-115). The written informed consent was obtained from all subjects or their parents when they were enrolled.
Go to :
RESULTS
Thirty-seven patients with IXT and 41 normal controls were enrolled in this study. The mean exo-deviation at distance fixation was 30.9 ± 12.1 PD (range: 10–60 PD) and at near fixation was 25.2 ± 13.3 PD (range: 10–50 PD) for patients with IXT. There were no differences in clinical characteristics between patients with IXT and normal controls, with the exception of near and distance stereoacuity (Table 1). Monocular contrast sensitivity at each spatial frequency showed no significant difference between patients with IXT and normal controls (Table 2). Patients with IXT had significantly lower binocular contrast sensitivity at 1.5 cycles/degree than normal controls; however, binocular contrast sensitivities at 3.0, 6.0, 12, and 18 cycles/degree in patients with IXT were similar to those in normal controls (Table 2).
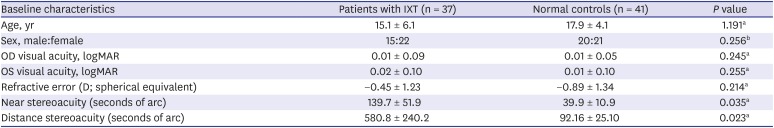
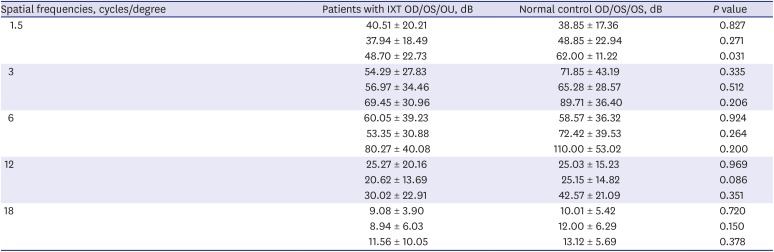
Table 1
Basic clinical characteristics for patients with IXT and normal controls
Data are presented as means ± standard deviation (range).
IXT = intermittent exotropia, OD = right eye, OS = left eye, D = diopter.
aIndependent two sample t-test; bχ2 test.
![]()
Table 2
Comparison of contrast sensitivity between the patients with IXT and normal controla
Data are presented as means ± standard deviation (range).
IXT = intermittent exotropia, OD = right eye, OS = left eye, OU = both eye.
aIndependent two sample t-test.
![]()
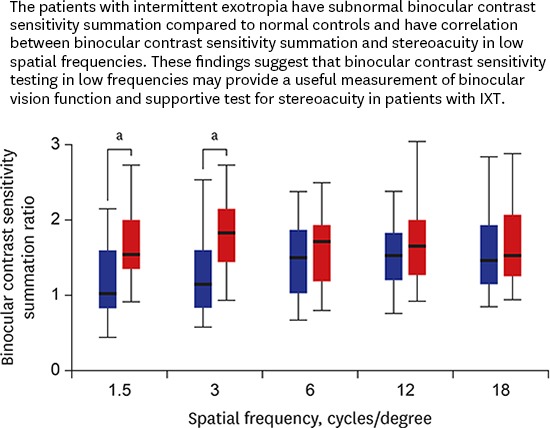
Patients with IXT demonstrated a lower binocular contrast sensitivity summation ratio than normal controls at 1.5 and 3.0 cycles/degree (mean at cycles/degree, 1.01 ± 1.02 vs. 1.62 ± 1.88, P = 0.017; 1.17 ± 0.96 vs. 1.86 ± 1.75, P = 0.038, respectively, Fig. 1). The mean binocular contrast sensitivity summation ratio at 6.0, 12, and 18 cycles/degree in patients with IXT were similar to those in normal controls (Fig. 1).
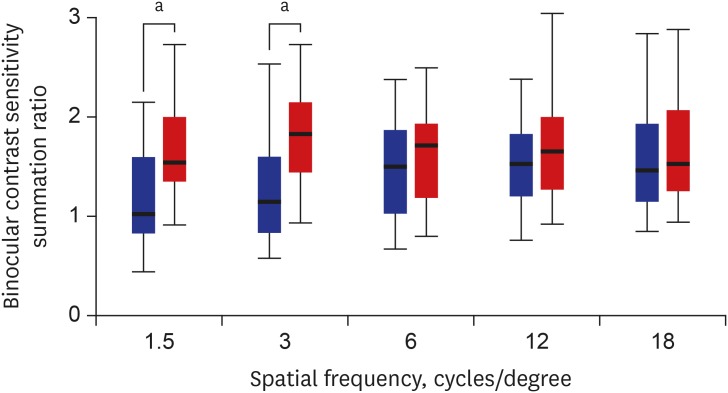 | Fig. 1Box plots of binocular contrast sensitivity summation ratio in patients with IXT (blue box) and normal controls (red box) at each spatial frequency. Top and bottom of the boxes represent upper and lower quartiles and whiskers represented maximum and minimum values. The mean and upper quartiles of binocular contrast sensitivity summation of patients with IXT were lower than the mean of normal controls in 1.5 and 3.0 cycles/degree frequencies.IXT = intermittent exotropia.
aSignificantly different patients and normal controls, P < 0.05.
|
The correlation between binocular contrast summation ratio at 3.0 cycles/degree and both near and distance stereoacuity were statistically significant in patients with IXT (r = −0.411, P = 0.012 and r = −0.624, P = 0.005, respectively) (Table 3). Binocular contrast sensitivity summation ratio at 1.5 cycles/degree also correlated significantly with distance stereoacuity (r = −0.397, P = 0.034) (Table 3). Binocular contrast sensitivity summation ratio at 6.0, 12, and 18 cycles/degree showed no significant correlation with both near and distance stereoacuity (All P > 0.05) (Table 3).
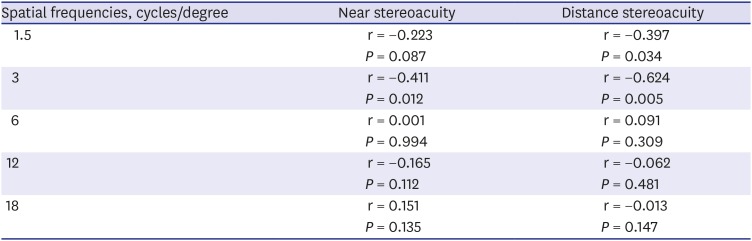
Table 3
Correlation of binocular contrast sensitivity summation and stereoacuity in patients with intermittent exotropiaa
![]()
We found a significant correlation between binocular contrast sensitivity summation ratio and control scale at 1.5, 3.0, and 6.0 cycles/degree (r = −0.327, P = 0.041; r = −0.418, P = 0.028; and r = −0.298 P = 0.033, receptively). There was no significant correlation between binocular contrast sensitivity summation ratio and control scale at 12 and 18 cycles/degree (r = 0.13, P = 0.83; and r = 0.03, P = 0.91). In addition, binocular contrast sensitivity summation ratio had significantly differed in control scale groupings analysis at 1.5 and 3.0 cycles/degree (P = 0.035 and P = 0.019) (Table 4), however, there were similar binocular contrast sensitivity summation ratio between control scale groups at 6.0, 12, and 18 cycle/degree (All P > 0.05, Table 4). Mann-Whitney analysis showed significant differences in binocular contrast sensitivity summation ratio especially good control group (scale 0–2) and poor control (scale 5) group both 1.5 and 3.0 cycles/degree (P = 0.006 and P = 0.005, respectively). The difference between binocular contrast summation ratio for 3.0 cycle/degree for those with moderate control (scale 3 and 4) and poor control (scale 5) was also significant (P = 0.01) after post hoc analysis.
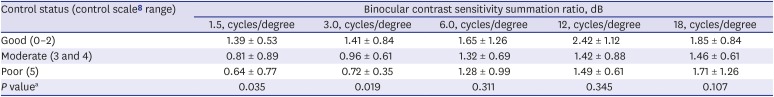
Table 4
Binocular contrast sensitivity summation ratio in groups based on an office-based scale for assessing control in intermittent exotropia
| Control status (control scale8 range) | Binocular contrast sensitivity summation ratio, dB | ||||
|---|---|---|---|---|---|
| 1.5, cycles/degree | 3.0, cycles/degree | 6.0, cycles/degree | 12, cycles/degree | 18, cycles/degree | |
| Good (0–2) | 1.39 ± 0.53 | 1.41 ± 0.84 | 1.65 ± 1.26 | 2.42 ± 1.12 | 1.85 ± 0.84 |
| Moderate (3 and 4) | 0.81 ± 0.89 | 0.96 ± 0.61 | 1.32 ± 0.69 | 1.42 ± 0.88 | 1.46 ± 0.61 |
| Poor (5) | 0.64 ± 0.77 | 0.72 ± 0.35 | 1.28 ± 0.99 | 1.49 ± 0.61 | 1.71 ± 1.26 |
| P valuea | 0.035 | 0.019 | 0.311 | 0.345 | 0.107 |
![]()
Go to :
DISCUSSION
We found that binocular contrast sensitivity summation ratio in patients with IXT were lower than normal controls at 1.5 and 3.0 cycles/degree frequencies. In addition, we revealed a significant correlation between binocular contrast sensitivity summation ratio at 1.5 and 3.0 cycles/degree and stereoacuity in patients with IXT, and lower binocular contrast summation ratio was associated with higher control scale (poor control) exotropia in the 1.5 and 3.0 cycles/degree frequencies. Binocular summation assessment using CST would be a useful method when evaluating binocular visual function and severity of exotropia in the patients with IXT, and binocular CST in the low frequency had more significant correlation with stereoacuity and control scale.
Binocular summation is the process by which vision with two eyes is enhanced over what would be expected with just one eye. Probability summation and neural summation attribute binocular summation,22 and several methods have been used to assess binocular summation ratio.92023 Previous studies used visual acuity to evaluate binocular summation ratio,92023 however, we used the quadratic summation formula to investigate binocular summation status because our study was based on the CST. It is generally accepted that two eyes are better than one, but the extent of improvement is unclear. Campbell and Green24 and other experimental studies have shown that binocular summation should decrease visual threshold by a factor of 1.4 (1.4 times better than monocular threshold, approximately 0.15-log-unit improvement in sensitivity).2325 Pineles et al.26 reported similar results, where respective binocular summation ratio for normal controls were 1.3 and 1.5 with Sloan 1.25% and 2.5% low-contrast acuity charts. Kattan et al.20 applied a more practical method to define binocular summation ratio, as > 5 letters (one line, 0.1 units on the logMAR scale) visual acuity improvement relative to monocular visual acuity. Our study also demonstrated that the mean binocular summation ratio at 1.5, 3.0, 6.0, and 12 cycles/degree was higher than 1.4 in normal controls, however, normal controls did not exhibit the mean ratio of more than 1.4 at 18 cycles/degree frequencies. We believe this may be due in part to test-retest variability, patient fatigue, or undiagnosed interocular difference in our participants. Nonetheless, we found a robustly significant difference between the patients with IXT and normal controls: the mean binocular contrast sensitivity summation ratio of patients with IXT was lower than 1.4 at 1.5 and 3.0 cycles/degree frequencies, and the binocular contrast sensitivity summation ratio of patients with IXT were statistically lower than normal controls at 1.5 and 3.0 cycles/degree frequencies. Therefore, we suggested that low spatial frequencies may be a more sensitive clinical measure of binocular contrast sensitivity summation ratio in patients with IXT.
Lema and Blake12 have reported that monocular and binocular contrast thresholds were measured over a range of spatial frequencies in normal and stereo-blind observers. Unlike normal individuals whose binocular thresholds were consistently lower than their monocular thresholds, stereo-blind individuals were no better with two eyes than with one eye. Moreover, a decrease in binocular summation in stereo-blind individuals was demonstrated with visual evoked potentials.27 Pardhan and Gilchrist14 have reported that patients with anisometropic amblyopia had subnormal binocular summation in high spatial frequencies. Kattan et al.20 demonstrated that stereopsis and binocular summation were significantly correlated in strabismus patients who underwent surgical correction. In the current study, patients with IXT showed a significant correlation between stereoacuity and binocular contrast sensitivity summation ratio at 1.5 and 3.0 cycles/degree frequencies, respectively. We highlight that binocular contrast sensitivity summation ratio was lower than in normal controls, and that stereoacuity correlated with binocular contrast sensitivity summation in the same frequencies (1.5 and 3.0 cycles/degree), representing low spatial frequency areas in CST. Among two primary parallel visual pathways (referred to as parvocellular and magnocellular), the magnocellular pathway is involved in processing luminance changes, motion, and low spatial frequencies, whereas the parvocellular pathway is involved in processing color, fine texture, and high spatial frequencies.28 The magnocellular pathway is important for the detection of orientation and position of objects in space; this information is useful for detecting differences in the positions of objects on the retina of each eye, an important tool in binocular depth perception.2930 We therefore hypothesize that subnormal binocular contrast sensitivity summation under low spatial frequencies in patients with IXT demonstrates a neurophysiologic role of the magnocellular pathway in binocular vision development of patients with IXT, and that stereopsis and binocular summation are mediated by a common neural mechanism.
The ability of control IXT has been considered a measure of severity of IXT.831 Previous studies revealed the relationship between control scale and stereoacuity in the patients with IXT.51032 In addition, Yulek et al.9 reported that significantly lower binocular summation in patients with IXT with higher control scoring (poor control state) using low-contrast acuity charts test, and they concluded decreased binocular summation was associated with less control in IXT patients. We also have similar results that binocular contrast sensitivity summation ratio have negative correlation with office-based control scale in the patients with IXT when low frequencies CST condition. Although, neural linked mechanism between binocular summation and control status in the patients with IXT is not clear, we expect that measuring binocular summation using CST may have a supportive role to assess and monitor the severity of IXT.
There are a number of weaknesses in our study. First, we used the sinusoidal CST, which can test only spatial contrast sensitivities. Nevertheless, we achieved meaningful results solely by measuring contrast sensitivities alongside spatial frequency; further studies of the effects of temporal frequency on patients with IXT are required. Secondly, when interocular differences in visual acuity are large, a destructive neural interaction (known as binocular inhibition) can occur, diminishing the participants' binocular score compared with that of the better eye. In these cases, participants exhibit better monocular vision than binocular vision.1433 Previous studies have reported that binocular inhibition were present in patients with amblyopia, unilateral cataract, multiple sclerosis, aging, and strabismus patients.123435363738 A specific ratio to define binocular inhibition remains unclear: < 1 has been regarded as binocular inhibition. Interestingly, we found that some patients with IXT study exhibited < 1 binocular inhibition; however, interocular visual acuity was not significant in our study group. This issue is difficult to study; however, established binocular vision defects in patients with IXT, suppression, interocular fusion control differences, or unknown neural mechanisms may influence these findings. We anticipate further studies of defining binocular inhibition in patients with IXT using CST, and clinical characteristics comparison between normal binocular contrast sensitivity summation and binocular contrast sensitivity inhibition in patients with IXT.
Our findings of subnormal binocular contrasts sensitivity summation ratio in patients with IXT suggest that binocular CST in low frequencies may provide a useful test for assessing and monitoring binocular visual function and control status in patients with IXT. Further research is required to investigate functional benefits of strabismus surgery on binocular summation, and the relationship between binocular summation and quality of life in patients with IXT in the near future.
Go to :
 XML Download