

 PDF
PDF Citation
 Print
Print


INTRODUCTION
Although recent advances in immunosuppressive regimens after kidney transplantation (KT) have reduced the incidence and consequences of T-cell-mediated rejection (TCMR) and have improved short-term outcomes, long-term allograft loss attributable to antibody-mediated rejection (AMR) is still responsible for substantial medical and socioeconomic burdens in kidney transplant recipients (KTRs).12 Therefore, clarifying and monitoring the most important contributing factors to immunologic mechanisms associated with allograft loss, as well as defining their characteristics, is crucial.
Numerous studies have shown that de novo donor-specific anti-human leukocyte antigens (HLA) antibodies (DSA) after KT are associated with AMR, which leads to allograft loss.3456789 As not all KTRs with de novo DSA develop AMR, previous studies have tried to address the characteristics of de novo DSA in terms of pathogenic capacity. It was reported that DSA against class II HLA are associated with a poor prognosis3101112 and that mean fluorescence intensity (MFI) values1314 and complement fixing activity of DSA are correlated with the risk of AMR and allograft loss in KTRs.1516 However, the exact properties of de novo DSA that are directly linked to AMR and allograft loss still remain to be established.
The goal of this study was to investigate the incidence and associated factors of de novo DSA and the effect of de novo DSA on AMR, and to clarify the characteristics of DSA leading to AMR in KTRs which can be easily and readily accessible in clinical practice.
METHODS
Patients
A total of 203 KTRs aged > 18 years who underwent KT at Kyungpook National University Hospital between January 2010 and December 2013 were enrolled. We excluded patients with pre-transplant anti-HLA antibodies (n = 31) and those with missing data regarding pre-transplant anti-HLA antibodies (n = 5). Finally, 167 KTRs were included in this study.
Anti-HLA antibody detection and DSA identification
All enrolled KTRs were prospectively screened for the development of de novo DSA at 3, 6, and 12 months post-transplant and annually thereafter, and when clinically indicated. Measurement timings of DSA detection varied with a mean of 0.5 months during the first year post-transplant and of 2.5 months after more than 2 years post-transplant, depending on the variation in the dates when patients visited a transplant outpatient clinic. The panel-reactive antibody (PRA)-identification (ID) was carried out using Lifecodes Class I and Class II ID kits (Immucor, Stamford, CT, USA). Multiple class I or II antigen-coated Luminex beads were incubated with recipient serum samples. The sensitized beads were then washed to remove the unbound antibody. A phycoerythrin-conjugated anti-human IgG was then added to the wells. After incubation in the dark on a rotating platform, test samples were analyzed by the Luminex instrument. The signal intensity from each bead was compared with that of beads treated with negative control sera, and positivity was determined according to the manufacturer's instructions. DSA were expressed as MFI, and MFI values > 500 were regarded as positive.1718
Tacrolimus (TAC) trough levels
Post-transplant time points were divided into 0–2 months, 3–6 months, and 7–12 months after KT. Low-level (LL) and standard-level (SL) TAC groups were defined based on mean TAC trough level at each period as 4–7 and 7–12 ng/mL for 0–2 months, 3–6 and 6–10 ng/mL for 3–6 months, and 2–5 and 5–8 ng/mL for 7–12 months, respectively. The coefficient of variation (CV, %) was defined as standard deviation/mean TAC trough level at each period × 100 to determine within-patient variability in TAC trough levels.19 TAC trough levels were measured using the Architect TAC assay (Abbott Diagnostics, Lake Forest, IL, USA).
Follow-up and outcome ascertainment
All KTRs were followed-up for the occurrence of TCMR, AMR, and allograft loss. Kidney allograft biopsies were performed in the event of allograft dysfunction, defined as more than a 30% rise in serum creatinine, and/or the presence of BK viremia, and/or clinical suspicion of BK virus nephropathy. All biopsies were obtained before treatment for the presumptive diagnosis and reviewed according to the Banff 2013 classification. Histologic evidence of acute tissue injury, evidence of current/recent antibody interaction with the vascular endothelium, and serologic evidence of DSA must be present for diagnosis of AMR. Histologic evidence of acute tissue injury includes microcirculation inflammation (MI), defined as the sum of the glomerulitis and peritubular capillaritis scores, intimal or transmural arteritis, acute thrombotic microangiopathy, or acute tubular injury, in the absence of any other apparent cause. Evidence of current/recent antibody interaction with the vascular endothelium include linear C4d staining in peritubular capillaries, at least moderate MI, or increased expression of gene transcripts in biopsy tissue indicative of endothelial injury.20 In the setting of de novo DSA, AMR can be diagnosed with MI ≥ 2.
Statistical analysis
Continuous variables were expressed as means ± standard deviation for normally distributed data and as median with range when the values were not normally distributed. The differences between the groups were tested by independent sample t-test or χ2 test, as appropriate. The Mann-Whitney U test was used when parameters exhibited a non-normal distribution. The Cox regression model has been used to analyze the factors associated with the development of de novo DSA. The cumulative incidences of TCMR, AMR, and death-censored allograft loss were analyzed according to the HLA antibody and DSA status using Kaplan-Meier analysis. Statistical analysis was performed using SPSS version 21.0 (SPSS, Chicago, IL, USA). P values < 0.05 were considered statistically significant.
RESULTS
Incidence of de novo DSA and patient characteristics
Of 167 KTRs, 26 (15.6%) developed de novo anti-HLA antibodies during a mean follow-up of 32.1 ± 13.2 months. Among 26 KTR with de novo anti-HLA antibodies, 16 developed DSA and 10 had non-DSA (Fig. 1). The average time till the first detection of de novo DSA was 24.0 months after KT.
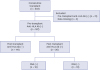 | Fig. 1Flow chart of patients. A total of 203 KTRs were enrolled. After excluding 31 patients with pre-transplant anti-HLA Ab and 5 patients with missing data regarding pre-transplant anti-HLA Ab, 167 KTRs were included in this study. Of 167 KTRs, 26 KTRs developed de novo anti-HLA Ab (16 were DSA and 10 were non-DSA).KTRs = kidney transplant recipients, HLA = human leukocyte antigens, DSA = donor-specific anti-human leukocyte antigens antibodies, anti-HLA Ab = anti-human leukocyte antigens antibodies.
|
Baseline characteristics of included KTRs are detailed in Table 1. The mean age of KTRs with de novo DSA was 48.5 years, and 87.5% of them were male. The mean number of total HLA mismatch was 3.2. One patient (6.3%) underwent ABO-incompatible KT and received desensitization prior to KT. All KTRs received calcineurin inhibitors, mycophenolic acid, and methylprednisolone as maintenance immunosuppressants. A total of 15 patients with de novo DSA (93.8%) received TAC-based immunosuppressant therapy. No significant differences in clinical and immunological characteristics, except for TAC trough levels within 1 year post-transplant, were observed between patients without de novo DSA and anti-HLA antibodies (n = 141) and patients with de novo DSA (n = 16). Patients with anti-HLA antibodies (+) DSA (+) and KTRs with anti-HLA antibodies (+) DSA (−) (n = 10) had significantly lower TAC trough levels during the first year after KT compared to the control group. No significant differences in CV were observed between the groups.
Table 1
Baseline characteristics of KTRs
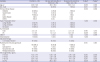
Values are shown as mean ± standard deviation (range) or number (%).
Ab = antibodies, ABOi = ABO incompatible, CGN = chronic glomerulonephritis, CV = coefficient of variation, DSA = donor-specific anti-human leukocyte antigens antibodies, HLA = human leukocyte antigens, IL = interleukin, KT = kidney transplantation, KTRs = kidney transplant recipients, TAC = tacrolimus.
aSignificance of the difference between control and de novo anti-HLA Ab (+) DSA (+); bSignificance of the difference between control and de novo anti-HLA Ab (+) DSA (−).
![]()
Factors associated with the development of de novo DSA
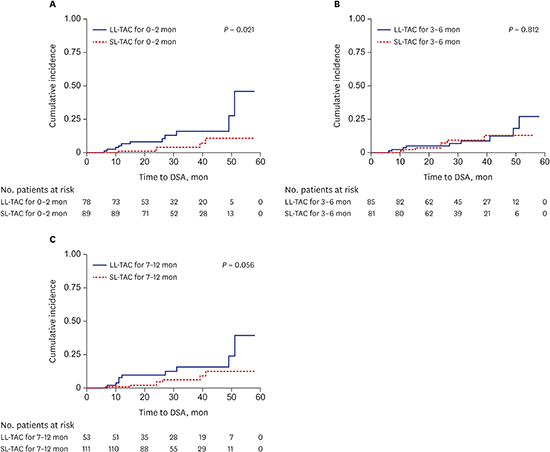
Univariate Cox regression analysis showed that age, sex, number of HLA mismatches, ABO compatibility, type of transplant donor, desensitization, and maintenance immunosuppressant therapy were not significantly associated with de novo DSA; however, lower TAC trough levels during the first year after KT were significantly associated with de novo DSA (0–2 months, hazard ratio [HR], 0.68; 95% confidence interval [CI], 0.48–0.96; P = 0.028; 3–6 months, HR, 0.70; 95% CI, 0.50–0.98; P = 0.040; 7–12 months, HR, 0.71; 95% CI, 0.52–0.97; P = 0.033). Multivariate Cox regression analysis demonstrated that lower TAC trough levels for 0–2 months after KT were significant independent predictors for the development of de novo DSA (HR, 0.70; 95% CI, 0.50–0.99; P = 0.043) (Table 2). Kaplan-Meier analysis for the development of DSA according to TAC trough levels during the three different periods also confirmed that the LL-TAC group for 0–2 months after KT was associated with a significantly increased risk of DSA development after 1 day post-transplant compared to the SL-TAC group (P = 0.021) (Fig. 2). However, there were no significant associations between the TAC trough levels at 3–6 months and 7–12 months and DSA development after 6 and 12 months post-transplant, respectively (Fig. 2).
Table 2
Univariate and multivariate Cox regression analysis for the development of de novo donor-specific antibodies
Values are presented as number (%).
CI = confidence interval, HLA = human leukocyte antigens, HR = hazard ratio, TAC = tacrolimus.
![]()
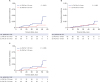 | Fig. 2Kaplan-Meier analysis for DSA development according to TAC trough levels after KT. (A) TAC trough levels at 0–2 months and DSA development after 1 day post-transplant, (B) TAC trough levels at 3–6 months and DSA development after 6 months post-transplant, (C) TAC trough levels at 7–12 months and DSA development after 12 months post-transplant. LL-TAC group for 0–2 months after KT showed significantly increased risk for the development of DSA compared to SL-TAC group (P = 0.021).DSA = donor-specific anti-human leukocyte antigens antibodies, TAC = tacrolimus, KT = kidney transplantation, LL = low-level, SL = standard-level.
|
Effect of de novo DSA on rejection
Fig. 3 shows the clinical outcomes of the control group, anti-HLA+ DSA+ group, and anti-HLA+ DSA group. In the KTRs with acute AMR, allograft biopsy was performed 108.3 ± 95.5 days after the development of de novo DSA. A significantly higher cumulative incidence of AMR was detected in the DSA group compared to the control and anti-HLA+ DSA− groups (P < 0.001). However, the cumulative incidences of TCMR and death-censored allograft loss were not significantly different between the three groups.
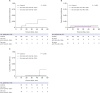 | Fig. 3The cumulative incidences of (A) AMR, (B) TCMR, and (C) death-censored allograft loss according to the presence of DSA. Acute AMR occurred more commonly in KTRs with de novo DSA compared to KTRs without de novo DSA (P < 0.001). No significant differences were found in the cumulative incidence of TCMR and death-censored allograft loss between groups.AMR = antibody-mediated rejection, TCMR = T-cell medicated rejection, DSA = donor-specific anti-human leukocyte antigens antibodies, KTRs = kidney transplant recipients.
|
Characteristics of DSA leading to AMR
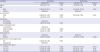
The characteristics of de novo DSA are shown in Table 3. The mean number of DSA was 1.8 ± 1.2, ranging from 1 to 5, and the average MFI of DSA was 7,399.3 ± 5,470.4. All de novo DSA were against class II antigens (10 against HLA-DQ, 1 against HLA-DR, and 5 against both). Among 16 KTRs with de novo DSA, 3 patients were screened for the development of de novo DSA when the patients were not under routine surveillance. Two, 4, and 7 KTRs had de novo DSA at the timepoints of 6, 12, ≥ 24 months post-transplant, respectively, with some variation in the exact time period. The detailed results of development of de novo DSA according to the time of detection are shown in Table 3. Of 16 KTRs with de novo DSA, AMR occurred only in 3 patients. No differences were detected in the number of DSA (2.3 ± 1.2 vs. 1.7 ± 1.3; P = 0.364), the average MFI of DSA (10,461.3 ± 1,917.4 vs. 6,692.6 ± 5,823.1; P = 0.364), the peak MFI of DSA (12,399.3 ± 1,300.9 vs. 7,737.3 ± 7,039.6; P = 0.364), the value obtained after multiplication by the number of DSA and the average MFI of DSA (24,112.0 ± 12,747.6 vs. 13,089.1 ± 16,581.0; P = 0.189), and TAC trough levels and CV during the first year after KT between de novo DSA positive KTRs with AMR and de novo DSA positive KTRs without AMR. When the characteristics of DSA were analyzed according to type of DSA, the average MFI of DSA against HLA-DQ was higher than that of DSA against HLA-DR in terms of development of AMR, although this difference did not reach statistical significance (11,600.0 ± 978.6 vs. 7,448.1 ± 6,812.6; P = 0.060).
Table 3
Characteristics of de novo donor-specific antibodies leading to AMR in KTRs according to detection timing
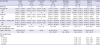
Values are shown as mean ± standard deviation. P value shows significance of the difference in values between DSA (+) AMR (−) and DSA (+) AMR (+).
KTRs = kidney transplant recipients, DSA = donor-specific anti-human leukocyte antigens antibodies, AMR = antibody-mediated rejection, MFI = mean fluorescence intensity, TAC = tacrolimus, CV = coefficient of variation.
![]()
Table 4 shows pathologic correlations of de novo DSA. No significant positive correlation was found between the sum score of MI and the number of DSA, the average MFI of DSA, and the value obtained after multiplication by the number of DSA and the average MFI of DSA. Results of indication biopsies based on the Banff 2013 scheme are detailed in Table 5.
Table 4
Correlation between MI score and de novo DSA characteristics leading to AMR in KTRs

| MI | Coefficient of correlation | P value |
|---|---|---|
| Average MFI | 0.000 | 1.000 |
| Peak MFI | 0.816 | 0.221 |
| Mean number × Average MFI | 0.866 | 0.333 |
MI = microcirculation inflammation, AMR = antibody-mediated rejection, DSA = donor-specific anti-human leukocyte antigens antibodies, KTRs = kidney transplant recipients, MFI = mean fluorescence intensity.
![]()
Table 5
Results of indication biopsies in KTRs with AMR and TCMR based on the Banff 2013 classification system
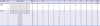
Banff scoring categories: g = glomerulitis, ptc = peritubular capillary inflammation, I = interstitial inflammation, t = tubulitis, v = vascular inflammation, ci = interstitial fibrosis, ct = tubular atrophy, cv = arterial fibrointimal thickening, ah = arteriolar hyaline thickening, cg = transplant glomerulopathy, mm = mesangial matrix increase.
KTRs = kidney transplant recipients, AMR = antibody-mediated rejection, TCMR = T-cell medicated rejection, DSA = donor-specific anti-human leukocyte antigens antibodies, anti-HLA Ab = anti-human leukocyte antigens antibodies.
![]()
DISCUSSION
This study demonstrated that de novo DSA occurred in 9.6% of KTRs with an average time till first detection of 24.0 months after KT. During a mean follow-up of 32.1 ± 13.2 months, the incidence of AMR, but not of TCMR or the risk of allograft loss, was significantly increased with the development of de novo DSA. The risk of de novo DSA was significantly higher in KTRs with lower TAC trough levels during the initial 2 months after KT. In our transplant center, de novo DSA leading to AMR did not have distinguishable characteristics in terms of the number and strength of DSA compared to de novo DSA which did not result in AMR.
Over the past decades, the main focus in the field of KT has shifted from T-cell-mediated processes, calcineurin inhibitor toxicity, and chronic allograft nephropathy to humoral rejection that is primarily responsible for the allograft loss. Therefore, insights regarding post-transplant development of anti-HLA antibodies and DSA have been extended. We know that de novo DSA can occur at any time in 20%–30% of patients after transplantation.3 A considerable variation in the incidence and time of appearance of de novo anti-HLA antibodies was detected after KT. A prospective study performed on 2,231 KTRs found that 21.4% of patients developed anti-HLA antibodies by 1 year after KT.21 Another study that included 1,014 KTRs from deceased donors has reported that 29% of included subjects developed anti-HLA antibodies and 31% of these antibodies were DSA.22 Another study performed on 315 KTRs with low immunologic risk showed that 15% of included patients developed de novo DSA by 4.6 ± 3.0 years after KT.10 In the current study, the incidence of development of de novo DSA was relatively low compared to previous studies. Considering that previous studies included a greater proportion of deceased KTRs22 and African-Americans,10 who are known to present higher immunologic risk factors,23 this finding might be related to the differences in the immunologic risk of the included patients. The difference in detection methods of anti-HLA antibodies might also influence the detected incidence of development of DSA. There is a possibility that previous studies1022 using single-antigen bead assays, which have higher sensitivity and specificity for identifying DSA, showed a higher incidence of DSA than our study using polyspecific identification.
In this study, the average MFI of de novo DSA was 7,399.3 ± 5,470.4 and only 18.8% of KTRs with de novo DSA experienced AMR. In our opinion, this result can be interpreted in three ways. First, although complement-binding assays were not performed in this study, we could speculate that the complement binding capacity of de novo DSA, regardless of DSA intensity, might determine the development of AMR. Second, although information regarding altered strength of immunosuppression at the time of appearance of DSA was not collected, there is a possibility that the degree of intensity of immunosuppressant treatment given by transplant physicians could affect the incidence of AMR. Third, relatively short follow-up duration after the occurrence of DSA might contribute to low incidence of AMR.
The most notable finding of this study was that lower TAC levels during 0–2 months post-transplant were an independent risk factor for the development of de novo DSA. Few studies have tried to investigate the association between TAC trough levels and the risk of de novo DSA. TAC trough levels of < 7 ng/mL between 4 and 12 months after KT24 or < 8 ng/mL during the first year after KT25 were associated with de novo DSA. With respect to the post-transplant periods, the association between TAC trough levels and the development of de novo DSA was different from the results of previous studies. Similar to previous studies, in our study, TAC trough levels of < 7 ng/mL during the first 2 months after KT increased the risk of de novo DSA. We speculate that a lower intensity of immunosuppressive therapy during the initial post-transplant period might play a negative role in terms of long-term immunologic consequences. Therefore, it could be an important task for transplant physicians to keep KTRs from experiencing lower TAC exposure in the therapeutic range so as to prevent the appearance of de novo DSA. However, TAC trough levels of < 7 ng/mL between 3 and 12 months after KT were not associated with the occurrence of de novo DSA in our study. This discrepancy could be explained by differences in induction therapy between the patients included between our study and previous ones. Since a previous study25 included more than 40% of KTRs who did not receive induction therapy, these patients might require relatively higher TAC concentrations for longer durations to prevent the development of DSA than our study population in which all KTRs received induction therapy.
Another important matter for transplant physicians is the detection of de novo DSA that are associated with destructive consequences, as the pathogenic capacity of de novo DSA is not equal. Although it is well known that complement binding capacity of DSA is a crucial factor which influences the pathogenic capacity of DSA,1516 this indicator is not easily and readily accessible in real-world clinical practice. Therefore, we tried to address the characteristics of DSA leading to AMR which can be quickly available in clinical practice. In this study, contrary to our expectation, de novo DSA resulting in AMR was not detrimental enough in terms of the number and the average MFI values, to be distinguishable from silent de novo DSA. This result might be explained by the prozone effect. The prozone effect refers to false-negative results which arise from factors that interfere with the binding of the secondary detection reagent.26 The factors include high antibody titers leading to complement activation and deposition of C1 complexes on beads, IgM antibody, or other serum factors.26 We speculate that the actual titer of de novo DSA leading to AMR in this study might be higher than what was measured. The lack of differences in DSA features between KTRs with and without AMR might be because of a small number of patients with DSA leading to AMR. However, considering that higher average MFI of DSA against HLA-DQ showed a trend, albeit not significant, for increased development of AMR, transplant clinicians should be alert regarding the formation of DSA against HLA-DQ with high affinity and increase the intensity of immunosuppressant therapy to the extent that no opportunistic infection occurs because the risk of AMR was significantly increased in the de novo DSA group compared to the persistently non-sensitized group.
To understand the detrimental effects of circulating de novo DSA on intragraft damage, the correlation between DSA in peripheral blood and histopathological lesions in renal allografts should be defined. Among the histopathological findings, the MI sum score of the renal allograft was reported to be significantly associated with immune activation in peripheral blood.27 Similarly, previous studies have demonstrated that the detection of de novo DSA was significantly associated with microvascular lesions or peritubular capillaritis scores,28 but not with scarring lesions.1011 Contrary to previous evidences, in our experience, we could not find any pathologic correlation with de novo DSA. No significant association was detected between MI sum score and the number and intensity of DSA. This might be because of fewer acute rejection episodes in this study.
This study has some limitations. First, as this was a single center study, we included a relatively small number of subjects. Second, longer follow-up duration is needed to compare allograft survival according to the presence of de novo DSA. Third, we did not perform complement-binding assays, such as binding to C1q or C3d, which might have yielded more useful results. Fourth, we did not perform renal allograft biopsies for KTRs with de novo DSA and stable renal function to exclude subclinical AMR. Therefore, we cannot completely exclude the possibility that subclinical humoral lesions can be present in those KTRs. Further and larger controlled studies are needed to provide confirmative and definitive conclusions regarding the clinical significance of early diagnosis and treatment in subclinical AMR in KTRs.
In conclusion, maintaining proper TAC trough levels during the initial period after KT to prevent the development of DSA, and regular immunological monitoring to detect DSA, are needed in KTRs because de novo DSA can increase the incidence of acute AMR. Close clinical monitoring and prompt interventions are imperative in KTRs with de novo DSA to reduce allograft damage induced by AMR.
 XML Download