

 PDF
PDF Citation
 Print
Print


INTRODUCTION
Beliefs and attitudes about cancer are closely associated with the ways that persons behave when confronted with cancer and related issues.1 Individuals who have negative attitudes towards cancer or believe that a cancer diagnosis is predetermined and invariably fatal are less likely to engage in preventive health behaviors,23 present with cancer-related symptoms in early stage of the disease,45 participate in cancer screenings,67 and receive treatment58 than those with positive attitudes.
More importantly, various demographic and socioeconomic factors can modify or interact with beliefs and influence health-related behaviors. Evidence from multiple studies suggests that positive and negative attitudes toward cancer vary by age, gender, education, income level, and ethnicity or cultural group.3910 In particular, fatalistic or negative attitudes about cancer have been found to be more prevalent in low socioeconomic and ethnic minority groups.451011 The combination of unemployment, less education, and social frustration were more likely to reinforce the fatalistic belief that certain life events are beyond one's control. Research findings also suggest that the negative attitudes among these groups might have led to avoidable delays in being diagnosed with cancer, and ultimately, worsened their survival outcomes.101213 Poor knowledge, perceived barriers to treatment, and low self-efficacy are presumed to mediate these associations.
Korea has experienced rapid industrialization and economic growth in recent decades. The country's fast-paced development has triggered advancements in medical technology and caused widespread changes in lifestyles and patterns of disease occurrence in a short period. However, it simultaneously has brought about a widening socioeconomic gap at the national level. Studies have reported that income inequality in Korea is linked to disparities in cancer-related behavioral risk factors, stage of the disease at diagnosis, and screening and mortality rates.141516 Likewise, in Korea, general attitudes towards cancer may vary by socioeconomic status (SES), although there are few reports on this issue.17
An individual's attitudes towards health risks usually reflect the psychological and cultural aspects of the community that he/she belongs to, as well as factors at the individual level.18 To acquire a better understanding of cancer-related health behaviors in the general population and to guide the development and implementation of public education programs, it is critical to know how people across different socioeconomic groups and demographic characteristics perceive cancer. This exploratory study examined differences in general beliefs and attitudes towards cancer among Koreans who did not have a firsthand experience of cancer and compared the implications of the study's findings to those of western populations.
METHODS
Study population
A cross-sectional survey was conducted in May 2017 that used a proportional quota random sampling design parameterized by gender, age, and geographic area, to select a representative sample of non-institutionalized Koreans who had no immediate experience of cancer for themselves or their family members. Initially, the samples were stratified by age and sex in each 17-administrative district (the cities and provinces) based on the 2016 census of Korea, then the sample size was obtained using a probability proportional to size (PPS) method. Of the randomly selected 1,460 responders who were consecutively telephoned, 460 responders were excluded from the interview because of absence and refusal to participate for several reasons, or because the responder was a cancer patient or had a family member with cancer. Finally, a total of 1,000 participants were interviewed (response rate: 68.5%), and the survey was conducted by face-to-face interview by Metrix Corporation (Seoul, Korea) by professional interviewers during May 2017. The Interview process was carefully reviewed and monitored by the researchers. Again, as our focus was on attitudes toward cancer of the general population, individuals diagnosed with cancer and those with immediate family members diagnosed with cancer were not recruited.
Variables and measures
The study variables were categorized as follows: age (20–29, 30–39, 40–49, 50–59, and 60 years and older), level of education (below high school, high school graduate, and college graduate or above), average monthly individual income (< 1.5, 1.5 to less than 3.0, 3.0 to less than 5.0, and ≥ 5.0 million KRW/month), region (metropolitan city including the capital city or province), economic activity (yes or no), marital status (single, married, or divorced/separated/widowed), and the presence of an underlying chronic disease other than cancer (yes or no).
General beliefs about cancer were assessed using the awareness and beliefs about cancer (ABC) measure as the cross-sectional questionnaire.1219 The original ABC was developed for use with populations at least 50 years of age, regardless of whether they had ever had the experience of being diagnosed with cancer themselves or had a family member who was diagnosed. Although the present study targeted adults aged 20–79 years, the ABC was used because it has been found to be a valid and reliable measure of cancer awareness and beliefs with international samples. The present study used 6 items from the ABC measuring “general cancer belief,” and the validity and reliability of the 6 items was not expected to be significantly different among participants in the younger age group (aged 20–49 years) because similar items have been examined for younger groups in previous studies.101720
Following minor revisions to enhance their clarity, the 6 statements describing cancer beliefs were presented to the participants in Korean in the same order as in the ABC: 1) These days, many people with cancer can expect to continue with normal activities and responsibilities; 2) Most cancer treatment is worse than the cancer itself; 3) I would NOT want to know if I have cancer; 4) Cancer can often be cured; 5) Going to the doctor as quickly as possible after noticing a symptom of cancer could increase the chances of surviving; and 6) A cancer diagnosis is a death sentence. The Cronbach's alpha values for the positive and negative statements were 0.59 and 0.30 in the present data, respectively.
As previously described, items 1, 4, and 5 were positively framed and items 2, 3, and 6 were negatively framed statements.12 Participants responded by choosing one of 5 categories: strongly disagree, disagree, agree, strongly agree or don't know. Their responses were dichotomized into agree (strongly agree and agree) and disagree (strongly disagree, disagree, and don't know) to avoid inflating the agreement proportion.
Data analysis
The categorical variables (gender, age, education, average monthly income, region, existence of an underlying chronic disease, and marital and employment status) are expressed as frequencies or percentages. Pearson's correlations were calculated to determine the strength of the correlations between the independent variables. For the multivariate logistic regression, gender, age, education, average monthly income, region, and marital and employment status were included to assess each independent effect. All statistical analyses were performed using SAS version 9.4 (SAS Institute Inc., Cary, NC, USA). A P value of 0.05 was considered to be statistically significant. The odds ratio (OR) and 95% confidence intervals (CIs) are presented as needed.
RESULTS
General characteristics of the participants and overall frequencies of agreement with the items
Table 1 presents the participants' demographic characteristics. The mean age of the entire sample was 45.8 years (standard deviation: 13.8), 70.4% were married, and 49% were college graduates or those with more education. The percentage of those who had a chronic disease other than cancer was 24.1%.
Table 1
General characteristic of the study population and agreement frequencies
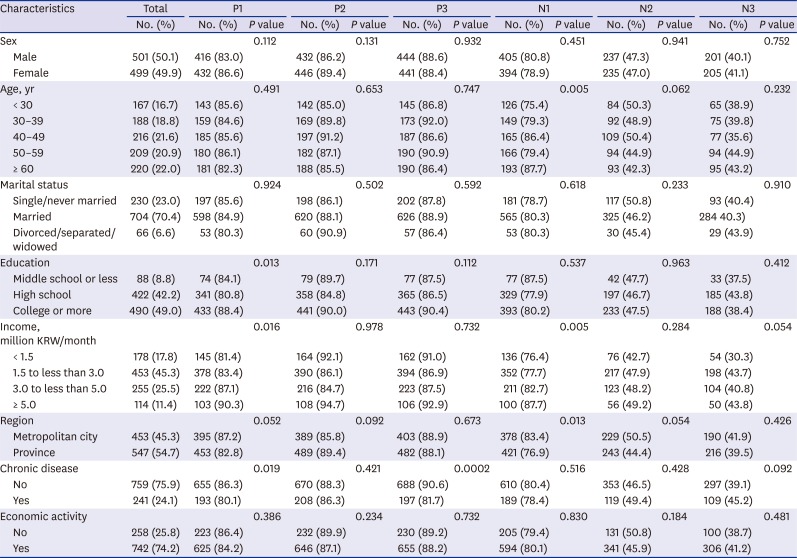
P1 = These days, many people with cancer can expect to continue with normal activities and responsibilities, P2 = Cancer can often be cured, P3 = Going to the doctor as quickly as possible after noticing a symptom of cancer could increase the chances of surviving, N1 = Most cancer treatment is worse than the cancer itself, N2 = I would not want to know if I have cancer, N3 = A cancer diagnosis is a death sentence.
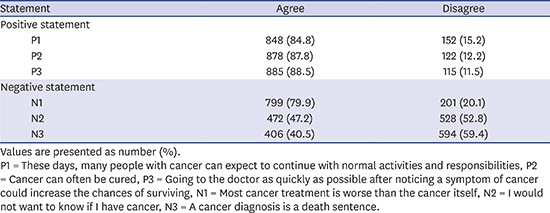
More than 80% of participants agreed with all three positively framed statements showing a highly optimistic attitude (Table 2). The agreement rate was the highest (88.5%) for the statement “going to the doctor as quickly as possible after noticing a symptom of cancer could increase the chances of surviving.” For the negatively framed statements, 79.9% of participants were concerned about the experience of having treatment rather than the cancer itself. The percentage of those who would not want to know if they have cancer was 47.2%, which was slightly lower than the percentage of those who would want to know (47.6%). The agreement rate was lowest for the statement that a cancer diagnosis is a death sentence (40.5%), which was surpassed by the disagreement rate (56.9%).
Table 2
Overall agreement frequencies of each statement
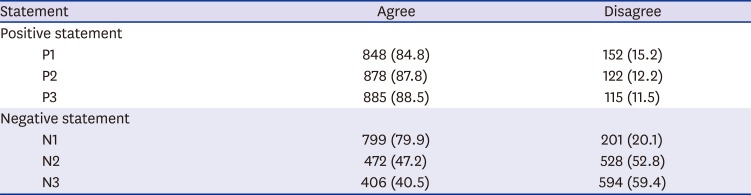
Values are presented as number (%).
P1 = These days, many people with cancer can expect to continue with normal activities and responsibilities, P2 = Cancer can often be cured, P3 = Going to the doctor as quickly as possible after noticing a symptom of cancer could increase the chances of surviving, N1 = Most cancer treatment is worse than the cancer itself, N2 = I would not want to know if I have cancer, N3 = A cancer diagnosis is a death sentence.
Factors associated with attitudes in univariate analysis
For the positive statements, socioeconomic disparities in agreement were not evident, except for a few results (Table 1). The upper boundaries of the CIs were high but the intervals were wide enough to be statistically insignificant. Highly educated (college or more) and higher income groups were more likely to believe that cancer patients can continue with normal activities (P1). Compared to respondents with a chronic disease, those without such diseases had a higher level of agreement with the positive beliefs that cancer patients can and do continue with normal activities (P1) and that early visits to the doctor increases their probability of survival (P3).
For the negatively framed statements, respondents who were older and had a higher income tended to agree with the belief that the experience of cancer treatment is worse than the cancer itself (N1). Higher income groups were more likely to view a cancer diagnosis as a death sentence (N3), and those who lived in metropolitan cities agreed with the negative belief more than those who lived in provincial areas that the experience of cancer treatment is worse than the cancer itself (N1).
Factors associated with attitudes in multivariate analysis
The tendency that highly educated and higher income groups were more likely to believe that cancer patients can continue with normal activities (P1) was not apparent in the multivariate analysis (data shown in Table 3). Rather, income groups with 1.5 to less than 5.0 million KRW/month were less optimistic about the chance of finding a cancer cure (P2), and they placed less value on early symptom recognition and clinic visits (P3) than the lowest income group (< 1.5 million KRW/month) did. Those without chronic diseases had a higher level of agreement with the positive beliefs that early visits to the doctor increases their probability of survival (P3).
Table 3
Adjusted analysis of the agreement rates by logistic regression
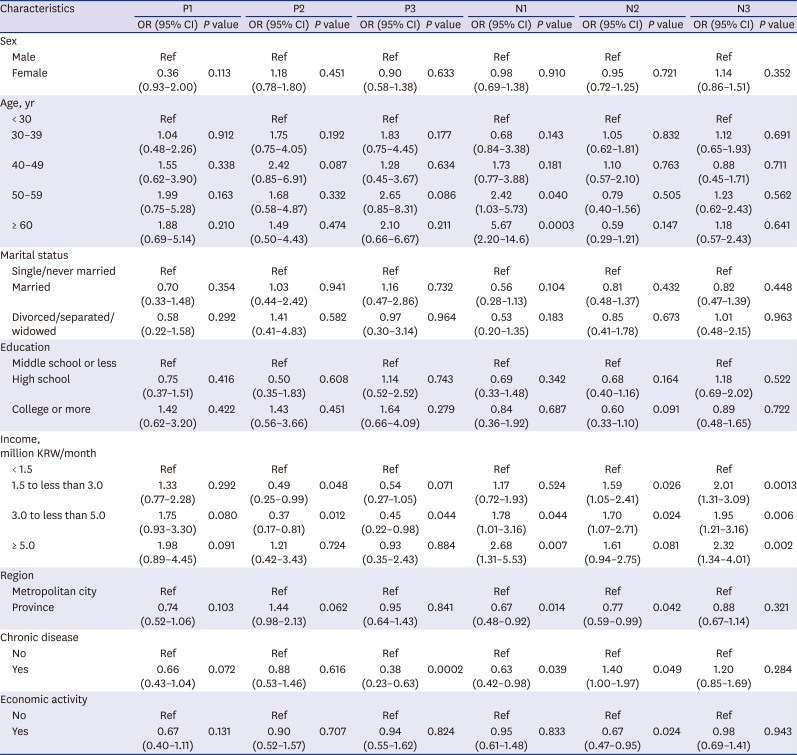
P1 = These days, many people with cancer can expect to continue with normal activities and responsibilities, P2 = Cancer can often be cured, P3 = Going to the doctor as quickly as possible after noticing a symptom of cancer could increase the chances of surviving, N1 = Most cancer treatment is worse than the cancer itself, N2 = I would not want to know if I have cancer, N3 = A cancer diagnosis is a death sentence, OR = odds ratio, CI = confidence interval.
For the negatively framed statements, the highest income group agreed more strongly with the statements that cancer treatment is worse than the cancer itself (N1: OR, 2.68; 95% CI, 1.31–5.53), that they would not want to know if they have cancer (N2: OR, 1.61; 95% CI, 0.94–2.75), and that a cancer diagnosis is a death sentence (N3: OR, 2.32; 95% CI, 1.34–4.01) compared to the lowest income group. Older respondents tended to have a greater fear of cancer treatment than the cancer itself (P for trend: 0.0013), but their agreement rates with the other two negative beliefs were not different from other age groups. Those who lived in metropolitan cities agreed with negative beliefs (N1 and N2) more than those who lived in provincial areas. Although respondents with a chronic disease did not fear cancer treatment when compared with those without a chronic disease (N1: OR, 0.63; 95% CI, 0.42–0.98), they were less likely to want to know if they have cancer (N2: OR, 1.4; 95% CI, 1.00–1.97).
DISCUSSION
The ways in which people respond to cancer or a cancer diagnosis is highly dependent on their socioeconomic, cultural, and demographic backgrounds. In particular, how and in which direction those variables modify beliefs and attitudes in a rapidly industrialized country may be distinctive. The present study's results reflect a complicated context of cancer beliefs in Korea that are unlike the findings of studies conducted in Western populations.
Some results of the present study are consistent with those of a UK study that used the same questionnaire.12 The rates of agreement with all positive cancer beliefs were 84.8%–88.5%, which were similar or slightly lower than 88.0%–97.6% in the UK study with older adults. Considering the optimistic attitudes towards cancer, the rates of agreement with negative cancer beliefs were as high as 40.5%–79.9% overall (Table 1); the highest rate of agreement was with the statement that cancer treatment is worse than the cancer itself. Across all the age groups, 35.6%–87.7% agreed with negative beliefs (Table 2), which was roughly 30% higher than the results of the study with the UK adults (8.3%–52.9%).12 The relatively high prevalence of negative attitudes among the Koreans is consistent with the results of another study, which found that 58.4% of Koreans believed that cancer is an untreatable disease, regardless of the recent developments in the medical sciences and the improved survival rates.17 The Western studies conducted with ethnic minorities also found that Asians had more fatalistic and negative beliefs than the other ethnic groups210; however, they used education level as an index for representing SES instead of income level.
The high percentage of both positive and negative attitudes towards cancer can be explained by the dual nature of information processing by humans. That is, the individual's response to cancer is a dual system consisting of an intuitive and immediate sense of death that is linked to negative attitudes, and a subsequent, deliberative, and rational perception that is linked to positive attitudes.2122 The items from the ABC used in the present study might have included these dual aspects of cancer-related information. The items such as “These days, many people with cancer can expect to continue with normal activities and responsibilities,” “Cancer can often be cured,” and “Going to the doctor as quickly as possible after noticing a symptom of cancer could increase the chances of surviving” are related to the beliefs that can be influenced by messages from newspapers, TV, books, magazines, or word of mouth based on statistical facts. On the other hand, the items such as “Most cancer treatment is worse than the cancer itself,” “I would NOT want to know if I have cancer,” and “A cancer diagnosis is a death sentence” would be related to the beliefs formed by direct observation of neighborhoods and can spread by storytelling of cancer survivors or caregivers. Therefore, such negative beliefs can be regarded as natural phenomena induced by anxiety due to negative emotion such as fear.
In Asian populations, these conflicting attitudes can be further attributed to the unique cultural factors. Some qualitative studies using ethnographic interviews have described a more complex belief system and fatalistic view in the Asian culture.9 In a recent study of Chinese patients with cancer, the researchers observed contradictory behavioral and cognitive aspects among the participants. The participants actively engaged in self-care management, but were simultaneously fatalistic, which the researchers depicted as “fatalistic voluntarism”.23 This finding might be related to the preference of Confucian cultures for moderate states of balance between positive and negative events rather than extreme states of balance.24 A dual negative and positive attitude in the present study can be seen in a similar vein.
Nevertheless, the specific finding of a positive association between higher income level and more negative beliefs remains unresolved. Unlike educational level and participation in economic activity, higher income levels were linked to the negative statements that expressed fear of a cancer diagnosis and undergoing cancer treatment. Oddly, this finding contradicts the accumulated results of studies with Western samples which reported that groups with lower SES were more likely to hold fatalistic beliefs or negative attitudes.45 One possible explanation is that higher income groups in Korea perceive health risks differently from those in western communities, where the phenomena were deeply influenced by the country's social and cultural environments. The higher income groups in Korea might have preferred the negative statements because they were more acutely aware of the risks of cancer, acknowledging it as the leading cause of death in Korea. Studies on risk perception in various contexts in Korea have found that the optimism of higher income groups was more realistic, and their risk perception was less distorted and more acute.2526 The finding that the Koreans who lived in the Metropolitan cities had more negative attitudes than those who lived in the provinces can be understood by taking the same perspective, which is also inconsistent with the results of western studies.1727
The present study has some limitations; first, we used the ABC questionnaire for Korean adults aged 20–79 years; however, it was originally developed and demonstrated for older populations at least 50 years of age and its reliability was tested under such conditions. Second, it was not clearly interpreted why the educational level was not significantly associated with the attitudes to cancer in contrast to the income level. In line with our result, Cho et al.17 did not observe any relation between education and the cancer belief. Nevertheless, higher education level was related to lower agreement rates in the negative statements as in the case of income level, although those were not statistically significant. The different effect between educational or income level in the risk perception of cancer would be carefully monitored in the future study.
In summary, the present results imply a complicated context of cancer beliefs in Korea, unlike those shown in the studies of Western populations. The contradictory attitudes toward cancer found in this study can be understood as being related to the dual nature of information processing; however, the negative attitudes of the higher income groups might have been influenced by their struggles to respond to various types of risk, rather than their unrealistic pessimism or fatalism. Likewise, the association between SES, attitudes toward cancer, and health behaviors may not have a single or straightforward direction but it can vary depending on the diversity of the contexts.
 XML Download