

 PDF
PDF Citation
 Print
Print


INTRODUCTION
Medical radiation is used to diagnose or treat diseases; and patients are exposed to radiation during the medical procedure. There has been increased public concern regarding the increased exposure to medical radiation because medical radiation facilities have been rapidly introduced into the domestic health care fields.
The United Nations Scientific Committee on the Effects of Atomic Radiation (UNSCEAR), published in 2010, reported that the world's per-person effectiveness dose attributed to medical radiation from 1997 to 2007 was 0.62 mSv, which accounted for about 20% of the total exposure to ionizing radiation.1 According to a report issued by the Ministry of Food and Drug Safety of Korea (MFDS), issued in 2013, the total radiation dose of the entire population from exposure to medical radiation was about 68,000 man.Sv in 2011, which showed an increase of 50% from about 45,000 man.Sv in 2007. The amount exposed to medical radiation increased about 10% annually, and the per-capita effective dose recorded about 1.4 mSv in 2011, which was a 50% increase over the year 2007.2
Exposure to low-dose radiation stochastically increases the risk of cancer incidence, and there have also been longitudinal studies that demonstrate causal relationships between cancer incidence and exposure to low-dose medical radiation.34 Furthermore, the largest-ever consortium, the International pediatric computed tomography scan study (EPI-CT) in EU, has been conducting projects for this purpose,5 which justifies the need for Korea to engage in studies on the health effects of low-dose medical radiation.
In 2004, a study reported risk of cancer incidence attributable to diagnostic medical radiation estimated by using a statistical model in the British population.6 In their estimation, they used the model presented by the UNSCEAR in 2000 that was developed from the cohort of Japanese A-bomb survivors, where they calculated that 0.6% of the total cancer cases occurred cumulatively in people up to age 75 were caused by exposure to diagnostic medical radiation. When the same model was applied to 14 countries, the fraction was the lowest at 0.6% in UK, while it was the highest at 2.9% in Japan.
In the present study, we applied to Korea the estimation model established on the data of the Japanese A-bomb survivor cohort for the purpose of estimating the fractions of the cancer incidence and mortality attributed to exposure to low-dose radiation. We aimed to show how much the exposure to medical radiation contributes to the total cancer incidence and mortality of the entire population and address the importance of the use of optimized diagnostic medical radiation.
Go to : 
METHODS
Estimated organ doses
We used values obtained from currently available published data for estimation of the organ doses attributable to various types of medical radiation. We used local data on organ doses attributable to various types of radiography, where available.78 Unless the data are available locally, we used the data quoted by the previous study in UK6; as for positron emission tomography (PET)-computed tomography (CT), we used the organ doses presented by Huang et al.9 A suggested list of 25 items for the types of radiographic scanning which includes the panoramic radiography proposed by the previous study6 and PET-CT was used (Table 1). Further, we utilized the results of the study conducted by Kim et al.10 for individual organ doses received from a medical checkup at private clinics.
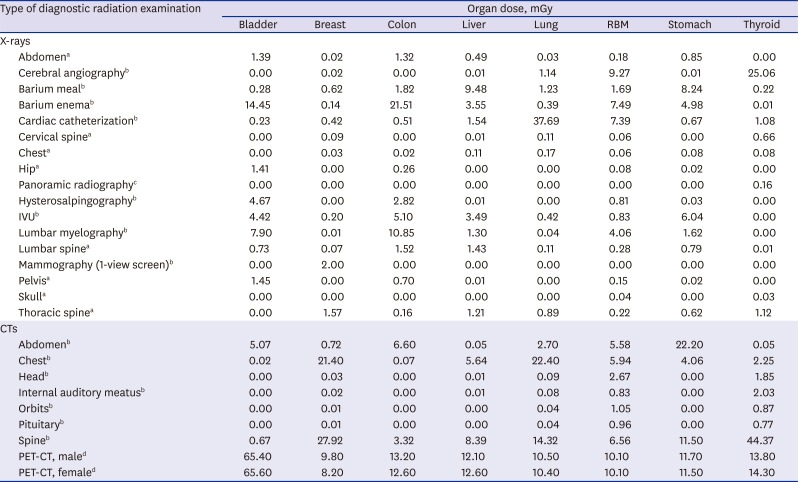
Table 1
Estimated organ doses (mGy) by type of diagnostic medical radiation
RBM = red bone marrow, IVU = intravenous urogram, CT = computed tomography, PET = positron emission tomography.
![]()
Medical radiation use frequency and calculation of organ dose of population subgroups
We divided into 4 the sources from which we can obtain data on how much the entire Korean population has been exposed to medical radiation for a year.
The first source is medical treatments that are covered by the National Health Insurance Service (NHIS), which can be obtained from the Health Insurance Review & Assessment-National Patient Sample (HIRA-NPS) of the Health Insurance Review & Assessment (HIRA) Service updated in 2013.11 These data are a collection of medical records from about 1.4 million patients, which accounted for 3% of the total patients of the year. Because the data are generated with stratified sampling method by which data was extracted from each stratified group (32 strata of sex and 16 5-year age groups), we could assume HIRA-NPS represents the whole Korean population. The medical bill section of this data set contains such information items as treatment start date, main diagnosis, and sub diagnosis, which can be elaborated by the use of the medical records each of which details such information items as medical services, drugs, and treatment materials provided by the hospital. From these data, we checked the codes related to diagnostic radiation and calculated the frequencies of radiographic services rendered to the patients during the year in terms of sex and 5-year age group. In 2013, 90.0% of the entire population visited hospitals for medical treatment and checkup; accordingly, the above-mentioned frequencies were multiplied by 0.90 to re-calculate the frequencies of insurance benefits to the entire population.
The second source is health examinations performed nationwide by the NHIS. The adults of interest in this study undergo annually or biennially general health checkups or transitional age health checkups at the ages of 40 and 66 during which they are exposed to medical radiation at the time of X-ray scanning of the chest. As the cancer screening service is rendered on national level, they have their stomach and breasts checked for cancer once every 2 years from the age of 40 and have their colon examined for cancer once every year from the age of 50. For examination of the stomach, one has an option for either upper gastrointestinal series or gastroscopy; for the colon, one has a choice for double contrast barium enema or colonoscopy after the patient is subjected to a stool guaiac test. And, for the breasts, mammography is used. These data are obtained from the Korean Statistical Information Service12 and used to calculate the frequencies of examinations by sexes and 5-year age groups.
The third source is private health examinations. It is quite difficult to systematically obtain detailed information on the health examinations performed on private level. Based on the recent study of 296 hospital surveys nationwide,10 we calculated average radiation dose for each organ by gender, for one time private health examination: using the information of the frequency of medical radiation use in private health examination (72% CT, 16% gastro-colonography, 9% PET, and 3% X-ray) and the contributing proportion of CT to each organ (abdomen 39%, thorax 32.2%, cardiac angiography 19.5%, brain 2.5%, lumbar spine 2.5%, low dose lung 1.3%, and cervical spine 1.1%). Next, we obtained the information of private health examination prevalence by gender and 5-year age strata based on the 2013 Survey on National Health and Nutrition (Korea National Health and Nutrition Examination Survey [KNHANES]) conducted by the Center for Disease Control and Prevention.13 We utilized the frequency of answer “Yes” to a question “Have you ever had a general health check privately during the last 2 years?” in the questionnaire of 2013 KNHANES. The numbers were divided by 2 and assumed to be cross-sectional frequencies for sexes and 5-year age groups.
The fourth source is conscript health examinations performed by the Military Manpower Administration (MMA) that targets males aged 19 residing in Korea.14 In 2014, there were 351,075 individuals age 19 or more eligible for such examination; and they were included into the 15–19-aged male statistics assuming that they all received simple chest X-ray scans.
All the doses attributable to diagnostic medical radiation that were identified from those sources were added up; that is to say, the numbers of radiographs obtained from the medical bill payments, general health checks, and transitional ages health checkups of the NHIS, cancer screenings, conscript health examinations from the MMA, and private general medical examinations were calculated in terms of sexes and 5-year age groups, which were then multiplied by estimated organ doses and summed up. Using these data, we calculate the exposed organ doses attributable to total diagnostic medical radiation in terms of sexes and age groups.
Estimating lifetime attributable risks (LARs)
The Biological Effects of Ionizing Radiation (BEIR) VII report15 uses the concept of LAR, where medical radiation LAR indicates the risk of cancer incidence or mortality of an individual or age group resulting from exposure to medical radiation over their lifetime from birth to a specific point of time (at the age of 85 in this study). The LAR can be obtained by using both excess absolute risk (EAR) model and excess relative risk (ERR) model. The beta coefficients obtained from the EAR and ERR models are used to understand how many more persons will be exposed to such risk by each unit exposure and how the rate changes against the baseline.
The LAR at the age of “a” for a gender (sex) “g” who is exposed to exposure “D” at an exposure age “e” can be expressed in the following expression:
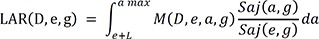
Where L = minimal latent period (5 year for solid cancers, 2 year for leukemia), Saj(a,g) = a survival rate for the gender “g” aged “a” unless the person suffers exposure to radiation, Saj(e,g)/Saj(e,g) = a conditional probability that a person survives from the exposure age “e” till an attained age, M(a,g) = baseline risk, ω = risk transport weight factor.
The background cancer incidence and mortality in 2013 were obtained from the Korea Central Cancer Registry at the National Cancer Center16 and the National Mortality Database provided by the Korean Statistical Information Service,17 respectively, and the probabilities of survival to age were also provided by the Korean Statistics Information Service.
Together with those data and the calculated organ doses per sex and 5-year age groups, by using the same cancer-specific parameters of the EAR and ERR models as are presented in the BEIR VII, we estimated the diagnostic medical radiation LARs in Koreans up to the age of 85 for cancers relating to the bladder, colon, liver, lung, stomach, thyroid, and breasts and leukemia.
The values obtained in the EAR and ERR model can be weighted to get LARs. As in the BEIR VII methodology, combined estimates are calculated from the weighted averages of the logarithmic scale of the estimates obtained from the EAR and ERR models, where relative risk transport was given a weight of 0.7 and absolute risk transport was given a weight of 0.3 (in the opposite way in case of lung cancer). For female breast cancer contrariwise, 100% EAR model was used. As for thyroid cancer, the estimates from the ERR model were used per se because those from the EAR model are not available. Finally, dose and dose-rate effectiveness factor (DDREF) 1.5 was applied to all the combined estimates.
Population attributable fractions (PAFs)
The information of background incidence16 and mortality,17 and the cancer-specific LARs calculated by the use of the actual number of population in 201318 were used to get their fractions of LARs and presented population PAFs and the number of patients attributable to diagnostic medical radiation exposure for each type of cancers. Finally, the total PAFs summed up from 7 male-dominant cancers and 8 female-dominant cancers were obtained and applied to the total cancer incidence, from which the LARs for all types of cancer were estimated for the Korean population aged up to 85. The figure shows how to come up with the PAF (Fig. 1).
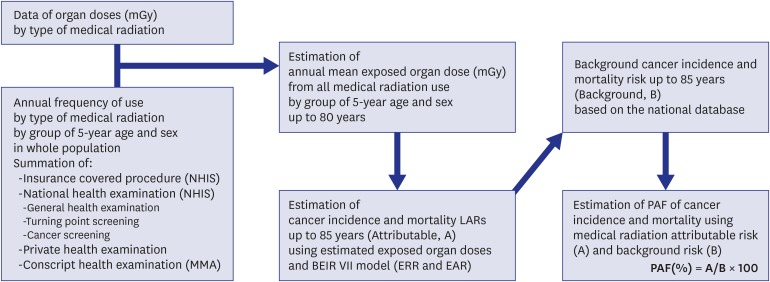 | Fig. 1Processes for estimating total cancer incidence and mortality risks attributed to diagnostic medical radiation in Korea, 2013.
NHIS = National Health Insurance Service, MMA = Military Manpower Administration, LAR = lifetime attributable risk, BEIR = biological effects of ionizing radiation, EAR = excess absolute risk, ERR = excess relative risk, PAF = population attributable fraction.
|
The R version 3.1.3 (R Foundation, Vienna, Austria; Comprehensive R Archive Network: http://cran.r-project.org) was used in data management and mathematical calculation.
Ethics statement
The study protocol was approved by the Institutional Review Board of Sungkyunkwan University (SKKU 2014-06-008).
Go to :
RESULTS
Diagnostic medical radiation exposure: organ dose
The annual average organ doses increase with increasing ages in both of the male and female age groups. In males aged up to 79, the dose in the lungs shows the highest with 57.73 mGy, while in females the dose in the stomach reads the highest with 51.57 mGy (Table 2).
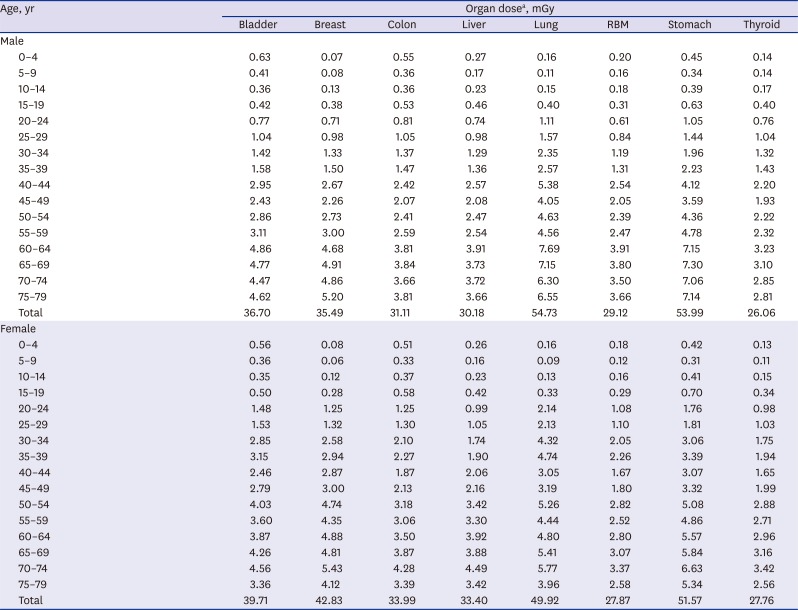
Table 2
Distribution of the mean annually exposed estimated organ doses (mGy) in whole Korean population by sex and age group in 2013
RBM = red bone marrow.
aOrgan dose calculated by summation of doses from various sources of medical services: insurance covered procedure from National Health Insurance System, National Health Examination (general health examination, turning point health screening, cancer screening), private health examination, and conscript health examination.
![]()
LARs for diagnostic medical radiation exposure
The LARs for cancer incidence show 0.38 stomach cancer cases, 0.31 lung cancer cases, and 0.27 colon cancer cases per 100,000 males and 1.45 thyroid cancer cases, 0.60 lung cancer cases, and 0.95 breast cancer cases per 100,000 females. The LARs for cancer mortality reveals that lung cancer was the top cause of cancer deaths in both sexes (male, 0.25; female, 0.40 per 100,000) (Table 3).
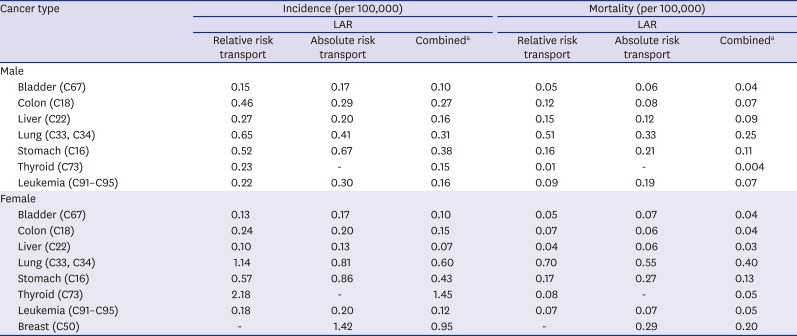
Table 3
LAR of cancer incidence and mortality for diagnostic medical radiation exposure in Korean population
LAR = lifetime attributable risk, BEIR = biological effects of ionizing radiation, EAR = excess absolute risk, ERR = excess relative risk, DDREF = dose and dose-rate effectiveness factor.
aBased on BEIR VII report,10 we combined estimates as a weighted average on a logarithmic scale based on relative and absolute risk transport. Except thyroid and female breast cancer, relative risk transport was given a weight of 0.7 and absolute risk transport was given a weight of 0.3 and these weights were reversed for lung cancer. Thyroid cancer estimate is only based on ERR model and breast cancer estimate is only based on EAR model. All combined estimates were reduced by a DDREF of 1.5.
![]()
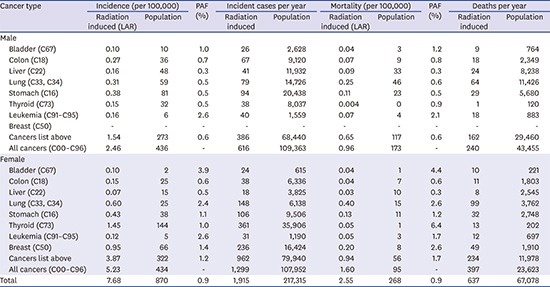
Diagnostic medical radiation-induced incidence and death cases of cancer and PAF
The PAFs are distributed from 0.3% to 6.4% depending on sexes and cancers. The PAF for leukemia incidence is the highest with 2.6% in males whereas that for bladder cancer is the highest with 3.9% in females. In terms of cancer mortality, the PAF for leukemia is the highest with 2.1% in males while that for thyroid cancer is the highest with 6.4% in females. The PAFs that reflect 7 male-dominant cancers indicate that medical radiation accounts for 0.6% of the cancer incidence and mortality respectively in males out of the total population. They also show that, in females and 8 female-dominant cancers, medical radiation accounts for 1.2% of their cancer cases and 1.7% of their mortality cases, which are larger than those in males. The PAF is estimated to be 0.9% in the entire population. When we assume that ionizing radiation has causal effect on the incidence of all cancers, total PAFs for both sexes could be applied to the incidence and mortality numbers of total cancer. A total of 1,915 cases of cancer and 637 cancer deaths in 2013, in association with exposure to diagnostic medical radiation over their lifetime, were found (Table 4).
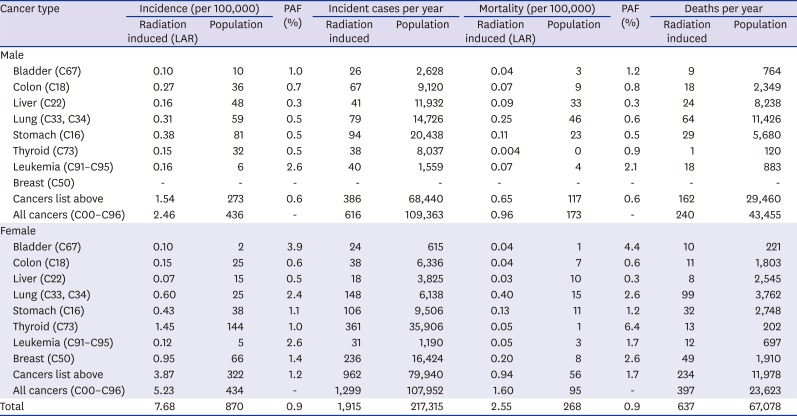
Table 4
LAR, PAF, and incident cases and death numbers induced by diagnostic medical radiation exposure up to 85 years in Korean population
Population cancer incidence and mortality in 2013 obtained from the Central Cancer Registry of National Cancer Center and Korea Statistical Information Service of the Statistic Korea, respectively.
LAR = lifetime attributable risk, PAF = population attributable fraction.
![]()
Go to :
DISCUSSION
In Korea, exposure to diagnostic medical radiation contributed to 0.9% (PAF) of the cancer incidence and mortality of the entire population. It accounted for 0.6% cancer incidence in males and 1.2% in females and for 0.6% cancer mortality in males and 1.7% in females. The estimated numbers of cancer cases and deaths were 1,915 and 637, respectively in 2013.
As of our knowledge, this is the first study to estimate burden of cancers due to diagnostic medical radiation exposure in Korea. The ratio of 0.9% attributed to the total cancer incidence by diagnostic medical radiation is a little higher than 0.6% estimated in the UK in 2004.6 This can be partly explained by the fact that this country where the National Health System is in effect had put potential exposures from medical radiation in stricter control than any other country has done. And, it also comes from the fact that the estimates used in this study were based on the data available around the year 2013 which is a 10-year time gap from what was used in the UK. As for the CTs that make up the greatest proportion to the collective dose, the UK had 7.02 CT machines per one million persons in 2004 and 7.89 in 2013, whereas Korea had 31.54 per one million persons in 2004 and 37.65 in 2013, from which it can be inferred that the population of the latter had been exposed by far more than that of the former.19
The PAF for diagnostic medical radiation was estimated to be higher in females than in males, which was in part attributed to the fact that the background cancer incidence and mortality in most cancerous tumors are lower in females than in males. Furthermore, the addition of breast cancer to the 7 cancers considered in males may be regarded as another reason. Also important are that there are differences between sexes in the magnitude of the cancer risk associated with ionizing radiation exposure and females are more sensitive to it than males.20
In terms of organ-specific PAFs, the highest PAF in mem was shown in bladder cancer and leukemia in the present study, which was consistent with those in the UK study. However, in women, besides bladder cancer, in which the high PAF was estimated both in the present study and the UK study, those in leukemia and lung cancer were high in the present study, which is dissimilar with the UK study. The possible reason of difference in organ-specific PAFs between studies needs to be investigated in the future, including differences in background incidence/mortality and frequency of specific medical radiation device.
However, there are possibilities that the results of this study may be underestimated due to the following several factors.
First of all, when the frequencies and doses were assessed from the insurance payments made by the NHIS, the types of medical radiation studied were limited. We used the same constant that Berrington de González and Darby6 did in their study, where all the types of medical radiation were assumed to account for 86% of the total annual average dose; however, the number may be different with that of Korea. The total dose irradiated to the entire population has a high possibility to be underestimated on the whole as diagnostic medical radiation was considerably diversified and much more widely used recently in Korea. This may result underestimation of PAFs of cancer incidence and mortality.
Secondly, the exposures to medical radiation of students during the health checkup initiated by the Ministry of Education and of workers that received under their companies' healthcare programs were not considered in this study due to the lack of data availability. That may have contributed to the underestimation of the PAFs.
On the other hand, this study derived the sex-age average doses from the information on exposure to diagnostic medical radiation performed mainly in 2013, based on which the LARs were calculated (a kind of single exposure model). However, in reality, people have been exposed multiple times over the lifetime, and the dose is increasing rapidly with the lapse of time. Accordingly, these PAFs need correcting by means of a multiple exposure model that reflects changes in the doses of medical radiation over a longer period of time, in order to obtain more accurate PAFs.
At the same time, whether the BEIR VII model is applicable to Korean population without any modification must be reviewed. The model was developed, based on the magnitudes of the risks derived from the studies on A-bomb survivors, with consideration given to the background cancer incidence and mortality of a population. Accordingly, as the population to be assessed differs, the accuracy of the model may suffer depending on the characteristics of the population. Another model that can compute LARs is Radiation Risk Assessment Tool (RadRAT), developed by the U.S. National Cancer Institute, which is an advancement to the BEIR VII model.21 Likewise, cancer risk estimation models that reflect Korean background cancer incidence and mortality must be considered in the future.
When it comes to diagnoses, interventions, and treatments that require medical radiation, exposure to such radiation differs in nature from exposure to other ionizing radiation in that the application is made voluntarily with prior consent. According to the principles of radiological protection in medicine presented by the International Commission on Radiological Protection (ICRP), the use of radiation must be justified and the protection of radiation must be optimized.2022 As for medical radiation, the principle of justification is basically met because the gain earned from the diagnosis and treatment of a patient outweighs the potential hazard suffered by it. Therefore, the principle of optimization is more important than any other thing.
Although we presented the estimates of high uncertainty in this study as they were calculated with many assumptions, we are sure that they can be used as a scientific basis by which misuse or abuse of diagnostic medical radiation can be curtailed. Additional studies on the use of medical radiation reflecting the benefits and losses resulting therefrom need to be conducted in the future.
Go to :
 XML Download