

 PDF
PDF ePub
ePub Citation
 Print
Print


Increasing demand and rising expenditure for total hip arthroplasty (THA) and total knee arthroplasty (TKA) have intensified efforts to identify preoperative risk factors and optimize patient outcomes.12) Malnutrition has emerged as one such preoperative risk factor for increased morbidity and mortality following joint arthroplasty.23) Although multiple surrogates for malnutrition have been proposed, including body mass index (BMI), serum transferrin, and direct body measurements, serum albumin concentration (normal range, 3.5 to 5.0 g/dL) has emerged as the leading marker for malnutrition.4567)
Hypoalbuminemia, defined as serum albumin < 3.5 g/dL, has been documented in the population undergoing joint arthroplasty, with prevalence up to 6.1%.48) Patients with hypoalbuminemia undergoing THA and TKA experience more postoperative complications, including surgical site infections, sepsis, pneumonia, postoperative ventilator use > 48 hours, and unplanned intubations.91011) Bohl et al.4) also found that joint arthroplasty patients with hypoalbuminemia faced a small (relative ratio, 0.20 days) but significantly extended length of stay (LOS) and a 40% increase in the rate of readmission. Most critically, hypoalbuminemia has been associated with a nearly six-fold increase in mortality following THA and TKA.911) The consequences of low serum albumin have sparked initiatives for preoperative correction of malnutrition, with several studies suggesting that perioperative complications may be reduced with nutrition regimens.31213)
Despite the significant association of serum albumin levels with morbidity and mortality, research has not yet characterized the role of serum albumin levels in predicting costs for THA or TKA. New mechanisms to predict and reduce costs have become increasingly important. In response to an increasing proportion of Medicare hospital payments for joint arthroplasties, bundled payment models were implemented to hold hospitals accountable for outcomes and expenditures.2) Mean episode-of-care payments can vary widely across total joint arthroplasty (TJA) procedures and largely depend upon patient comorbidities.14) Since the profit margin for institutions performing THAs and TKAs can be as low as 4.3%, every opportunity to optimize care and reduce costs can improve the economic feasibility of operating within a bundled payment system.15)
The purpose of this study was to investigate the effect of serum albumin levels on direct treatment cost for patients undergoing primary or revision THA and TKA. We also intended to characterize the role of serum albumin levels in predicting LOS and readmissions within 30 days. We hypothesized that lower serum albumin levels would be correlated with higher treatment costs in both primary and revision procedures given the association of hypoalbuminemia with perioperative complications.
METHODS
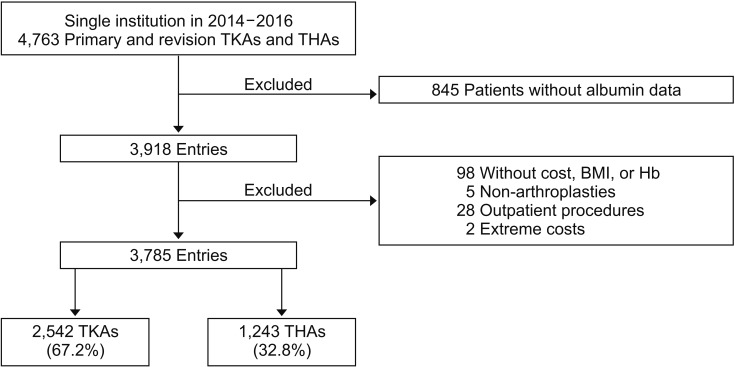
This was a retrospective study of all adult patients undergoing primary or revision THA or TKA at a single high-volume tertiary joint center with four surgeons (CLI, CLN, GCL, and ELH) between January 2014 and December 2016. Patients with missing data on preoperative serum albumin level, cost, BMI, or hemoglobin (Hb) level were excluded (Fig. 1). Also excluded were patients undergoing outpatient procedures or those who were extreme cost outliers (> $150,000). This study was approved as Protocol 814466 by the University of Pennsylvania Institutional Review Board prior to initiation.
Primary stratification was based on preoperative serum albumin level, with patients categorized into four groups: < 3.5 g/dL, 3.5 to < 4.0 g/dL, 4.0 to < 4.5 g/dL, and ≥ 4.5 g/dL. Secondary stratification was by type of procedure: primary TKA, revision TKA, primary THA, and revision THA. The primary outcome was total direct costs reported by the institution. Secondary outcomes included LOS at index hospitalization as well as readmission within 30 days. Demographics and comorbidities, including age, BMI, Hb, and glomerular filtration rate (GFR), were analyzed for differences between serum albumin cohorts.
Continuous variables were compared using the Kruskal-Wallis test, and categorical variables were compared using chi-square analysis. Total direct costs were analyzed as both absolute dollars and percentage change via the natural log of the cost (ln(cost)). Multivariable linear regressions were used to analyze continuous data (cost and LOS), while multivariable logistic regressions were utilized for binomial data (readmissions). Multivariable models were adjusted for serum albumin, age, BMI, Hb, GFR > 45 mL/min, and procedure type. In all comparisons, p < 0.05 was considered statistically significant. All statistical analyses were performed using STATA ver. 14.2 (StataCorp., College Station, TX, USA).
RESULTS
Demographics and Comorbidities
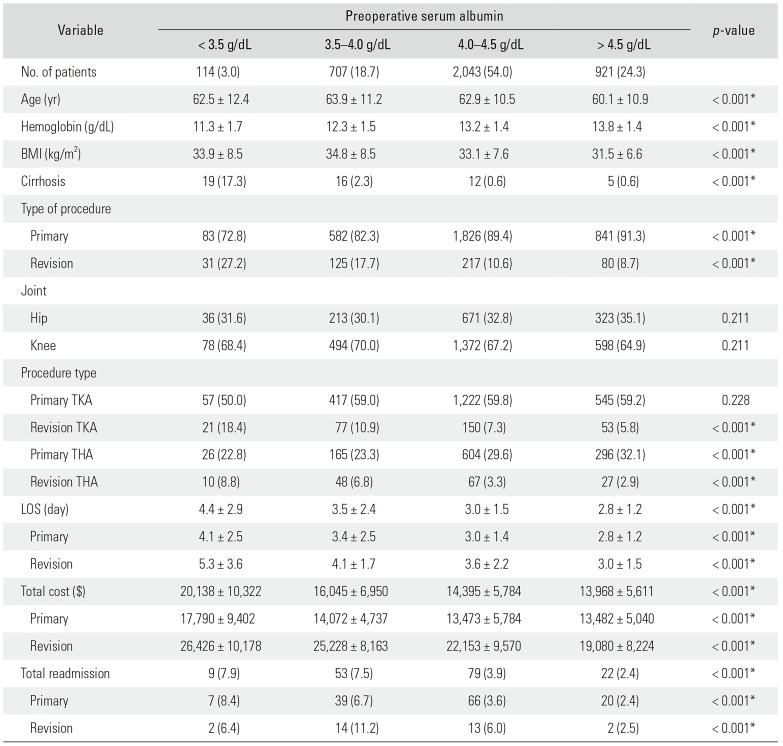
Of 4,763 initial patients, 3,785 (79.5%) met inclusion criteria (Fig. 1). As presented in Table 1, there were 114 patients (3.0%) with hypoalbuminemia. Another 707 (18.7%) patients had serum albumin 3.5 to < 4.0 g/dL, while 2,043 patients (54.0%) were between 4.0 and 4.5 g/dL and 921 patients (24.3%) had serum albumin > 4.5 g/dL. Patients with hypoalbuminemia tended to be older than patients with serum albumin > 4.5 g/dL (62.5 vs. 60.1 years, p < 0.001) and have higher rates of cirrhosis (17.3% vs. 0.6%, p < 0.001). Hb levels significantly decreased as serum album decreased (p < 0.001). Patients with hypoalbuminemia tended to undergo more revision procedures (27.2% vs. 8.7%, p < 0.001) but were not significantly different in the proportion of hip procedures relative to knee procedures (31.6% vs. 35.1%, p = 0.211) than those with serum albumin > 4.5 g/dL. Primary TKA constituted the majority of procedures across all serum albumin levels, at 50.0% for those with hypoalbuminemia, followed by primary THA (22.8%) and revision TKA (18.4%).
Patients with hypoalbuminemia tended to have longer lengths of stay than those with the highest serum albumin levels (4.4 vs. 2.8 days, p < 0.001), a trend that persisted for both primary procedures (4.1 vs. 2.8 days, p < 0.001) as well as revision procedures (5.3 vs. 3.0 days, p < 0.001). Patients with hypoalbuminemia also had higher total costs, which trended downward as serum albumin levels increased to > 4.5 g/dL ($20,138 vs. $13,968, p < 0.001). This trend of decreasing costs with increasing serum albumin persisted across both primary and revision procedures (p < 0.001). Finally, readmission within 30 days was highest in patients with hypoalbuminemia and lowest in those with serum albumin > 4.5 g/dL (7.9% vs. 2.4%, p < 0.001). This trend persisted for both primary and revision procedures.
Cost Analysis
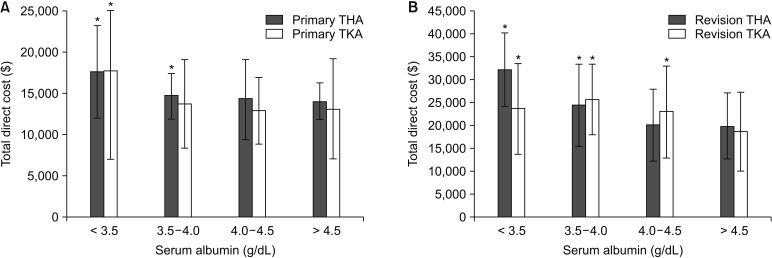
Unadjusted costs by serum albumin level and procedure type (primary vs. revision) are presented in Fig. 2. Hypoalbuminemia was associated with significantly increased costs for both primary THA ($17,735 vs. $14,031, p < 0.001) and primary TKA ($17,815 vs. $13,184, p < 0.001) relative to those with serum albumin > 4.5 g/dL. This trend was also observed for revision procedures, as patients with hypoalbuminemia had significantly higher costs for revision THA ($32,275 vs. $19,818, p < 0.001) and revision TKA ($23,640 vs. $18,704, p < 0.001). A serum albumin level of 3.5–4.0 g/dL was also associated with significantly higher costs relative to serum albumin > 4.5 g/dL for both primary and revision THA procedures, as well as for revision TKA procedures.
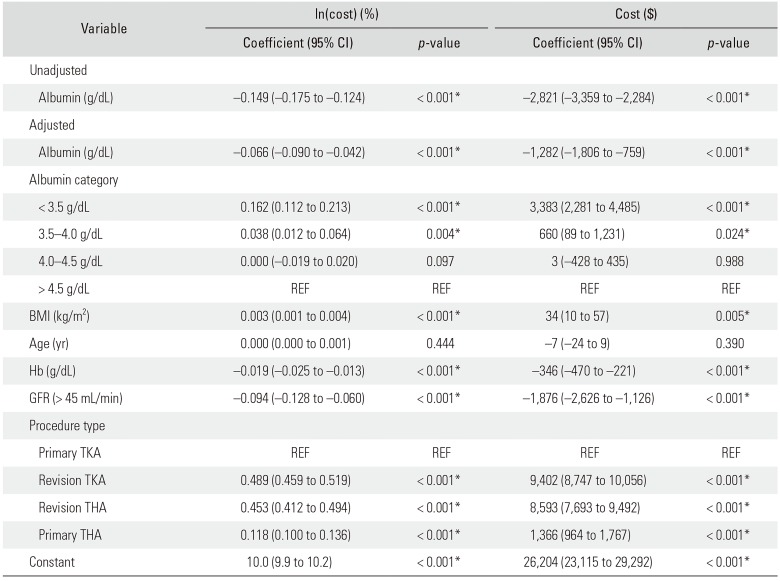
Multivariable regressions on cost are reported in Table 2. In the unadjusted analysis, each 1.0 g/dL increase in preoperative serum albumin level was associated with a 14.9% reduction in costs (β, −0.149; 95% confidence interval [CI], −0.175 to −0.124; p < 0.001), or an average savings of $2,821 (95% CI, $2,384 to $3,359). Upon adjustment for covariates, including procedure type and joint, a preoperative serum albumin level increase of 1.0 g/dL was associated with a 6.6% reduction in costs (β, −0.066; 95% CI, −0.090 to −0.042; p < 0.001), or an average savings of $1,282 (95% CI, $759 to $1,806). Multivariable analysis indicated that procedure type was also a significant predictor of total direct costs. Relative to primary TKAs, revision TKAs increased costs by 48.9% (β, 0.489; 95% CI, 0.459 to 0.519; p < 0.001), primary THAs increased costs by 11.8% (β, 0.118; 95% CI, 0.100 to 0.136; p < 0.001), and revision THAs increased costs by 45.3% (β, 0.453; 95% CI, 0.412 to 0.494; p < 0.001).
When cost regressions were run on serum albumin categories, hypoalbuminemia was associated with a significant 16.2% increase in costs (0.162; 95% CI, 0.112 to 0.213; p < 0.001) relative to costs of patients with a preoperative serum albumin > 4.5 g/dL. This reduction in costs corresponded to an average cost increase of $3,383 (95% CI, $2,281 to $4,485), and the association was independent of joint and procedure type. Serum albumin levels of 3.5–4.0 g/dL were also associated with a significant 3.8% rise in direct costs (0.038; 95% CI, 0.012 to 0.064; p = 0.004), corresponding to a $660 increase in cost (95% CI, $89 to $1,231). Patients with serum albumin 4.0–4.5 g/dL did not face increased costs relative to those with serum albumin > 4.5 g/dL (p = 0.097).
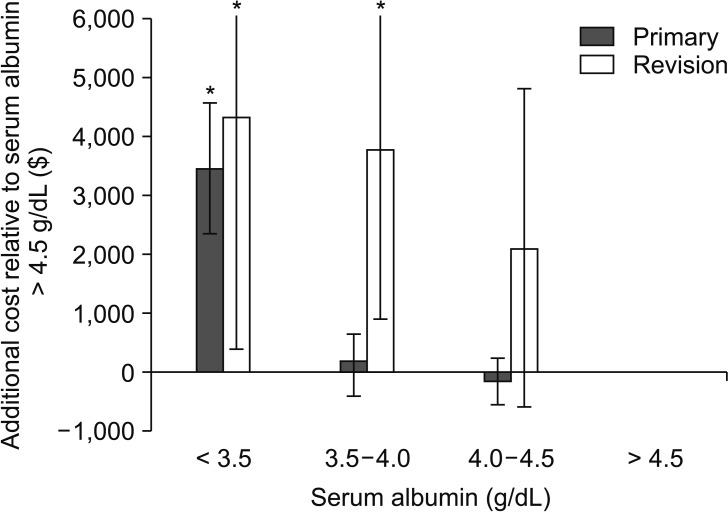
The results of adjusted multivariable regressions on cost, specific to primary and revision procedures, are presented in Fig. 3. Hypoalbuminemia was associated with an average cost increase of $3,446 for primary procedures (p < 0.001) relative to serum albumin > 4.5 g/dL. Revision procedures cost significantly more, with an average cost increase of $4,322 (p = 0.034) for patients with hypoalbuminemia relative to those with the highest serum albumin levels. In addition to increased expenditures for hypoalbuminemic patients, those with serum albumin 3.5–4.0 g/dL who underwent revision procedures also experienced an average cost increase of $3,787 (p = 0.008) relative to those with serum albumin > 4.5 g/dL. Those with serum albumin 4.0–4.5 g/dL did not have increased costs in primary or revision procedures relative to those with > 4.5 g/dL.
LOS and Readmission Analysis
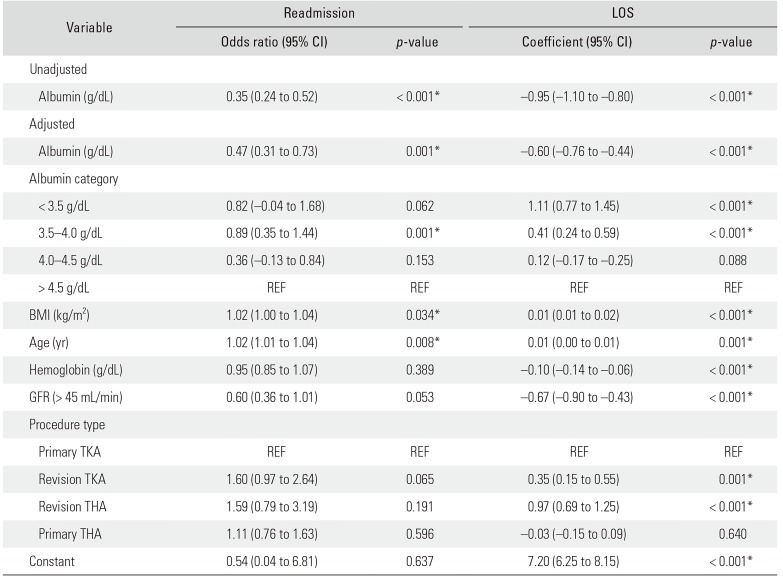
The adjusted effect of serum albumin levels on readmissions and LOS is displayed in Table 3. Multivariable regressions found that a 1-point increase in serum albumin levels resulted in a 53% reduction in readmissions (odds ratio, 0.47; 95% CI, 0.31 to 0.73; p = 0.001). Adjusted multivariable regressions also found that every 1-point increase in preoperative serum albumin resulted in a significant reduction in LOS by 0.6 days (β, −0.60; 95% CI, −0.76 to −0.44; p < 0.001). Index hospitalization LOS varies by serum albumin group, as patients with serum albumin < 3.5 g/dL (β, 1.11; 95% CI, 0.77 to 1.45; p < 0.001) and 3.5–4.0 g/dL (β, 0.41; 95% CI, 0.24 to 0.59; p < 0.001) face increased LOS relative to those with serum albumin > 4.5 g/dL. Relative to primary TKAs, patients with revision TKA (β, 0.35; 95% CI, 0.15 to 0.55; p = 0.001) and revision THA (β, 0.97; 95% CI, 0.69 to 1.25; p < 0.001) faced increased LOS.
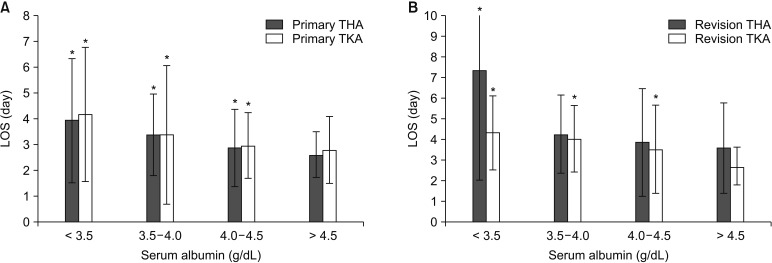
The relationship of decreasing LOS with increasing serum albumin in both primary and revision procedures is presented in Fig. 4. Hypoalbuminemia was associated with significantly increased LOS for primary THA (4.0 vs. 2.6 days, p < 0.001) and primary TKA (4.2 vs. 2.8 days, p < 0.001) relative to those with serum albumin > 4.5 g/dL. Revision procedures required longer lengths of stay, but this trend across serum albumin levels persisted, as those with hypoalbuminemia had higher LOS for revision THA (7.3 vs. 3.6 days, p < 0.001) and revision TKA (4.3 vs. 2.7 days, p < 0.001). All serum albumin classes lower than serum albumin > 4.5 g/dL were associated with significantly longer lengths of stay for both primary THA and TKA. For revision procedures, both serum albumin 3.5–4.0 g/dL and 4.0–4.5 g/dL were associated with significantly increased LOS following revision TKA.
DISCUSSION
Given the increasing utilization of TKAs and THAs, and the implementation of bundled payment initiatives, there is heightened focus on identifying preoperative risk factors to improve patient outcomes and costs. One potential modifiable preoperative risk factor associated with increased morbidity and mortality is malnutrition, for which serum albumin serves as a widely accepted surrogate marker.3911) The present study examined 3,785 primary and revision THA and TKA patients to identify the institutional costs associated with serum albumin levels. We found that decreasing serum albumin levels are associated with significantly greater total direct costs, with each 1 g/dL reduction in serum albumin increasing direct costs on average by $1,282 per unit albumin. Increasing costs were observed in both primary and revision procedures.
While serum albumin levels have been associated with increased morbidity and mortality, our analysis is the first to report the increased cost burden of low serum albumin levels. The benefit of identifying preoperative serum albumin and its costs is the potential opportunity for preoperative correction of malnutrition, which has been shown to improve postoperative outcomes.313) Importantly, the cost impact of serum albumin is much greater than, and independent of, a patient's BMI, which is useful given that preoperative correction of serum albumin may be more feasible than preoperative reductions in BMI.312) Since previous research reports that cost margins for joint arthroplasties under bundled payment initiatives are as low as 4.3%, the potential to reduce costs through preoperative serum albumin correction could impact the financial feasibility of THAs and TKAs.15) Since hypoalbuminemia is associated with increased comorbidities, future research should explore whether preoperative serum albumin correction specifically can improve outcomes and reduce costs.
Our findings suggest that there are diminishing marginal returns to increasing preoperative serum albumin. Patients with hypoalbuminemia (< 3.5 g/dL) are of primary concern since they experienced the greatest increase in costs at 16.2%, or on average $3,383, relative to patients with serum albumin > 4.5 g/dL. Serum albumin levels of 3.5–4.0 g/dL were also associated with a significant 3.8% increase in cost, representing an average cost difference of $660, indicating that borderline hypoalbuminemic patients may also be considered for preoperative intervention. Costs are not increased for patients with serum albumin 4.0–4.5 g/dL, indicating the diminishing benefits of increased serum albumin and the need to focus on patients with especially low serum albumin levels. Future efforts at preoperative modification of nutritional levels should account for the costs associated with treatment, counseling, laboratory tests, nutritional supplementation, and other costs associated with this potential preoperative optimization.
The mechanism by which serum albumin levels increase costs remains unclear. The relationship between hypoalbuminemia and postoperative complications, including postoperative infection, ventilator use > 48 hours, and unplanned intubations, are well-documented.45910) Postoperative complications may be the drivers of increased costs in patients with lower serum albumin, as one institution reported that the average cost of medical complications was $22,775 following THA and $24,183 following TKA.16) However, there is also a strong association of lower serum albumin levels and increasing LOS, with an average increase of 1.1 days for serum albumin < 3.5 g/dL and 0.4 days for serum albumin 3.5–4.0 g/dL relative to patients > 4.5 g/dL. Some combination of these relationships may be driving the reduction in costs observed with increased serum albumin.
It is important to note that despite the cost association with hypoalbuminemia, joint type and revision procedures remain the primary drivers of total direct costs. While hypoalbuminemia increases costs on average by $3,383, revision TKAs were associated with an average cost increase of $9,402. Despite not serving as the primary driver of costs, there is value to understanding the cost burden of hypoalbuminemia. The opportunity for preoperative nutritional management could lead to potential improvements in financial feasibility for TJA. If preoperative correction can raise serum albumin and reduce the risk of postoperative complications, initiatives may also lower the proportion of subsequent revision procedures.31213)
This study likely underestimates the true cost burden of serum albumin levels, as we were unable to account for the cost of subsequent readmissions, which are associated with greater expenditure for both TKA and THA episodes.1718) In this study, lower serum albumin was associated with increased readmission, but we did not trace the costs associated with the readmission. Given institutional reports that readmission for surgical complications costs an average of $36,038 for THA and $38,953 for TKA, the true total cost burden of lower serum albumin levels is likely much higher.16) If initiatives to address lower preoperative serum albumin are successful, the potential for cost savings may be even greater than reported in this study.
This study has several limitations. First, we recognize the limitations of our retrospective study design in an administrative data set. Second, a small proportion of patients suffered from hypoalbuminemia (3.0%), although this proportion was similar to proportions reported in other studies of hypoalbuminemia surrounding joint arthroplasty.49) Third, our study lacked data on several patient demographics and comorbidities, including gender, insurance status, and conditions like diabetes, hypertension, and history of malignancy, that could be confounding the predictive role of albumin. Despite this limitation, we believe there is value in analyzing broad trends to allow for cost predictions across an entire population receiving TKAs and THAs. Furthermore, 845 patients did not have a preoperative serum albumin measured, which could bias our analysis toward patients with more comorbidities if these patients without a serum albumin measurement were healthier. Fourth, our study only accessed the total direct costs for the index hospitalization and was unable to account for the costs of readmissions that would likely increase the predicted cost burden of serum albumin levels. Nevertheless, this does not change the findings that hypoalbuminemia is associated with costs and LOS/readmission metrics. Finally, our study encompassed only a single large academic medical center, which may limit generalizability to other healthcare settings or populations with lower incidences of hypoalbuminemia or revision arthroplasty.
In conclusion, hypoalbuminemia was significantly associated with increased total direct costs following both primary and revision THA and TKA. This study was the first to identify the increasing costs associated with low serum albumin levels in joint arthroplasty patients. Decreasing albumin levels were also associated with increased LOS and a greater rate of readmission within 30 days. While joint type and procedure remain the primary drivers of cost, preoperative serum albumin levels should be considered in initiatives to optimize patient outcomes while reducing overall costs. Future research should prospectively explore whether preoperative correction of hypoalbuminemia yields the anticipated cost savings.
 XML Download